

- Executive Summary
- Global Smart Cities Market Snapshot 2025 and 2032
- Market Opportunity Assessment, 2025-2032, US$ Bn
- Key Market Trends
- Industry Developments and Key Market Events
- Demand Side and Supply Side Analysis
- PMR Analysis and Recommendations
- Market Overview
- Market Scope and Definitions
- Value Chain Analysis
- Macro-Economic Factors
- Global GDP Outlook
- Global Urbanization and Demographic Shifts Industry Overview
- Global Economic Growth and Investment Capacity Overview
- Global Government Policies and Regulatory Environment
- Forecast Factors – Relevance and Impact
- COVID-19 Impact Assessment
- PESTLE Analysis
- Porter's Five Forces Analysis
- Geopolitical Tensions: Market Impact
- Regulatory and Technology Landscape
- Market Dynamics
- Drivers
- Restraints
- Opportunities
- Trends
- Price Trend Analysis, 2019 – 2032
- Region-wise Price Analysis
- Price by Segments
- Price Impact Factors
- Global Smart Cities Market Outlook: Historical (2019 – 2024) and Forecast (2025 – 2032)
- Key Highlights
- Global Smart Cities Market Outlook: Components
- Introduction/Key Findings
- Historical Market Size (US$ Bn) and Volume (Units) Analysis by Components, 2019-2024
- Current Market Size (US$ Bn) and Volume (Units) Forecast, by Components, 2025-2032
- Hardware
- Software
- Services
- Market Attractiveness Analysis: Components
- Global Smart Cities Market Outlook: Application
- Introduction/Key Findings
- Historical Market Size (US$ Bn) and Volume (Units) Analysis by Application, 2019-2024
- Current Market Size (US$ Bn) and Volume (Units) Forecast, by Application, 2025-2032
- Smart Security
- Smart Building
- Smart Transportation
- Smart Governance
- Smart Energy
- Smart Healthcare
- Smart Water Network Systems
- Smart Education
- Market Attractiveness Analysis: Application
- Global Smart Cities Market Outlook: Region
- Key Highlights
- Historical Market Size (US$ Bn) and Volume (Units) Analysis by Region, 2019-2024
- Current Market Size (US$ Bn) and Volume (Units) Forecast, by Region, 2025-2032
- North America
- Europe
- East Asia
- South Asia & Oceania
- Latin America
- Middle East & Africa
- Market Attractiveness Analysis: Region
- North America Smart Cities Market Outlook: Historical (2019 – 2024) and Forecast (2025 – 2032)
- Key Highlights
- Pricing Analysis
- North America Market Size (US$ Bn) and Volume (Units) Forecast, by Country, 2025-2032
- U.S.
- Canada
- North America Market Size (US$ Bn) and Volume (Units) Forecast, by Components, 2025-2032
- Hardware
- Software
- Services
- North America Market Size (US$ Bn) and Volume (Units) Forecast, by Application, 2025-2032
- Smart Security
- Smart Building
- Smart Transportation
- Smart Governance
- Smart Energy
- Smart Healthcare
- Smart Water Network Systems
- Smart Education
- Europe Smart Cities Market Outlook: Historical (2019 – 2024) and Forecast (2025 – 2032)
- Key Highlights
- Pricing Analysis
- Europe Market Size (US$ Bn) and Volume (Units) Forecast, by Country, 2025-2032
- Germany
- Italy
- France
- U.K.
- Spain
- Russia
- Rest of Europe
- Europe Market Size (US$ Bn) and Volume (Units) Forecast, by Components, 2025-2032
- Hardware
- Software
- Services
- Europe Market Size (US$ Bn) and Volume (Units) Forecast, by Application, 2025-2032
- Smart Security
- Smart Building
- Smart Transportation
- Smart Governance
- Smart Energy
- Smart Healthcare
- Smart Water Network Systems
- Smart Education
- East Asia Smart Cities Market Outlook: Historical (2019 – 2024) and Forecast (2025 – 2032)
- Key Highlights
- Pricing Analysis
- East Asia Market Size (US$ Bn) and Volume (Units) Forecast, by Country, 2025-2032
- China
- Japan
- South Korea
- East Asia Market Size (US$ Bn) and Volume (Units) Forecast, by Components, 2025-2032
- Hardware
- Software
- Services
- East Asia Market Size (US$ Bn) and Volume (Units) Forecast, by Application, 2025-2032
- Smart Security
- Smart Building
- Smart Transportation
- Smart Governance
- Smart Energy
- Smart Healthcare
- Smart Water Network Systems
- Smart Education
- East Asia Market Size (US$ Bn) and Volume (Units) Forecast, by , 2025-2032
- South Asia & Oceania Smart Cities Market Outlook: Historical (2019 – 2024) and Forecast (2025 – 2032)
- Key Highlights
- Pricing Analysis
- South Asia & Oceania Market Size (US$ Bn) and Volume (Units) Forecast, by Country, 2025-2032
- India
- Southeast Asia
- ANZ
- Rest of SAO
- South Asia & Oceania Market Size (US$ Bn) and Volume (Units) Forecast, by Components, 2025-2032
- Hardware
- Software
- Services
- South Asia & Oceania Market Size (US$ Bn) and Volume (Units) Forecast, by Application, 2025-2032
- Smart Security
- Smart Building
- Smart Transportation
- Smart Governance
- Smart Energy
- Smart Healthcare
- Smart Water Network Systems
- Smart Education
- Latin America Smart Cities Market Outlook: Historical (2019 – 2024) and Forecast (2025 – 2032)
- Key Highlights
- Pricing Analysis
- Latin America Market Size (US$ Bn) and Volume (Units) Forecast, by Country, 2025-2032
- Brazil
- Mexico
- Rest of LATAM
- Latin America Market Size (US$ Bn) and Volume (Units) Forecast, by Components, 2025-2032
- Hardware
- Software
- Services
- Latin America Market Size (US$ Bn) and Volume (Units) Forecast, by Application, 2025-2032
- Smart Security
- Smart Building
- Smart Transportation
- Smart Governance
- Smart Energy
- Smart Healthcare
- Smart Water Network Systems
- Smart Education
- Middle East & Africa Smart Cities Market Outlook: Historical (2019 – 2024) and Forecast (2025 – 2032)
- Key Highlights
- Pricing Analysis
- Middle East & Africa Market Size (US$ Bn) and Volume (Units) Forecast, by Country, 2025-2032
- GCC Countries
- South Africa
- Northern Africa
- Rest of MEA
- Middle East & Africa Market Size (US$ Bn) and Volume (Units) Forecast, by Components, 2025-2032
- Hardware
- Software
- Services
- Middle East & Africa Market Size (US$ Bn) and Volume (Units) Forecast, by Application, 2025-2032
- Smart Security
- Smart Building
- Smart Transportation
- Smart Governance
- Smart Energy
- Smart Healthcare
- Smart Water Network Systems
- Smart Education
- Competition Landscape
- Market Share Analysis, 2024
- Market Structure
- Competition Intensity Mapping
- Competition Dashboard
- Company Profiles
- Cisco Systems, Inc.
- Company Overview
- Product Portfolio/Offerings
- Key Financials
- SWOT Analysis
- Company Strategy and Key Developments
- Microsoft Corporation
- IBM Corporation
- General Electric
- AT&T
- Ericsson
- Huawei Technologies Co., Ltd.
- Oracle Corporation
- Panasonic Corporation
- SAP
- Siemens AG
- Schneider Electric
- Signify
- Hitachi Vantara
- Cisco Systems, Inc.
- Appendix
- Research Methodology
- Research Assumptions
- Acronyms and Abbreviations


- Communication Infrastructure & Services
- Smart Cities Market
Smart Cities Market Size, Trends Share, and Growth Forecasts, 2025 - 2032
Smart Cities Market by Component (Hardware, Software, Services), Application (Smart Security, Smart Building, Smart Transportation, Smart Governance, Smart Energy, Smart Healthcare, Smart Education), and Regional Analysis for 2025 - 2032
Smart Cities Market Share and Trends Analysis
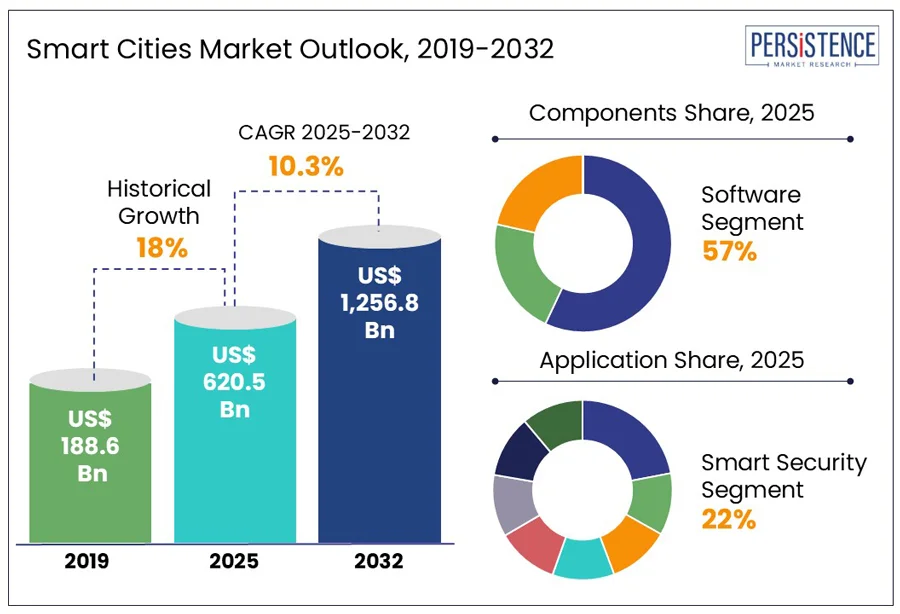
The global smart cities market size is predicted to reach a size of US$ 620.5 Bn by 2025. It is anticipated to witness a CAGR of 18% during the forecast period to attain a value of US$ 1,256.8 Bn by 2032.
Smart cities aim to reduce carbon footprints through energy-efficient solutions, such as smart grids and public transportation systems. By 2030, around 60% of the global population is estimated to live in urban areas. This shift induces smart infrastructure to handle increased demands for energy, water, and transportation.
Urban development is increasingly influenced by a blend of socio-economic, environmental, and technological drivers. In response to challenges such as traffic congestion, energy inefficiency, waste management, and public safety, governments and municipalities are spending on designing smart infrastructure. This trend is further supported by rapid advancements in enabling technologies, particularly the Internet of Things (IoT), artificial intelligence (AI), and 5G connectivity, which allows real-time data collection and analysis. These capabilities significantly enhance decision-making processes and operational efficiency across urban systems.
Key Highlights of the Smart Cities Market:
- By 2032, over 50 billion IoT devices are estimated to be deployed in smart city applications globally.
- Integration of AI technologies is driving predictive analytics for urban planning, traffic management, and public safety.
- AI-based traffic systems are set to reduce urban congestion by 30% by 2032.
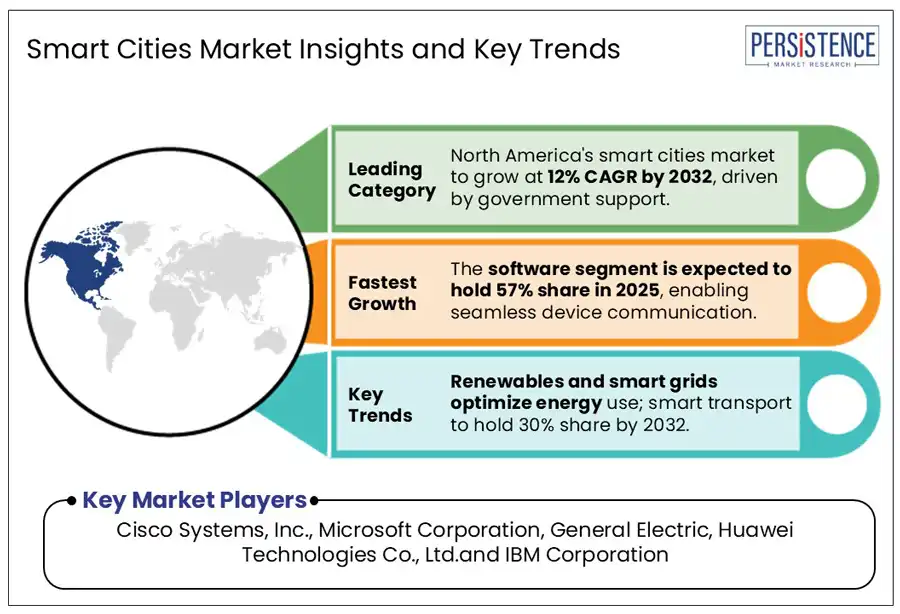
- Renewable energy sources and smart grids are being integrated to optimize energy use and reduce emissions.
- By component, the software segment is anticipated to hold a share of 57% in 2025 as it facilitates seamless communication between devices, sensors, and platforms.
- Based on application, the smart security segment is predicted to hold a share of 22.2% in 2025 owing to increased crime rates in urban areas.
|
Global Market Attribute |
Key Insights |
|
Smart Cities Market Size (2025E) |
US$ 620.5 Bn |
|
Market Value Forecast (2032F) |
US$ 1,256.8 Bn |
|
Projected Growth (CAGR 2025 to 2032) |
18% |
|
Historical Market Growth (CAGR 2019 to 2024) |
10.3% |
Market Dynamics
Driver - Launch of smart transportation and mobility solutions to spur demand
AI-driven traffic lights, sensors, and cameras are being integrated to monitor and manage traffic flow in real-time, decreasing congestion and optimizing traffic light patterns. These systems use data analytics to predict traffic patterns and make adjustments, improving travel time and reducing fuel consumption.
For instance, cities using AI-powered traffic systems have experienced a 15-20% reduction in traffic congestion and 10-15% improvement in travel time efficiency. Integration of self-driving cars, buses, and trucks is revolutionizing urban mobility. Autonomous vehicles(AVs) decrease the need for personal car ownership, minimize road accidents, and contribute to better traffic flow. For example, by 2025, 30 million autonomous vehicles are predicted to operate on roads, transforming the transportation landscape in cities.
Smart transportation solutions provide better mobility for all urban residents, including those in underserved areas. They help improve public transportation networks while offering seamless integration of various transport modes. For instance, in cities such as Singapore, London, and New York, smart transportation solutions have led to a 15% to 20% increase in the use of public transport due to improved efficiency and convenience.
Restraint - Digital divide and infrastructure gaps may hamper demand
In several regions, rural areas lack the infrastructure to support fast internet connections or even basic broadband access, thereby creating a digital gap between urban and rural areas. Lower income communities even in urban areas might face high costs and limited availability of internet services, making access to smart city innovations difficult.
In Africa, the Internet penetration rate was only 28.2% in 2020, compared to 87.5% in North America, highlighting the disparity in digital access between different regions.
In 2021, a report found that 70% of urban households in the U.S. had access to broadband internet, while only 48% of rural households did. This urban-rural divide in internet access further complicates efforts to implement smart city technologies across the country.
Opportunity- Rise of 5G to create opportunities for smart cities market
The introduction of 5G technology marks a significant inflection point in the global smart cities market. Offering data transmission speeds up to 100 times faster than 4G and latencies as low as 1 millisecond, 5G represents a major leap in wireless communication capability. This enhanced performance is critical for the seamless operation of interconnected urban systems, including intelligent transportation networks, smart grids, automated waste management, and AI-powered public safety systems.
According to a 2023 GSMA report, 5G connections are expected to reach 1.5 billion globally by 2025, and its integration into smart city infrastructure is projected to accelerate digital transformation efforts significantly. Real-time data processing enabled by 5G facilitates faster decision-making in areas such as traffic flow optimization, emergency services, and environmental monitoring functions where delays can lead to safety risks and inefficiencies.
5G's support for network slicing allows municipalities to deploy secure, purpose-built virtual networks tailored to specific urban applications, such as utility monitoring or law enforcement. This flexibility is crucial for ensuring both performance and cybersecurity in critical infrastructure.
Category-wise Analysis
Component Insights
Software is anticipated to hold a share of 57% in 2025. It acts as the foundation for integrating hardware and services, ensuring seamless operation of urban infrastructure. Software facilitates communication between IoT devices, sensors, and platforms, enabling real-time monitoring and management. AI and big data analytics are integral to managing complex urban systems, from traffic to energy distribution. For instance, by 2032, 60% of smart city software solutions are likely to incorporate AI for predictive analytics and automation.
Cloud computing enables cities to store and process massive volumes of data generated by IoT devices, improving scalability and efficiency. As urban systems become increasingly interconnected, software solutions for cybersecurity are essential to protect sensitive data and infrastructure.
Application Insights
Smart security is projected to account for a share of 22.2% in 2025. Rapid urbanization has increased crime rates and security threats, posing a demand for smart security solutions. For instance, urban crime rates are predicted to rise by 6% to 8% annually, driving demand for enhanced surveillance and monitoring systems.
AI-powered facial recognition and behavior analysis, combined with IoT-enabled sensors and cameras, improve the accuracy and efficiency of security systems. Smart cities are investing heavily in unique video surveillance systems to monitor public spaces and critical infrastructure. For example, AI-driven facial recognition in smart cities can reduce false alerts by 30% to 40%, enhancing public safety.
Regional Insights
Asia Pacific Smart Cities Market Trends
Asia Pacific smart cities market is projected to exhibit a positive a CAGR by 2032 globally. This growth is underpinned by accelerated urbanization, increasing environmental concerns, and strong government backing for digital transformation across urban ecosystems drive the need. With cities expanding rapidly, there's a pressing need for sustainable infrastructure, efficient resource management, and improved public services.
A growing focus on energy-efficient buildings, renewable energy integration, and eco-friendly urban planning is reshaping city development strategies. The region is witnessing a significant growth in digital health platforms, telemedicine, and AI-driven diagnostics, improving healthcare access in densely populated and underserved areas. Government-led initiatives supporting electric vehicles (EVs), autonomous transport systems, and multimodal transit networks are key to reducing congestion and emissions.
Japan's smart cities market is experiencing steady growth, driven by unique demographic and geographic challenges. The country’s aging population, coupled with its focus on resilience and automation, is shaping the future of urban innovation.
North America Smart Cities Market Trends
North America smart cities market is estimated to hold a share of 33% in 2025. Governments in the U.S. and Canada have allocated significant funds for smart city initiatives with a focus on modernizing urban infrastructure. For example, the U.S. Infrastructure Investment and Jobs Act (2021) invested US$ 100 Bn for digital infrastructure, including smart city project. Canada’s ‘Smart Cities Challenge’ has funded over US$ 300 Mn for community-driven technology adoption.
North America leads in the adoption of cutting-edge technologies such as IoT, AI, 5G, and cloud computing, which are crucial for smart city applications. By 2032, around 75% of urban areas in North America are predicted to integrate IoT-based solutions for traffic, energy, and public safety. Smart city solutions in North America prioritize energy efficiency, renewable energy adoption, and carbon footprint reduction. For instance, By 2032, 50% of urban energy grids in the U.S. are projected to be managed through smart grid technology, decreasing energy waste by 30%.
Europe Smart Cities Market Trends
The European smart cities market is projected to grow at a compound annual growth rate (CAGR) of over 27% from 2025 to 2032, positioning the region as a global leader in urban innovation. This growth is primarily driven by robust policy frameworks and strategic funding initiatives from the European Union. Initiatives such as the European Green Deal and Horizon Europe are injecting billions into sustainable urban development, climate-neutral infrastructure, and digital transformation projects.
Europe benefits from high levels of public awareness and citizen participation, which support the adoption of e-governance solutions and user-friendly digital public services. Cross-sector collaboration between public institutions, universities, research centers, and private enterprises is fostering rapid prototyping and deployment of smart city technologies. The UK smart cities market is expected to witness significant growth in the coming years, driven by a strong shift toward digitally integrated governance and citizen-centric urban services.
Competitive Landscape
Companies in the global smart cities market are forming alliances with local governments, municipalities, and public entities to secure large-scale projects and funding. These partnerships assist in navigating regulatory landscapes while ensuring the successful implementation of smart city solutions.
Businesses such as Cisco and IBM have partnered with local governments to implement smart city solutions, including smart traffic management, energy efficiency, and digital infrastructure. Collaborations with technology providers enable companies to integrate modern technologies such as AI, IoT, cloud computing, and 5G in their smart city offerings.
Continuous investments in research and development enable companies to stay ahead of the curve. These innovations are often focused on enhancing sustainability, improving urban mobility, and optimizing resource management.
Key Industry Developments:
- In January 2025, Oman Broadband Company and Singapore’s ST Engineering announced their collaboration on novel smart city initiatives in alignment with the digital transformation goals of Vision 2040.
- In January 2025, Viper Networks announced a comprehensive strategic rebranding initiative, adopting the name 0Wire. The company also launched a 0Wire Wholesale for 5G roaming and messaging services, as well as 0Wire Energy for smart city and renewable energy projects.
- In January 2025, Salt Lake City launched mySLC, a one-stop online communication and knowledge hub with digital tools for residents to submit requests and share feedback.
- In January 2025, the Ministry of Land, Infrastructure, and Transport of South Korea launched the K-City Network 2025 to promote smart city expansion.
Companies Covered in Smart Cities Market
- Cisco Systems, Inc.
- Microsoft Corporation
- IBM Corporation
- General Electric
- AT&T
- Ericsson
- Huawei Technologies Co., Ltd.
- Oracle Corporation
- Panasonic Corporation
- SAP
- Siemens AG
- Schneider Electric
- Signify
- Hitachi Vantara
Frequently Asked Questions
The market is set to reach US$ 620.5 Bn in 2025.
Urbanization and Population Growth, and the need for Sustainable Development are the major growth drivers.
The industry is estimated to rise at a CAGR of 18% through 2032.
Smart infrastructure development and smart mobility & transportation are the key market opportunities.
Cisco Systems, Inc., Microsoft Corporation, and IBM Corporation are a few leading players.


