


- Executive Summary
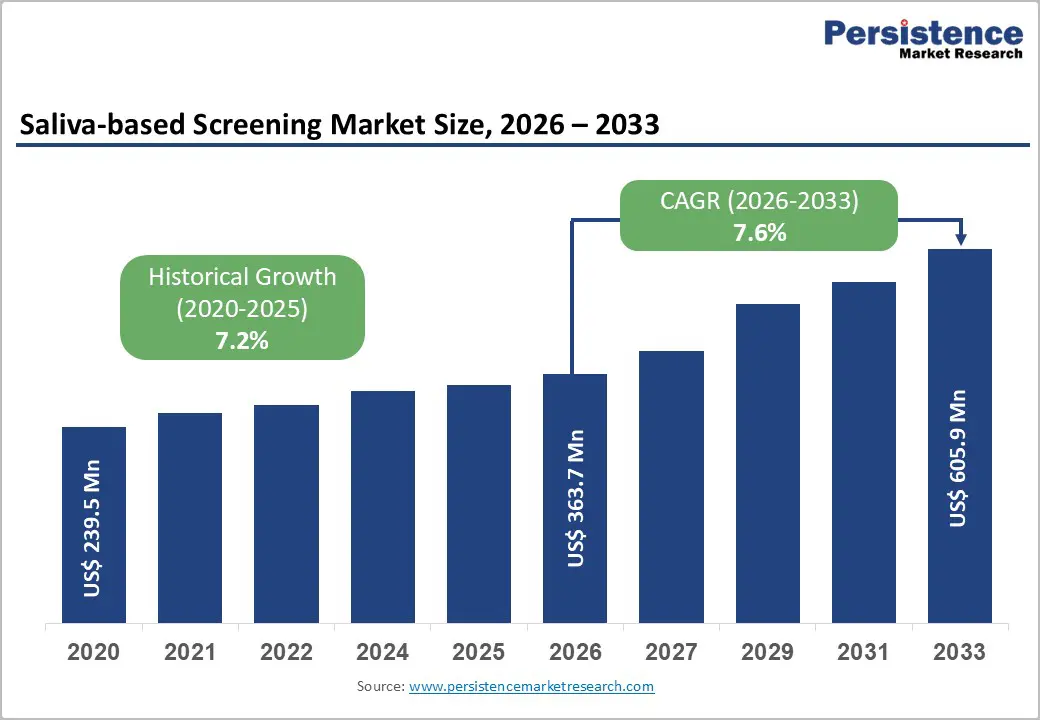
- Global Saliva-based Screening Market Snapshot 2026 and 2033
- Market Opportunity Assessment, 2026-2033, US$ Mn
- Key Market Trends
- Industry Developments and Key Market Events
- Demand Side and Supply Side Analysis
- PMR Analysis and Recommendations
- Market Overview
- Market Scope and Definitions
- Market Dynamics
- Driver
- Restraint
- Opportunities
- Trends
- Macro-Economic Factors
- Global GDP Outlook
- Global Healthcare Expenditure
- Forecast Factors – Relevance and Impact
- COVID-19 Impact Assessment
- Value Added Insights
- Value Chain analysis
- Key Market Players
- Product Adoption Analysis
- Key Promotional Strategies by key players
- PESTLE Analysis
- Porter's Five Forces Analysis
- Regulatory and Technology Landscape
- Price Trend Analysis, 2025
- Region-wise Price Analysis
- Price by Segments
- Price Impact Factors
- Global Saliva-based Screening Market Outlook: Historical (2020 – 2025) and Forecast (2026 – 2033)
- Key Highlights
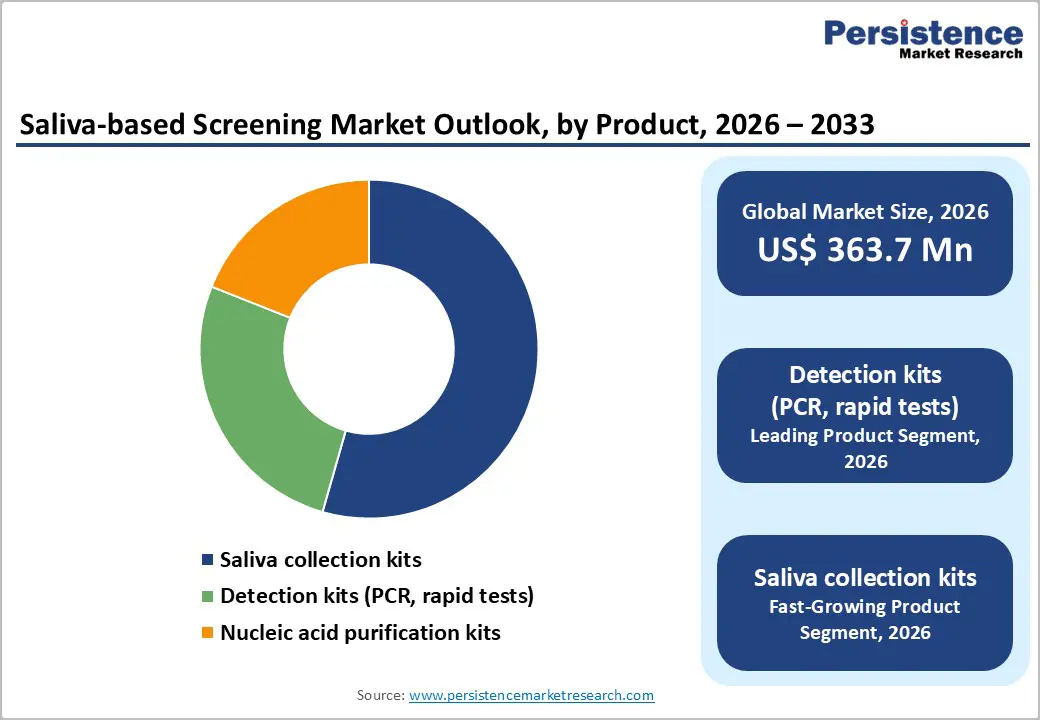
- Global Saliva-based Screening Market Outlook: Product
- Introduction/Key Findings
- Historical Market Size (US$ Mn) Analysis by Product, 2020-2025
- Current Market Size (US$ Mn) Forecast, by Product, 2026-2033
- Saliva collection kits
- Detection kits (PCR, rapid tests)
- Nucleic acid purification kits
- Market Attractiveness Analysis: Product
- Global Saliva-based Screening Market Outlook: Test
- Introduction/Key Findings
- Historical Market Size (US$ Mn) Analysis by Test, 2020-2025
- Current Market Size (US$ Mn) Forecast, by Test, 2026-2033
- PCR-based tests
- RT-qPCR
- Lateral flow assays (strip tests)
- Biosensors / NGS-based tests
- Market Attractiveness Analysis: Test
- Global Saliva-based Screening Market Outlook: Application
- Introduction/Key Findings
- Historical Market Size (US$ Mn) Analysis by Application, 2020-2025
- Current Market Size (US$ Mn) Forecast, by Application, 2026-2033
- Infectious disease detection
- Genetic / genomic testing
- Hormone testing
- Drug & alcohol testing
- Others
- Market Attractiveness Analysis: Application
- Global Saliva-based Screening Market Outlook: End User
- Introduction/Key Findings
- Historical Market Size (US$ Mn) Analysis by End User, 2020-2025
- Current Market Size (US$ Mn) Forecast, by End User, 2026-2033
- Hospitals & clinics
- Diagnostic labs
- Research & academic institutions
- Pharma / CROs
- Home users / direct-to-consumer
- Market Attractiveness Analysis: End User
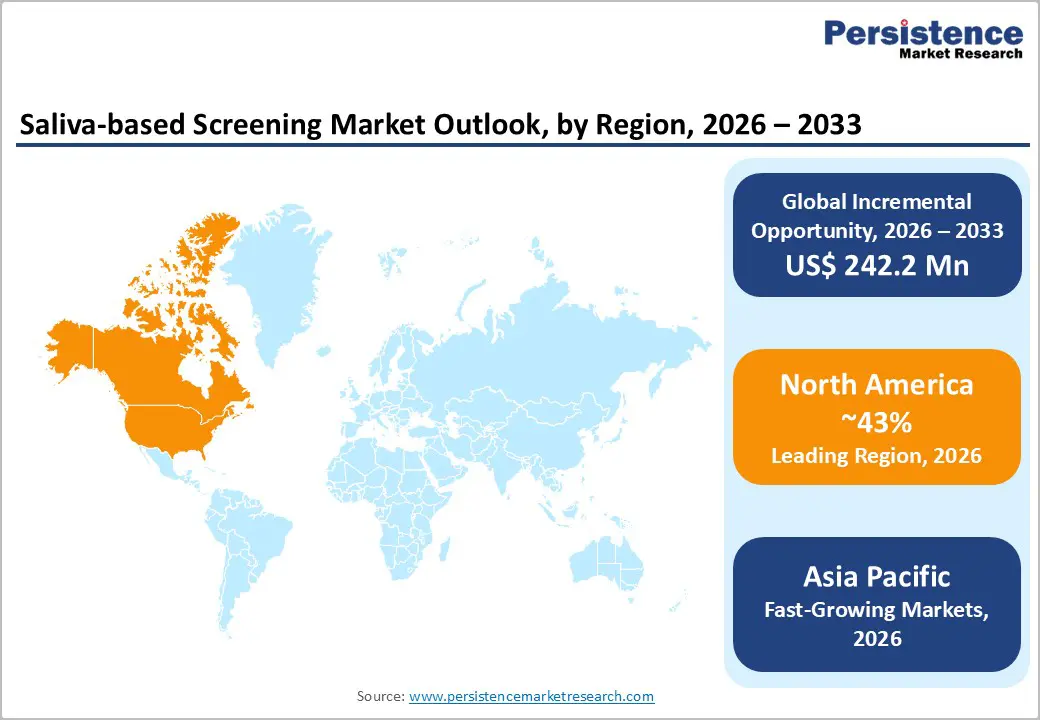
- Global Saliva-based Screening Market Outlook: Region
- Key Highlights
- Historical Market Size (US$ Mn) Analysis by Region, 2020-2025
- Current Market Size (US$ Mn) Forecast, by Region, 2026-2033
- North America
- Europe
- East Asia
- South Asia & Oceania
- Latin America
- Middle East & Africa
- Market Attractiveness Analysis: Region
- North America Saliva-based Screening Market Outlook: Historical (2020 – 2025) and Forecast (2026 – 2033)
- Key Highlights
- North America Market Size (US$ Mn) Forecast, by Country, 2026-2033
- U.S.
- Canada
- North America Market Size (US$ Mn) Forecast, by Product, 2026-2033
- Saliva collection kits
- Detection kits (PCR, rapid tests)
- Nucleic acid purification kits
- North America Market Size (US$ Mn) Forecast, by Test, 2026-2033
- PCR-based tests
- RT-qPCR
- Lateral flow assays (strip tests)
- Biosensors / NGS-based tests
- North America Market Size (US$ Mn) Forecast, by Application, 2026-2033
- Infectious disease detection
- Genetic / genomic testing
- Hormone testing
- Drug & alcohol testing
- Others
- North America Market Size (US$ Mn) Forecast, by End User, 2026-2033
- Hospitals & clinics
- Diagnostic labs
- Research & academic institutions
- Pharma / CROs
- Home users / direct-to-consumer
- Europe Saliva-based Screening Market Outlook: Historical (2020 – 2025) and Forecast (2026 – 2033)
- Key Highlights
- Europe Market Size (US$ Mn) Forecast, by Country, 2026-2033
- Germany
- Italy
- France
- U.K.
- Spain
- Russia
- Rest of Europe
- Europe Market Size (US$ Mn) Forecast, by Product, 2026-2033
- Saliva collection kits
- Detection kits (PCR, rapid tests)
- Nucleic acid purification kits
- Europe Market Size (US$ Mn) Forecast, by Test, 2026-2033
- PCR-based tests
- RT-qPCR
- Lateral flow assays (strip tests)
- Biosensors / NGS-based tests
- Europe Market Size (US$ Mn) Forecast, by Application, 2026-2033
- Infectious disease detection
- Genetic / genomic testing
- Hormone testing
- Drug & alcohol testing
- Others
- Europe Market Size (US$ Mn) Forecast, by End User, 2026-2033
- Hospitals & clinics
- Diagnostic labs
- Research & academic institutions
- Pharma / CROs
- Home users / direct-to-consumer
- East Asia Saliva-based Screening Market Outlook: Historical (2020 – 2025) and Forecast (2026 – 2033)
- Key Highlights
- East Asia Market Size (US$ Mn) Forecast, by Country, 2026-2033
- China
- Japan
- South Korea
- East Asia Market Size (US$ Mn) Forecast, by Product, 2026-2033
- Saliva collection kits
- Detection kits (PCR, rapid tests)
- Nucleic acid purification kits
- East Asia Market Size (US$ Mn) Forecast, by Test, 2026-2033
- PCR-based tests
- RT-qPCR
- Lateral flow assays (strip tests)
- Biosensors / NGS-based tests
- East Asia Market Size (US$ Mn) Forecast, by Application, 2026-2033
- Infectious disease detection
- Genetic / genomic testing
- Hormone testing
- Drug & alcohol testing
- Others
- East Asia Market Size (US$ Mn) Forecast, by End User, 2026-2033
- Hospitals & clinics
- Diagnostic labs
- Research & academic institutions
- Pharma / CROs
- Home users / direct-to-consumer
- South Asia & Oceania Saliva-based Screening Market Outlook: Historical (2020 – 2025) and Forecast (2026 – 2033)
- Key Highlights
- South Asia & Oceania Market Size (US$ Mn) Forecast, by Country, 2026-2033
- India
- Southeast Asia
- ANZ
- Rest of SAO
- South Asia & Oceania Market Size (US$ Mn) Forecast, by Product, 2026-2033
- Saliva collection kits
- Detection kits (PCR, rapid tests)
- Nucleic acid purification kits
- South Asia & Oceania Market Size (US$ Mn) Forecast, by Test, 2026-2033
- PCR-based tests
- RT-qPCR
- Lateral flow assays (strip tests)
- Biosensors / NGS-based tests
- South Asia & Oceania Market Size (US$ Mn) Forecast, by Application, 2026-2033
- Infectious disease detection
- Genetic / genomic testing
- Hormone testing
- Drug & alcohol testing
- Others
- South Asia & Oceania Market Size (US$ Mn) Forecast, by End User, 2026-2033
- Hospitals & clinics
- Diagnostic labs
- Research & academic institutions
- Pharma / CROs
- Home users / direct-to-consumer
- Latin America Saliva-based Screening Market Outlook: Historical (2020 – 2025) and Forecast (2026 – 2033)
- Key Highlights
- Latin America Market Size (US$ Mn) Forecast, by Country, 2026-2033
- Brazil
- Mexico
- Rest of LATAM
- Latin America Market Size (US$ Mn) Forecast, by Product, 2026-2033
- Saliva collection kits
- Detection kits (PCR, rapid tests)
- Nucleic acid purification kits
- Latin America Market Size (US$ Mn) Forecast, by Test, 2026-2033
- PCR-based tests
- RT-qPCR
- Lateral flow assays (strip tests)
- Biosensors / NGS-based tests
- Latin America Market Size (US$ Mn) Forecast, by Application, 2026-2033
- Infectious disease detection
- Genetic / genomic testing
- Hormone testing
- Drug & alcohol testing
- Others
- Latin America Market Size (US$ Mn) Forecast, by End User, 2026-2033
- Hospitals & clinics
- Diagnostic labs
- Research & academic institutions
- Pharma / CROs
- Home users / direct-to-consumer
- Middle East & Africa Saliva-based Screening Market Outlook: Historical (2020 – 2025) and Forecast (2026 – 2033)
- Key Highlights
- Middle East & Africa Market Size (US$ Mn) Forecast, by Country, 2026-2033
- GCC Countries
- South Africa
- Northern Africa
- Rest of MEA
- Middle East & Africa Market Size (US$ Mn) Forecast, by Product, 2026-2033
- Saliva collection kits
- Detection kits (PCR, rapid tests)
- Nucleic acid purification kits
- Middle East & Africa Market Size (US$ Mn) Forecast, by Test, 2026-2033
- PCR-based tests
- RT-qPCR
- Lateral flow assays (strip tests)
- Biosensors / NGS-based tests
- Middle East & Africa Market Size (US$ Mn) Forecast, by Application, 2026-2033
- Infectious disease detection
- Genetic / genomic testing
- Hormone testing
- Drug & alcohol testing
- Others
- Middle East & Africa Market Size (US$ Mn) Forecast, by End User, 2026-2033
- Hospitals & clinics
- Diagnostic labs
- Research & academic institutions
- Pharma / CROs
- Home users / direct-to-consumer
- Competition Landscape
- Market Share Analysis, 2025
- Market Structure
- Competition Intensity Mapping
- Competition Dashboard
- Company Profiles
- Thermo Fisher Scientific, Inc.
- Company Overview
- Product Portfolio/Offerings
- Key Financials
- SWOT Analysis
- Company Strategy and Key Developments
- Abbott Laboratories
- OraSure Technologies, Inc.
- Quest Diagnostics Incorporated
- Laboratory Corporation of America (LabCorp)
- Salimetrics, LLC
- Neogen Corporation
- Hologic, Inc.
- F. Hoffmann-La Roche Ltd
- QIAGEN N.V.
- Oasis Diagnostics Corporation
- Takara Bio, Inc.
- Thermo Fisher Scientific, Inc.
- Appendix
- Research Methodology
- Research Assumptions
- Acronyms and Abbreviations

Loading page data
Please wait a moment


