


- Executive Summary
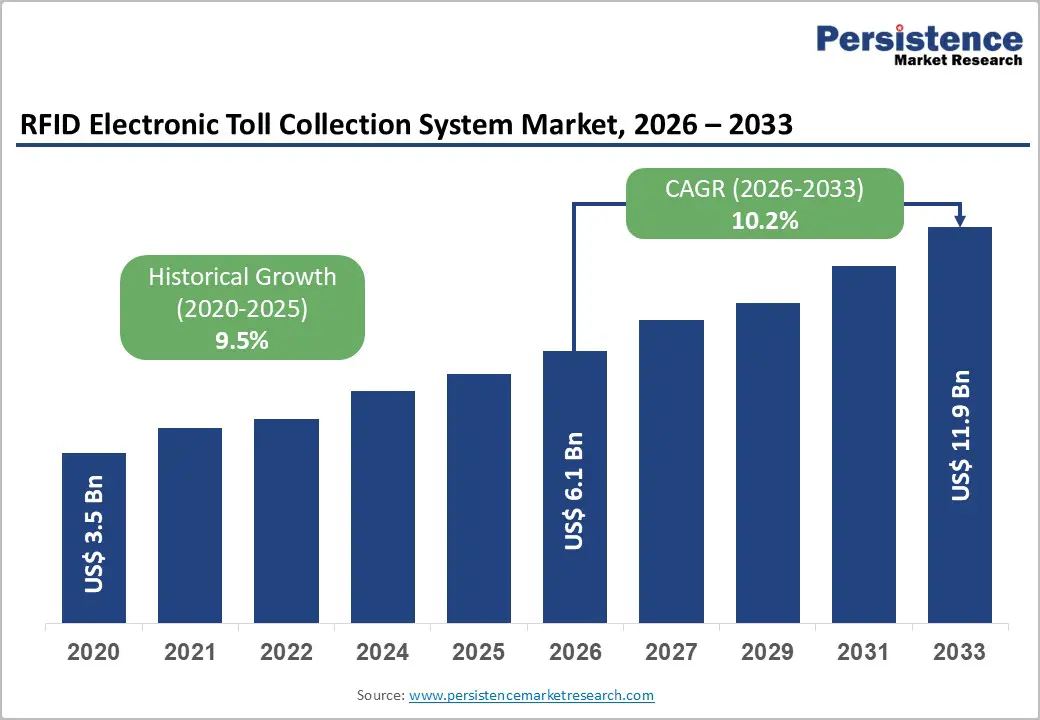
- Global RFID Electronic Toll Collection System Market Snapshot 2026 and 2033
- Market Opportunity Assessment, 2026-2033, US$ Bn
- Key Market Trends
- Industry Developments and Key Market Events
- Demand Side and Supply Side Analysis
- PMR Analysis and Recommendations
- Market Overview
- Market Scope and Definitions
- Value Chain Analysis
- Macro-Economic Factors
- Global GDP Outlook
- Global Infrastructure Development & Investment
- Government Smart City & Mobility Initiatives Outlook
- Urbanization & Traffic Management Needs
- Forecast Factors – Relevance and Impact
- COVID-19 Impact Assessment
- PESTLE Analysis
- Porter's Five Forces Analysis
- Geopolitical Tensions: Market Impact
- Regulatory and Technology Landscape
- Market Dynamics
- Drivers
- Restraints
- Opportunities
- Trends
- Price Trend Analysis, 2020 – 2033
- Region-wise Price Analysis
- Price by Segments
- Price Impact Factors
- Global RFID Electronic Toll Collection System Market Outlook: Historical (2020 – 2025) and Forecast (2026 – 2033)
- Key Highlights
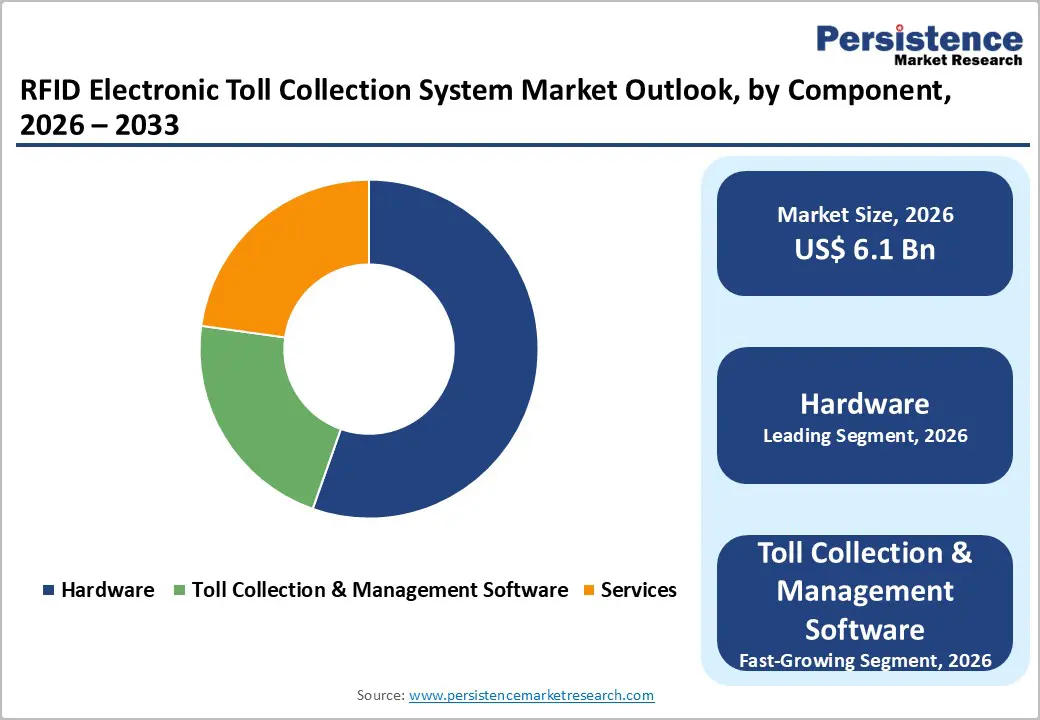
- Global RFID Electronic Toll Collection System Market Outlook: Component
- Introduction/Key Findings
- Historical Market Size (US$ Bn) Analysis by Component, 2020-2025
- Current Market Size (US$ Bn) Forecast, by Component, 2026-2033
- Hardware
- RFID UHF Antennas
- Toll RFID Readers / Scanners
- RFID Vehicle Tags
- Barcode Labels
- Toll Collection & Management Software
- Services
- Integration & Installation
- Support & Maintenance
- Hardware
- Market Attractiveness Analysis: Component
- Global RFID Electronic Toll Collection System Market Outlook: Toll Charge Type
- Introduction/Key Findings
- Historical Market Size (US$ Bn) Analysis by Toll Charge Type, 2020-2025
- Current Market Size (US$ Bn) Forecast, by Toll Charge Type, 2026-2033
- Perimeter-based Charges
- Time-based Charges
- Point-based Charges
- Distance-based Charges
- Market Attractiveness Analysis: Toll Charge Type
- Global RFID Electronic Toll Collection System Market Outlook: Application
- Introduction/Key Findings
- Historical Market Size (US$ Bn) Analysis by Application, 2020-2025
- Current Market Size (US$ Bn) Forecast, by Application, 2026-2033
- Urban Areas and Roadways
- Highways
- Market Attractiveness Analysis: Application
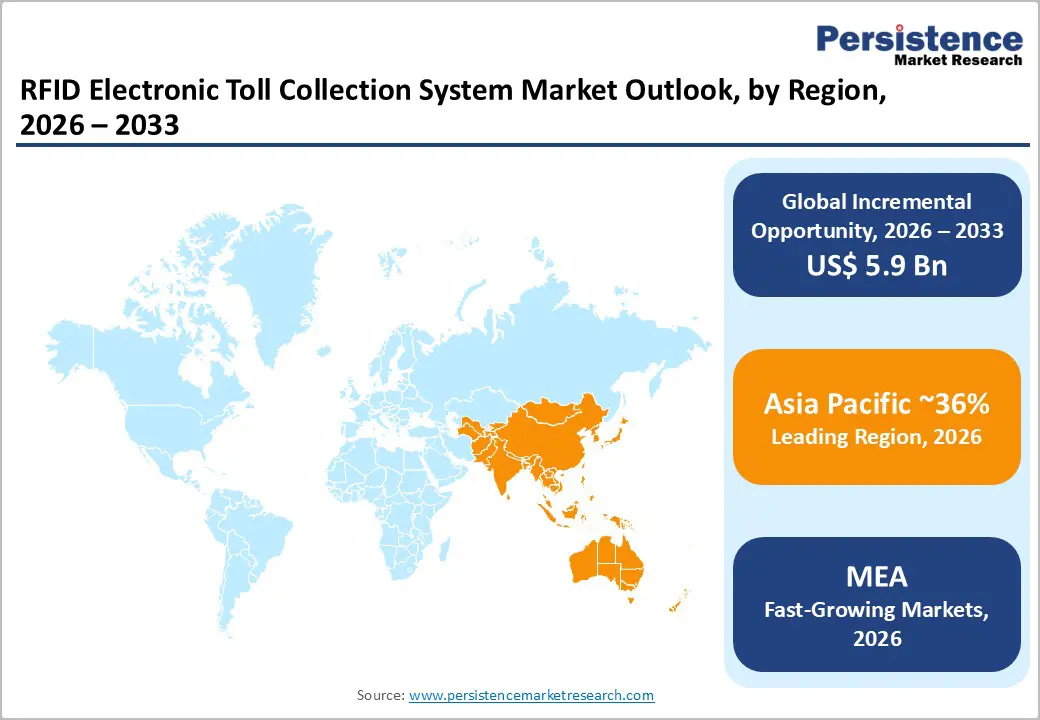
- Global RFID Electronic Toll Collection System Market Outlook: Region
- Key Highlights
- Historical Market Size (US$ Bn) Analysis by Region, 2020-2025
- Current Market Size (US$ Bn) Forecast, by Region, 2026-2033
- North America
- Europe
- East Asia
- South Asia & Oceania
- Latin America
- Middle East & Africa
- Market Attractiveness Analysis: Region
- North America RFID Electronic Toll Collection System Market Outlook: Historical (2020 – 2025) and Forecast (2026 – 2033)
- Key Highlights
- Pricing Analysis
- North America Market Size (US$ Bn) Forecast, by Country, 2026-2033
- U.S.
- Canada
- North America Market Size (US$ Bn) Forecast, by Component, 2026-2033
- Hardware
- RFID UHF Antennas
- Toll RFID Readers / Scanners
- RFID Vehicle Tags
- Barcode Labels
- Toll Collection & Management Software
- Services
- Integration & Installation
- Support & Maintenance
- Hardware
- North America Market Size (US$ Bn) Forecast, by Toll Charge Type, 2026-2033
- Perimeter-based Charges
- Time-based Charges
- Point-based Charges
- Distance-based Charges
- North America Market Size (US$ Bn) Forecast, by Application, 2026-2033
- Urban Areas and Roadways
- Highways
- Europe RFID Electronic Toll Collection System Market Outlook: Historical (2020 – 2025) and Forecast (2026 – 2033)
- Key Highlights
- Pricing Analysis
- Europe Market Size (US$ Bn) Forecast, by Country, 2026-2033
- Germany
- Italy
- France
- U.K.
- Spain
- Russia
- Rest of Europe
- Europe Market Size (US$ Bn) Forecast, by Component, 2026-2033
- Hardware
- RFID UHF Antennas
- Toll RFID Readers / Scanners
- RFID Vehicle Tags
- Barcode Labels
- Toll Collection & Management Software
- Services
- Integration & Installation
- Support & Maintenance
- Hardware
- Europe Market Size (US$ Bn) Forecast, by Toll Charge Type, 2026-2033
- Perimeter-based Charges
- Time-based Charges
- Point-based Charges
- Distance-based Charges
- Europe Market Size (US$ Bn) Forecast, by Application, 2026-2033
- Urban Areas and Roadways
- Highways
- East Asia RFID Electronic Toll Collection System Market Outlook: Historical (2020 – 2025) and Forecast (2026 – 2033)
- Key Highlights
- Pricing Analysis
- East Asia Market Size (US$ Bn) Forecast, by Country, 2026-2033
- China
- Japan
- South Korea
- East Asia Market Size (US$ Bn) Forecast, by Component, 2026-2033
- Hardware
- RFID UHF Antennas
- Toll RFID Readers / Scanners
- RFID Vehicle Tags
- Barcode Labels
- Toll Collection & Management Software
- Services
- Integration & Installation
- Support & Maintenance
- Hardware
- East Asia Market Size (US$ Bn) Forecast, by Toll Charge Type, 2026-2033
- Perimeter-based Charges
- Time-based Charges
- Point-based Charges
- Distance-based Charges
- East Asia Market Size (US$ Bn) Forecast, by Application, 2026-2033
- Urban Areas and Roadways
- Highways
- South Asia & Oceania RFID Electronic Toll Collection System Market Outlook: Historical (2020 – 2025) and Forecast (2026 – 2033)
- Key Highlights
- Pricing Analysis
- South Asia & Oceania Market Size (US$ Bn) Forecast, by Country, 2026-2033
- India
- Southeast Asia
- ANZ
- Rest of SAO
- South Asia & Oceania Market Size (US$ Bn) Forecast, by Component, 2026-2033
- Hardware
- RFID UHF Antennas
- Toll RFID Readers / Scanners
- RFID Vehicle Tags
- Barcode Labels
- Toll Collection & Management Software
- Services
- Integration & Installation
- Support & Maintenance
- Hardware
- South Asia & Oceania Market Size (US$ Bn) Forecast, by Toll Charge Type, 2026-2033
- Perimeter-based Charges
- Time-based Charges
- Point-based Charges
- Distance-based Charges
- South Asia & Oceania Market Size (US$ Bn) Forecast, by Application, 2026-2033
- Urban Areas and Roadways
- Highways
- Latin America RFID Electronic Toll Collection System Market Outlook: Historical (2020 – 2025) and Forecast (2026 – 2033)
- Key Highlights
- Pricing Analysis
- Latin America Market Size (US$ Bn) Forecast, by Country, 2026-2033
- Brazil
- Mexico
- Rest of LATAM
- Latin America Market Size (US$ Bn) Forecast, by Component, 2026-2033
- Hardware
- RFID UHF Antennas
- Toll RFID Readers / Scanners
- RFID Vehicle Tags
- Barcode Labels
- Toll Collection & Management Software
- Services
- Integration & Installation
- Support & Maintenance
- Hardware
- Latin America Market Size (US$ Bn) Forecast, by Toll Charge Type, 2026-2033
- Perimeter-based Charges
- Time-based Charges
- Point-based Charges
- Distance-based Charges
- Latin America Market Size (US$ Bn) Forecast, by Application, 2026-2033
- Urban Areas and Roadways
- Highways
- Middle East & Africa RFID Electronic Toll Collection System Market Outlook: Historical (2020 – 2025) and Forecast (2026 – 2033)
- Key Highlights
- Pricing Analysis
- Middle East & Africa Market Size (US$ Bn) Forecast, by Country, 2026-2033
- GCC Countries
- South Africa
- Northern Africa
- Rest of MEA
- Middle East & Africa Market Size (US$ Bn) Forecast, by Component, 2026-2033
- Hardware
- RFID UHF Antennas
- Toll RFID Readers / Scanners
- RFID Vehicle Tags
- Barcode Labels
- Toll Collection & Management Software
- Services
- Integration & Installation
- Support & Maintenance
- Hardware
- Middle East & Africa Market Size (US$ Bn) Forecast, by Toll Charge Type, 2026-2033
- Perimeter-based Charges
- Time-based Charges
- Point-based Charges
- Distance-based Charges
- Middle East & Africa Market Size (US$ Bn) Forecast, by Application, 2026-2033
- Urban Areas and Roadways
- Highways
- Competition Landscape
- Market Share Analysis, 2025
- Market Structure
- Competition Intensity Mapping
- Competition Dashboard
- Company Profiles
- Kapsch TrafficCom AG
- Company Overview
- Product Portfolio/Offerings
- Key Financials
- SWOT Analysis
- Company Strategy and Key Developments
- Thales Group
- TransCore (Roper Technologies)
- Conduent Transportation
- Neology, Inc.
- Q-Free ASA
- Verra Mobility Corporation
- Siemens Mobility
- Cubic Transportation Systems
- Far Eastern Electronic Toll Collection Co.
- Xerox Corporation
- EfkON AG
- Mitsubishi Heavy Industries
- Raytheon Company
- Smartrac Technology Group
- Kapsch TrafficCom AG
- Appendix
- Research Methodology
- Research Assumptions
- Acronyms and Abbreviations

Loading page data
Please wait a moment


