

- Executive Summary
- Global Ready-mix Concrete Market Snapshot, 2025 and 2032
- Market Opportunity Assessment, 2025 - 2032, US$ Bn
- Key Market Trends
- Future Market Projections
- Premium Market Insights
- Industry Developments and Key Market Events
- PMR Analysis and Recommendations
- Market Overview
- Market Scope and Definition
- Market Dynamics
- Drivers
- Restraints
- Opportunity
- Challenges
- Key Trends
- Macro-economic Factors
- Impact of Trade Policies on Product Demand
- Impact of Construction Industry Cycles
- COVID-19 Impact Analysis
- Forecast Factors - Relevance and Impact
- Value Added Insights
- Regulatory Landscape
- Product Adoption Analysis
- Value Chain Analysis
- Key Deals and Mergers
- PESTLE Analysis
- Porter’s Five Force Analysis
- Global Ready-mix Concrete Market Outlook:
- Key Highlights
- Market Size (US$ Bn) and Y-o-Y Growth
- Absolute $ Opportunity
- Market Size (US$ Bn) Analysis and Forecast
- Historical Market Size (US$ Bn) Analysis, 2019-2024
- Market Size (US$ Bn) Analysis and Forecast, 2025-2032
- Global Ready-mix Concrete Market Outlook: Product
- Introduction / Key Findings
- Historical Market Size (US$ Bn) Analysis, By Product, 2019 - 2024
- Market Size (US$ Bn) Analysis and Forecast, By Product, 2025 - 2032
- Central Mixed
- Shrink Mixed
- Transit Mixed
- Market Attractiveness Analysis: Product
- Global Ready-mix Concrete Market Outlook: Application
- Introduction / Key Findings
- Historical Market Size (US$ Bn) Analysis, By Application, 2019 - 2024
- Market Size (US$ Bn) Analysis and Forecast, By Application, 2025 - 2032
- Commercial
- Residential
- Infrastructure
- Industrial
- Market Attractiveness Analysis: Application
- Key Highlights
- Global Ready-mix Concrete Market Outlook: Region
- Key Highlights
- Historical Market Size (US$ Bn) Analysis, By Region, 2019 - 2024
- Market Size (US$ Bn) Analysis and Forecast, By Region, 2025 - 2032
- North America
- Europe
- East Asia
- South Asia and Oceania
- Latin America
- Middle East & Africa
- Market Attractiveness Analysis: Region
- North America Ready-mix Concrete Market Outlook:
- Key Highlights
- Historical Market Size (US$ Bn) Analysis, By Market, 2019 - 2024
- By Country
- By Product
- By Application
- Market Size (US$ Bn) Analysis and Forecast, By Country, 2025 - 2032
- U.S.
- Canada
- Market Size (US$ Bn) Analysis and Forecast, By Product, 2025 - 2032
- Central Mixed
- Shrink Mixed
- Transit Mixed
- Market Size (US$ Bn) Analysis and Forecast, By Application, 2025 - 2032
- Commercial
- Residential
- Infrastructure
- Industrial
- Market Attractiveness Analysis
- Europe Ready-mix Concrete Market Outlook:
- Key Highlights
- Historical Market Size (US$ Bn) Analysis, By Market, 2019 - 2024
- By Country
- By Product
- By Application
- Market Size (US$ Bn) Analysis and Forecast, By Country, 2025 - 2032
- Germany
- France
- U.K.
- Italy
- Spain
- Russia
- Türkiye
- Rest of Europe
- Market Size (US$ Bn) Analysis and Forecast, By Product, 2025 - 2032
- Central Mixed
- Shrink Mixed
- Transit Mixed
- Market Size (US$ Bn) Analysis and Forecast, By Application, 2025 - 2032
- Commercial
- Residential
- Infrastructure
- Industrial
- Market Attractiveness Analysis
- East Asia Ready-mix Concrete Market Outlook:
- Key Highlights
- Historical Market Size (US$ Bn) Analysis, By Market, 2019 - 2024
- By Country
- By Product
- By Application
- Market Size (US$ Bn) Analysis and Forecast, By Country, 2025 - 2032
- China
- Japan
- South Korea
- Market Size (US$ Bn) Analysis and Forecast, By Product, 2025 - 2032
- Central Mixed
- Shrink Mixed
- Transit Mixed
- Market Size (US$ Bn) Analysis and Forecast, By Application, 2025 - 2032
- Commercial
- Residential
- Infrastructure
- Industrial
- Market Attractiveness Analysis
- South Asia & Oceania Ready-mix Concrete Market Outlook:
- Key Highlights
- Historical Market Size (US$ Bn) Analysis, By Market, 2019 - 2024
- By Country
- By Product
- By Application
- Market Size (US$ Bn) Analysis and Forecast, By Country, 2025 - 2032
- India
- Southeast Asia
- ANZ
- Rest of South Asia & Oceania
- Market Size (US$ Bn) Analysis and Forecast, By Product, 2025 - 2032
- Central Mixed
- Shrink Mixed
- Transit Mixed
- Market Size (US$ Bn) Analysis and Forecast, By Application, 2025 - 2032
- Commercial
- Residential
- Infrastructure
- Industrial
- Market Attractiveness Analysis
- Latin America Ready-mix Concrete Market Outlook:
- Key Highlights
- Historical Market Size (US$ Bn) Analysis, By Market, 2019 - 2024
- By Country
- By Product
- By Application
- Market Size (US$ Bn) Analysis and Forecast, By Country, 2025 - 2032
- Brazil
- Mexico
- Rest of Latin America
- Market Size (US$ Bn) Analysis and Forecast, By Product, 2025 - 2032
- Central Mixed
- Shrink Mixed
- Transit Mixed
- Market Size (US$ Bn) Analysis and Forecast, By Application, 2025 - 2032
- Commercial
- Residential
- Infrastructure
- Industrial
- Market Attractiveness Analysis
- Middle East & Africa Ready-mix Concrete Market Outlook:
- Key Highlights
- Historical Market Size (US$ Bn) Analysis, By Market, 2019 - 2024
- By Country
- By Product
- By Application
- Market Size (US$ Bn) Analysis and Forecast, By Country, 2025 - 2032
- GCC Countries
- Egypt
- South Africa
- Northern Africa
- Rest of Middle East & Africa
- Market Size (US$ Bn) Analysis and Forecast, By Product, 2025 - 2032
- Central Mixed
- Shrink Mixed
- Transit Mixed
- Market Size (US$ Bn) Analysis and Forecast, By Application, 2025 - 2032
- Commercial
- Residential
- Infrastructure
- Industrial
- Market Attractiveness Analysis
- Competition Landscape
- Market Share Analysis, 2024
- Market Product
- Competition Intensity Mapping By Market
- Competition Dashboard
- Company Profiles (Details - Overview, Financials, Strategy, Recent Developments)
- ACC Limited
- Overview
- Segments and Products
- Key Financials
- Market Developments
- Market Strategy
- HOLCIM
- Vicat S.A.
- Buzzi SpA
- R.W. Sidley, Inc.
- Barney & Dickenson, Inc.
- Dillon Bros Ready Mix Concrete
- Livingston's Concrete Service, Inc.
- CEMEX, S.A.B. de C.V.
- Heidelberg Materials AG
- China National Building Material Group Corporation
- U.S. Concrete, Inc.
- UltraTech Cement Ltd.
- Industrial
- ACC Limited
- Appendix
- Research Methodology
- Research Assumptions
- onyms and Abbreviations


- Bulk Chemicals
- Ready-mix Concrete Market
Ready-mix Concrete Market Size, Share, Trends, Growth and Forecast for 2025 - 2032
Ready-mix Concrete Market by Product (Central Mixed, Shrink Mixed, Transit Mixed), by Application (Commercial, Residential, Infrastructure, Industrial), and Regional Analysis for 2025 - 2032
Ready-mix Concrete Market Size and Trends
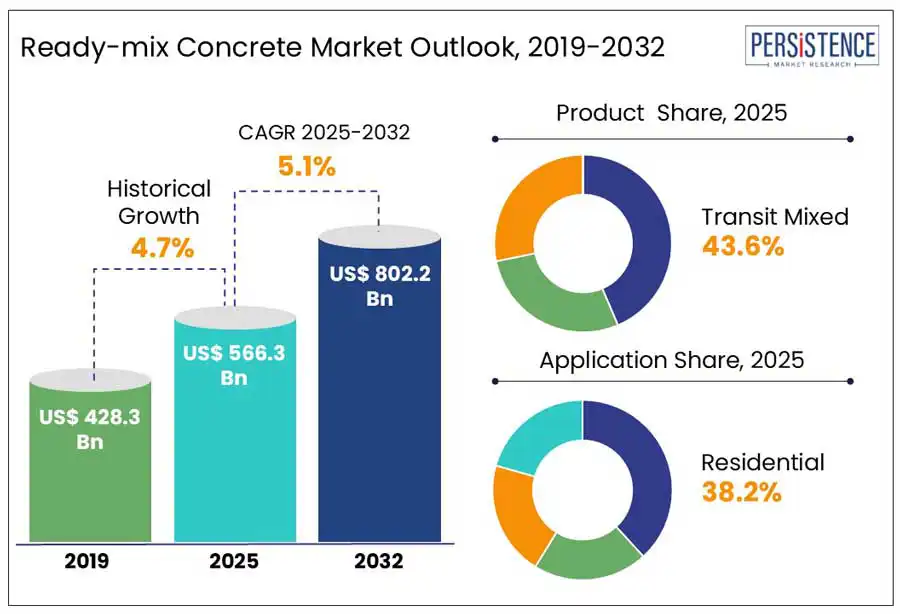
The global ready-mix concrete market size is predicted to reach US$ 802.2 Bn in 2032 from US$ 566.3 Bn in 2025. It will likely witness a CAGR of around 5.1% in the forecast period between 2025 and 2032. Increasing infrastructure modernization initiatives across various countries are estimated to propel ready-mix concrete demand through 2032, finds Persistence Market Research Report. Key countries constantly roll out ambitious construction projects to address the requirements of the ever-increasing urban population. It is evident in the rise of residential and commercial construction activities. The demand for precise material specifications and highly efficient delivery systems is increasing with a rapid shift toward more complex, large-scale construction projects.
Key Industry Highlights:
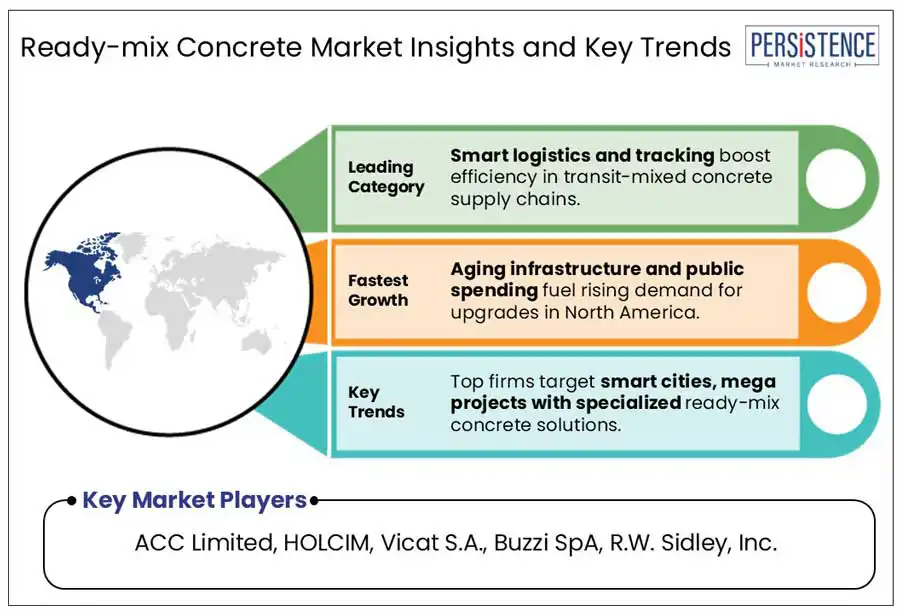
- Transit mixed is poised to generate a 43.6% share in 2025 due to its efficiency, consistency, and ability to meet project deadlines in urban and suburban developments.
- Residential applications are projected to hold 38.2% share in 2025, owing to government initiatives promoting affordable housing projects, mainly in emerging countries.
- North America is predicted to account for a 24.6% share in 2025 as the shift toward sustainable building practices in both residential and commercial sectors rises.
- The adoption of digital technologies such as smart batching systems and fleet management tools for enhanced efficiency will likely rise by 2032.
- Key companies are expected to develop low-carbon and green concrete products to comply with stringent environmental regulations.
|
Global Market Attribute |
Key Insights |
|
Ready-mix Concrete Market Size (2025E) |
US$ 566.3 Bn |
|
Market Value Forecast (2032F) |
US$ 802.2 Bn |
|
Projected Growth (CAGR 2025 to 2032) |
5.1% |
|
Historical Market Growth (CAGR 2019 to 2024) |
4.7% |
Market Dynamics
Driver - Shift toward eco-friendly construction to boost demand
Increasing emphasis on green building practices and sustainability is expected to be one of the key drivers of the ready-mix concrete market growth. Conventional on-site concrete mixing often leads to high carbon emissions, material wastage, and inconsistent quality. These issues conflict with current corporate sustainability goals and stringent environmental norms. Ready-mix concrete, which is primarily produced in controlled environments, ensures precise material proportions, reduces the carbon footprint per cubic meter, and lowers wastage by up to 10 to 12%, compared to site-mixed concrete.
Developers and contractors in various countries globally are increasingly preferring ready-mix concrete that utilize carbon capture technologies, supplementary cementitious materials, and recycled aggregates. The U.S. Green Building Council (USGBC) stated that in 2023, more than 82% of new LEED-certified projects selected ready-mix concrete products incorporating carbon-reduced or recycled materials. Companies are also joining hands with ready-mix concrete firms to inject captured carbon dioxide into concrete mixes, improving strength.
Restraint - Lack of skilled workers to impact new project development
The construction sector has faced labor shortages, which are speculated to limit the global market to a certain extent. In developed countries such as Australia, Canada, and the U.S., various construction projects are either cancelled, scaled down, or delayed due to the lack of skilled workers, which is directly affecting ready-mix concrete demand.
The 2023 U.S. Chamber of Commerce Commercial Construction Index found that nearly 92% of contractors reported moderate to severe difficulty finding skilled workers. In addition, more than 42% of contractors had to turn down new projects as they simply did not have enough labor to execute them. This issue is estimated to surge in a few regions of Europe and further declining demand.
Opportunity - Growth of sustainable concrete formulations to create avenues
The development of sustainable and low-carbon concrete solutions will likely be a leading opportunity in the global market. Ready-mix producers who develop green formulations are expected to see steady growth as global pressure surges to decarbonize the construction sector. Holcim’s ECOPact, for example, was recently launched across several markets, including India, North America, and Europe.
As per the company’s 2023 annual report, ECOPact low-carbon concrete sales increased by more than 40% year-on-year. It was primarily driven by booming demand from the private sector for green buildings and the implementation of norms such as the European Union’s Carbon Border Adjustment Mechanism (CBAM). This rapid shift toward sustainable solutions is anticipated to create lucrative opportunities for ready-mix concrete producers.
Category-wise Analysis
By Product - Transit mixed concrete dominates backed by ease of production
Based on product type, the market is trifurcated into central mixed, shrink mixed, and transit mixed. Out of these, transit mixed is poised to dominate with around 43.6% of the ready-mix concrete market share in 2025. This is attributed to its high cost-effectiveness. It can also be easily produced during transportation, without requiring additional admixtures. Construction professionals and contractors are anticipated to prefer transit mixed concrete due to its high versatility.
Shrink mixed concrete is presumed to show decent growth in the forecast period, owing to its innovative hybrid nature, which combines the benefits of both transit and central mix methods. Shrink mixed concrete provides enhanced truckload capacity and high operational efficiency. Its ability to reduce transportation costs and enhance logistics also makes it an ideal choice for contractors.
By Application - Residential leads due to increasing affordable housing projects
In terms of application, the market is divided into commercial, residential, infrastructure, and industrial. Among these, the residential segment will likely lead by holding a share of approximately 38.2% in 2025. Increasing use of ready-mix concrete in building columns, walls, floors, and foundations across residential projects globally is poised to boost demand. The segment’s growth is further spurred by several government initiatives supporting cost-effective housing development, mainly in emerging countries.
The commercial sector, is expected to witness a steady growth in the foreseeable future due to high demand for retail spaces, offices, and shopping centers in both developed and developing countries. The segment is projected to rapidly rise in key urban centers, with a surge in Grade A office space construction. As per a new report, by 2026, India’s Grade A office industry in seven major cities is expected to rise to nearly one Bn square feet. The high demand for flexible and modern office spaces is also expected to spur the segment growth.
Regional Insights
North America Ready-mix Concrete Market Trends
North America is predicted to account for a share of nearly 24.6% in 2025. The region is expected to be dominated by the U.S. ready-mix concrete market, which is currently housing various large-scale construction projects. Compared to site-mixed concrete, ready-mix concrete is considered more cost-effective and time-efficient. Hence, it is gaining momentum across these large-scale projects as they value quality control and consistency.
Infrastructure projects such as commercial buildings, bridges, and highways in major cities, including Toronto, Los Angeles, and New York are constantly demanding ready-mix concrete. This is mainly due to its ability to comply with stringent environmental standards and meet tight construction timelines. In addition, the use of digital tracking and automated batching systems in the field of ready-mix concrete will likely help reduce waste and improve operational efficiency.
Europe Ready-mix Concrete Market Trends
The European Union’s (EU) increasing focus on infrastructure investment is predicted to be a key market driver. The EU’s European Green Deal, for instance, is boosting the development of eco-conscious construction projects by focusing on carbon emissions reduction. Hence, demand for high-performance and low-carbon concrete is skyrocketing. In France and Germany, it has resulted in the incorporation of supplementary cementitious materials, including natural pozzolans, slag, and fly ash in ready-mix concrete production.
In the U.K., demand for ready-mix concrete is estimated to remain high due to several ongoing large-scale commercial and residential construction projects. A few companies in Europe, including LafargeHolcim and HeidelbergCement, on the other hand, are increasingly adopting automation and digital platforms in their ready-mix concrete operations to enhance efficiency.
Asia Pacific Ready-mix Concrete Market Trends
In Asia Pacific, emerging economies such as India and China are predicted to remain at the forefront of growth through 2032. The Government of India’s initiatives, including Housing for All and smart cities, have bolstered demand for affordable yet durable construction materials such as ready-mix concrete. Various companies are also adding mobile apps to manage concrete orders to help streamline operations and enhance delivery efficiency mainly in large-scale or remote projects.
China is considered one of the most prominent construction markets in the world. The government’s initiatives, such as the New Infrastructure Plan, which focuses on urbanization, green building practices, and technological developments are speculated to create lucrative opportunities. The government is also pushing for sustainable materials in construction, including low-carbon concrete, thereby propelling developments in the field of ready-mix concrete.
Competitive Landscape
The global ready-mix concrete market is highly competitive due to the presence of several large- and medium-sized companies. Leading companies focus on partnerships and collaborations with emerging players to co-develop new product lines and extend their presence in specific markets. A few other companies introduce environmentally-friendly production methods to comply with the stringent guidelines implemented by government agencies.
Key Industry Developments
- In April 2025, SRM Concrete acquired Gerig Concrete to create a strong presence in Florida. This acquisition would also enable SRM to blend its resources and support with the latter’s local expertise.
- In April 2025, the Ahmedabad Urban Development Authority (Auda) announced the standard operating procedure for establishing ready-mix concrete plants in areas under its governance. Operating such a plant now requires a valid license. The guidelines also mandate certain measures to control pollution from these plants.
- In November 2024, JSW One Platforms launched JSW One Concrete. This new ready-mix concrete solution was mainly designed to cater to the rising demands of the construction industry in India. By FY 2027, the product will likely be launched into the most significant hubs for ready-mix concrete in the country.
Companies Covered in Ready-mix Concrete Market
- ACC Limited
- HOLCIM
- Vicat S.A.
- Buzzi SpA
- R.W. Sidley, Inc.
- Barney & Dickenson, Inc.
- Dillon Bros Ready Mix Concrete
- Livingston's Concrete Service, Inc.
- CEMEX, S.A.B. de C.V.
- Heidelberg Materials AG
- China National Building Material Group Corporation
- U.S. Concrete, Inc.
- UltraTech Cement Ltd.
- Others
Frequently Asked Questions
The ready-mix concrete market is projected to reach US$ 566.3 Bn in 2025.
Surging construction of green buildings in developed countries and rising demand for modern office spaces are the key market drivers.
The market is poised to witness a CAGR of 5.1% from 2025 to 2032.
Rising demand for eco-friendly concrete solutions and increasing government initiatives to accelerate affordable housing projects are the key market opportunities.
ACC Limited, HOLCIM, and Vicat S.A. are a few key market players.


