


- Executive Summary
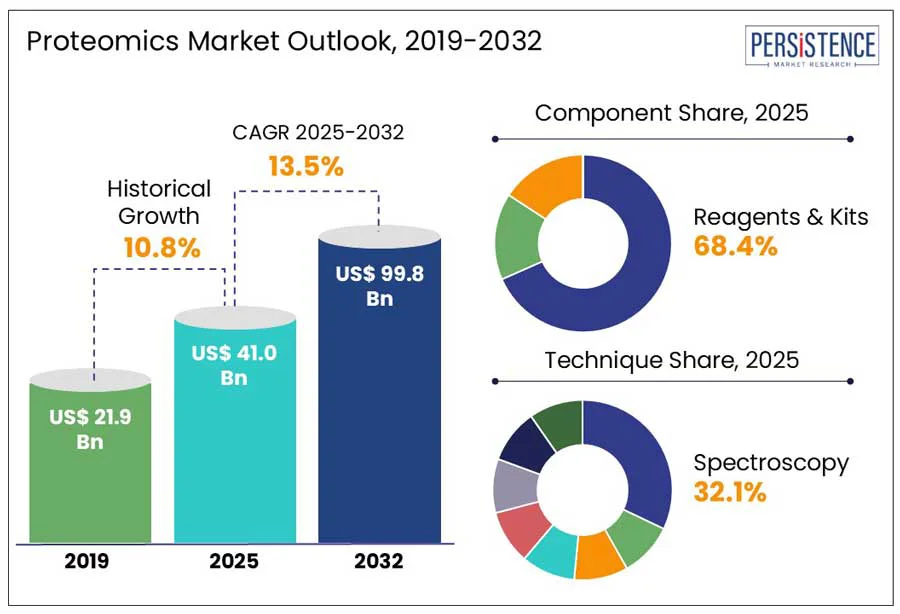
- Global Proteomics Market Snapshot, 2025 and 2032
- Market Opportunity Assessment, 2025 - 2032, US$ Mn
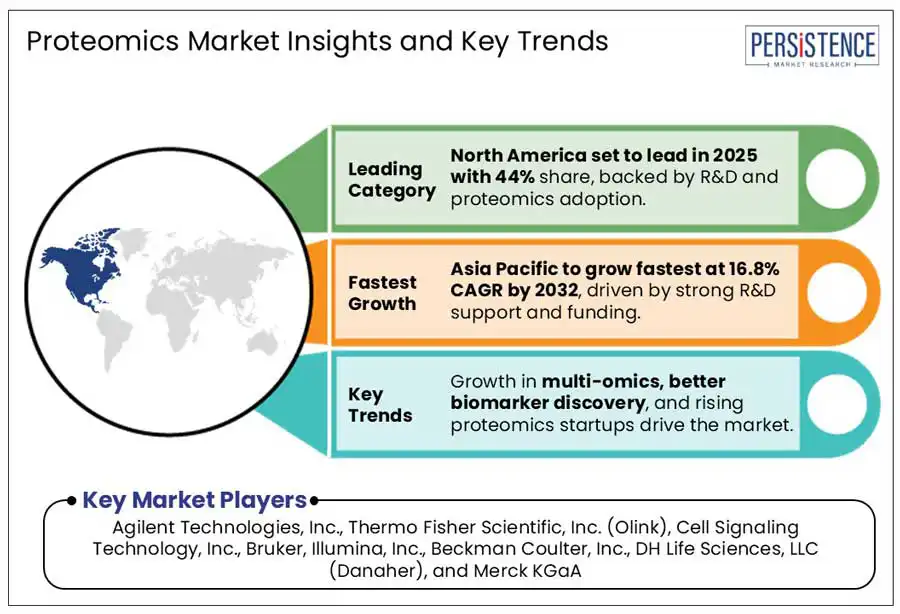
- Key Market Trends
- Future Market Projections
- Premium Market Insights
- Industry Developments and Key Market Events
- PMR Analysis and Recommendations
- Market Overview
- Market Scope and Definition
- Market Dynamics
- Drivers
- Restraints
- Opportunity
- Key Trends
- Macro-Economic Factors
- Global Sectorial Outlook
- Global GDP Growth Outlook
- COVID-19 Impact Analysis
- Forecast Factors - Relevance and Impact
- Value Added Insights
- Product Adoption Analysis
- Disease Epidemiology, Key Indications
- Regulatory Landscape
- PESTLE Analysis
- Porter’s Five Force Analysis
- Promotional Strategies, By Key Players
- Global Proteomics Market Outlook
- Key Highlights
- Market Size (US$ Mn) and Y-o-Y Growth
- Absolute $ Opportunity
- Market Size (US$ Mn) Analysis and Forecast
- Historical Market Size (US$ Mn) Analysis, 2019 - 2024
- Market Size (US$ Mn) Analysis and Forecast, 2025 - 2032
- Global Proteomics Market Outlook: Component
- Introduction / Key Findings
- Historical Market Size (US$ Mn) Analysis, By Component, 2019 - 2024
- Market Size (US$ Mn) Analysis and Forecast, By Component, 2025 - 2032
- Instruments
- Reagents & Kits
- Software and Services
- Market Attractiveness Analysis: Component
- Global Proteomics Market Outlook: Technique
- Introduction / Key Findings
- Historical Market Size (US$ Mn), By Technique, 2019 - 2024
- Market Size (US$ Mn) Analysis and Forecast, By Technique, 2025 - 2032
- Protein Microarray
- X-Ray Crystallography
- Spectroscopy
- Chromatography
- Protein Fractionation
- Electrophoresis
- Surface Plasma Resonance
- Others
- Market Attractiveness Analysis: Technique
- Global Proteomics Market Outlook: Application
- Introduction / Key Findings
- Historical Market Size (US$ Mn), By Application, 2019 - 2024
- Market Size (US$ Mn) Analysis and Forecast, By Application, 2025 - 2032
- Drug Discovery & Development
- Clinical Diagnostics
- Cancer Research
- Personalized Medicine
- Others
- Market Attractiveness Analysis: Application
- Global Proteomics Market Outlook: End User
- Introduction / Key Findings
- Historical Market Size (US$ Mn), By End User, 2019 - 2024
- Market Size (US$ Mn) Analysis and Forecast, By End User, 2025 - 2032
- Biotech & Pharma Companies
- Contract Research Organization (CROs)
- Academic & Research Institutions
- Hospitals & Clinical Laboratories
- Others
- Market Attractiveness Analysis: End User
- Key Highlights
- Global Proteomics Market Outlook: Region
- Key Highlights
- Historical Market Size (US$ Mn) Analysis, By Region, 2019 - 2024
- Market Size (US$ Mn) Analysis and Forecast, By Region, 2025 - 2032
- North America
- Europe
- East Asia
- South Asia and Oceania
- Latin America
- Middle East & Africa
- Market Attractiveness Analysis: Region
- North America Proteomics Market Outlook
- Key Highlights
- Historical Market Size (US$ Mn) Analysis, By Market, 2019 - 2024
- By Country
- By Component
- By Technique
- By Application
- By End User
- Market Size (US$ Mn) Analysis and Forecast, By Country, 2025 - 2032
- U.S.
- Canada
- Market Size (US$ Mn) Analysis and Forecast, By Component, 2025 - 2032
- Instruments
- Reagents & Kits
- Software and Services
- Market Size (US$ Mn) Analysis and Forecast, By Technique, 2025 - 2032
- Protein Microarray
- X-Ray Crystallography
- Spectroscopy
- Chromatography
- Protein Fractionation
- Electrophoresis
- Surface Plasma Resonance
- Others
- Market Size (US$ Mn) Analysis and Forecast, By Application, 2025 - 2032
- Drug Discovery & Development
- Clinical Diagnostics
- Cancer Research
- Personalized Medicine
- Others
- Market Size (US$ Mn) Analysis and Forecast, By End User, 2025 - 2032
- Biotech & Pharma Companies
- Contract Research Organization (CROs)
- Academic & Research Institutions
- Hospitals & Clinical Laboratories
- Others
- Market Attractiveness Analysis
- Europe Proteomics Market Outlook
- Key Highlights
- Historical Market Size (US$ Mn) Analysis, By Market, 2019 - 2024
- By Country
- By Component
- By Technique
- By Application
- By End User
- Market Size (US$ Mn) Analysis and Forecast, By Country, 2025 - 2032
- Germany
- France
- U.K.
- Italy
- Spain
- Russia
- Türkiye
- Rest of Europe
- Market Size (US$ Mn) Analysis and Forecast, By Component, 2025 - 2032
- Instruments
- Reagents & Kits
- Software and Services
- Market Size (US$ Mn) Analysis and Forecast, By Technique, 2025 - 2032
- Protein Microarray
- X-Ray Crystallography
- Spectroscopy
- Chromatography
- Protein Fractionation
- Electrophoresis
- Surface Plasma Resonance
- Others
- Market Size (US$ Mn) Analysis and Forecast, By Application, 2025 - 2032
- Drug Discovery & Development
- Clinical Diagnostics
- Cancer Research
- Personalized Medicine
- Others
- Market Size (US$ Mn) Analysis and Forecast, By End User, 2025 - 2032
- Biotech & Pharma Companies
- Contract Research Organization (CROs)
- Academic & Research Institutions
- Hospitals & Clinical Laboratories
- Others
- Market Attractiveness Analysis
- East Asia Proteomics Market Outlook
- Key Highlights
- Historical Market Size (US$ Mn) Analysis, By Market, 2019 - 2024
- By Country
- By Component
- By Technique
- By Application
- By End User
- Market Size (US$ Mn) Analysis and Forecast, By Country, 2025 - 2032
- China
- Japan
- South Korea
- Market Size (US$ Mn) Analysis and Forecast, By Component, 2025 - 2032
- Instruments
- Reagents & Kits
- Software and Services
- Market Size (US$ Mn) Analysis and Forecast, By Technique, 2025 - 2032
- Protein Microarray
- X-Ray Crystallography
- Spectroscopy
- Chromatography
- Protein Fractionation
- Electrophoresis
- Surface Plasma Resonance
- Others
- Market Size (US$ Mn) Analysis and Forecast, By Application, 2025 - 2032
- Drug Discovery & Development
- Clinical Diagnostics
- Cancer Research
- Personalized Medicine
- Others
- Market Size (US$ Mn) Analysis and Forecast, By End User, 2025 - 2032
- Biotech & Pharma Companies
- Contract Research Organization (CROs)
- Academic & Research Institutions
- Hospitals & Clinical Laboratories
- Others
- Market Attractiveness Analysis
- South Asia & Oceania Proteomics Market Outlook
- Key Highlights
- Historical Market Size (US$ Mn) Analysis, By Market, 2019 - 2024
- By Country
- By Component
- By Technique
- By Application
- By End User
- Market Size (US$ Mn) Analysis and Forecast, By Country, 2025 - 2032
- India
- Southeast Asia
- ANZ
- Rest of South Asia & Oceania
- Market Size (US$ Mn) Analysis and Forecast, By Component, 2025 - 2032
- Instruments
- Reagents & Kits
- Software and Services
- Market Size (US$ Mn) Analysis and Forecast, By Technique, 2025 - 2032
- Protein Microarray
- X-Ray Crystallography
- Spectroscopy
- Chromatography
- Protein Fractionation
- Electrophoresis
- Surface Plasma Resonance
- Others
- Market Size (US$ Mn) Analysis and Forecast, By Application, 2025 - 2032
- Drug Discovery & Development
- Clinical Diagnostics
- Cancer Research
- Personalized Medicine
- Others
- Market Size (US$ Mn) Analysis and Forecast, By End User, 2025 - 2032
- Biotech & Pharma Companies
- Contract Research Organization (CROs)
- Academic & Research Institutions
- Hospitals & Clinical Laboratories
- Others
- Market Attractiveness Analysis
- Latin America Proteomics Market Outlook
- Key Highlights
- Historical Market Size (US$ Mn) Analysis, By Market, 2019 - 2024
- By Country
- By Component
- By Technique
- By Application
- By End User
- Market Size (US$ Mn) Analysis and Forecast, By Country, 2025 - 2032
- Brazil
- Mexico
- Rest of Latin America
- Market Size (US$ Mn) Analysis and Forecast, By Component, 2025 - 2032
- Instruments
- Reagents & Kits
- Software and Services
- Market Size (US$ Mn) Analysis and Forecast, By Technique, 2025 - 2032
- Protein Microarray
- X-Ray Crystallography
- Spectroscopy
- Chromatography
- Protein Fractionation
- Electrophoresis
- Surface Plasma Resonance
- Others
- Market Size (US$ Mn) Analysis and Forecast, By Application, 2025 - 2032
- Drug Discovery & Development
- Clinical Diagnostics
- Cancer Research
- Personalized Medicine
- Others
- Market Size (US$ Mn) Analysis and Forecast, By End User, 2025 - 2032
- Biotech & Pharma Companies
- Contract Research Organization (CROs)
- Academic & Research Institutions
- Hospitals & Clinical Laboratories
- Others
- Market Attractiveness Analysis
- Middle East & Africa Proteomics Market Outlook
- Key Highlights
- Historical Market Size (US$ Mn) Analysis, By Market, 2019 - 2024
- By Country
- By Component
- By Technique
- By Application
- By End User
- Market Size (US$ Mn) Analysis and Forecast, By Country, 2025 - 2032
- GCC Countries
- Egypt
- South Africa
- Northern Africa
- Rest of Middle East & Africa
- Market Size (US$ Mn) Analysis and Forecast, By Component, 2025 - 2032
- Instruments
- Reagents & Kits
- Software and Services
- Market Size (US$ Mn) Analysis and Forecast, By Technique, 2025 - 2032
- Protein Microarray
- X-Ray Crystallography
- Spectroscopy
- Chromatography
- Protein Fractionation
- Electrophoresis
- Surface Plasma Resonance
- Others
- Market Size (US$ Mn) Analysis and Forecast, By Application, 2025 - 2032
- Drug Discovery & Development
- Clinical Diagnostics
- Cancer Research
- Personalized Medicine
- Others
- Market Size (US$ Mn) Analysis and Forecast, By End User, 2025 - 2032
- Biotech & Pharma Companies
- Contract Research Organization (CROs)
- Academic & Research Institutions
- Hospitals & Clinical Laboratories
- Others
- Market Attractiveness Analysis
- Competition Landscape
- Market Share Analysis, 2024
- Market Structure
- Competition Intensity Mapping By Market
- Competition Dashboard
- Company Profiles (Details - Overview, Financials, Strategy, Recent Developments)
- Agilent Technologies, Inc.
- Overview
- Segments and Products
- Key Financials
- Market Developments
- Market Strategy
- Thermo Fisher Scientific, Inc. (Olink)
- Cell Signaling Technology, Inc.
- Bruker
- Illumina, Inc.
- Beckman Coulter, Inc.
- DH Life Sciences, LLC (Danaher)
- Merck KGaA
- Bio-Rad Laboratories, Inc.
- Waters Corporation
- Promega Corporation
- Quantum-Si Incorporated
- Nomic
- Seer, Inc
- Alamar Biosciences, Inc.
- Nautilus Biotechnology Inc.
- Proteomics International
- PreOmics GmbH
- SomaLogic Operating Co., Inc.
- Proteome Factory AG
- Agilent Technologies, Inc.
- Appendix
- Research Methodology
- Research Assumptions
- Acronyms and Abbreviations

Loading page data
Please wait a moment


