

- Executive Summary
- Global Protective Cultures Market Snapshot 2026 and 2033
- Market Opportunity Assessment, 2026 - 2033, US$ Bn
- Key Market Trends
- Industry Developments and Key Market Events
- Demand Side and Supply Side Analysis
- PMR Analysis and Recommendations
- Market Overview
- Market Scope and Definitions
- Market Dynamics
- Driver
- Restraint
- Opportunities
- Trends
- Macro-Economic Factors
- Forecast Factors - Relevance and Impact
- COVID-19 Impact Assessment
- Value Added Insights
- Value Chain analysis
- Key Market Players
- Key Promotional Strategies by key players
- PESTLE Analysis
- Porter's Five Forces Analysis
- Regulatory Landscape
- Price Trend Analysis, 2025
- Region-wise Price Analysis
- Price by Segments
- Price Impact Factors
- Global Protective Cultures Market Outlook: Historical (2020 - 2025) and Forecast (2026 - 2033)
- Key Highlights
- Global Protective Cultures Market Outlook: Form
- Introduction/Key Findings
- Historical Market Size (US$ Bn) Analysis by Form, 2020-2025
- Current Market Size (US$ Bn) Forecast, by Form, 2026-2033
- Freeze Dried
- Frozen
- Market Attractiveness Analysis: Form
- Global Protective Cultures Market Outlook: Microorganism Type
- Introduction/Key Findings
- Historical Market Size (US$ Bn) Analysis by Microorganism Type, 2020-2025
- Current Market Size (US$ Bn) Forecast, by Microorganism Type, 2026-2033
- Yeast & Molds
- Bacteria
- Market Attractiveness Analysis: Microorganism Type
- Global Protective Cultures Market Outlook: End Use
- Introduction/Key Findings
- Historical Market Size (US$ Bn) Analysis by End Use, 2020-2025
- Current Market Size (US$ Bn) Forecast, by End Use, 2026-2033
- Dairy
- Meat & poultry
- Seafood
- Bakery & Confectionery
- Beverages
- Others
- Market Attractiveness Analysis: End Use
- Global Protective Cultures Market Outlook: Region
- Key Highlights
- Historical Market Size (US$ Bn) Analysis by Region, 2020-2025
- Current Market Size (US$ Bn) Forecast, by Region, 2026-2033
- North America
- Europe
- East Asia
- South Asia & Oceania
- Latin America
- Middle East & Africa
- Market Attractiveness Analysis: Region
- North America Protective Cultures Market Outlook: Historical (2020 - 2025) and Forecast (2026 - 2033)
- Key Highlights
- Pricing Analysis
- North America Market Size (US$ Bn) Forecast, by Country, 2026-2033
- U.S.
- Canada
- North America Market Size (US$ Bn) Forecast, by Form, 2026-2033
- Freeze Dried
- Frozen
- North America Market Size (US$ Bn) Forecast, by Microorganism Type, 2026-2033
- Yeast & Molds
- Bacteria
- North America Market Size (US$ Bn) Forecast, by End Use, 2026-2033
- Dairy
- Meat & poultry
- Seafood
- Bakery & Confectionery
- Beverages
- Others
- Europe Protective Cultures Market Outlook: Historical (2020 - 2025) and Forecast (2026 - 2033)
- Key Highlights
- Pricing Analysis
- Europe Market Size (US$ Bn) Forecast, by Country, 2026-2033
- Germany
- Italy
- France
- U.K.
- Spain
- Russia
- Rest of Europe
- Europe Market Size (US$ Bn) Forecast, by Form, 2026-2033
- Freeze Dried
- Frozen
- Europe Market Size (US$ Bn) Forecast, by Microorganism Type, 2026-2033
- Yeast & Molds
- Bacteria
- Europe Market Size (US$ Bn) Forecast, by End Use, 2026-2033
- Dairy
- Meat & poultry
- Seafood
- Bakery & Confectionery
- Beverages
- Others
- East Asia Protective Cultures Market Outlook: Historical (2020 - 2025) and Forecast (2026 - 2033)
- Key Highlights
- Pricing Analysis
- East Asia Market Size (US$ Bn) Forecast, by Country, 2026-2033
- China
- Japan
- South Korea
- East Asia Market Size (US$ Bn) Forecast, by Form, 2026-2033
- Freeze Dried
- Frozen
- East Asia Market Size (US$ Bn) Forecast, by Microorganism Type, 2026-2033
- Yeast & Molds
- Bacteria
- East Asia Market Size (US$ Bn) Forecast, by End Use, 2026-2033
- Dairy
- Meat & poultry
- Seafood
- Bakery & Confectionery
- Beverages
- Others
- South Asia & Oceania Protective Cultures Market Outlook: Historical (2020 - 2025) and Forecast (2026 - 2033)
- Key Highlights
- Pricing Analysis
- South Asia & Oceania Market Size (US$ Bn) Forecast, by Country, 2026-2033
- India
- Southeast Asia
- ANZ
- Rest of SAO
- South Asia & Oceania Market Size (US$ Bn) Forecast, by Form, 2026-2033
- Freeze Dried
- Frozen
- South Asia & Oceania Market Size (US$ Bn) Forecast, by Microorganism Type, 2026-2033
- Yeast & Molds
- Bacteria
- South Asia & Oceania Market Size (US$ Bn) Forecast, by End Use, 2026-2033
- Dairy
- Meat & poultry
- Seafood
- Bakery & Confectionery
- Beverages
- Others
- Latin America Protective Cultures Market Outlook: Historical (2020 - 2025) and Forecast (2026 - 2033)
- Key Highlights
- Pricing Analysis
- Latin America Market Size (US$ Bn) Forecast, by Country, 2026-2033
- Brazil
- Mexico
- Rest of LATAM
- Latin America Market Size (US$ Bn) Forecast, by Form, 2026-2033
- Freeze Dried
- Frozen
- Latin America Market Size (US$ Bn) Forecast, by Microorganism Type, 2026-2033
- Yeast & Molds
- Bacteria
- Latin America Market Size (US$ Bn) Forecast, by End Use, 2026-2033
- Dairy
- Meat & poultry
- Seafood
- Bakery & Confectionery
- Beverages
- Others
- Middle East & Africa Protective Cultures Market Outlook: Historical (2020 - 2025) and Forecast (2026 - 2033)
- Key Highlights
- Pricing Analysis
- Middle East & Africa Market Size (US$ Bn) Forecast, by Country, 2026-2033
- GCC Countries
- South Africa
- Northern Africa
- Rest of MEA
- Middle East & Africa Market Size (US$ Bn) Forecast, by Form, 2026-2033
- Freeze Dried
- Frozen
- Middle East & Africa Market Size (US$ Bn) Forecast, by Microorganism Type, 2026-2033
- Yeast & Molds
- Bacteria
- Middle East & Africa Market Size (US$ Bn) Forecast, by End Use, 2026-2033
- Dairy
- Meat & poultry
- Seafood
- Bakery & Confectionery
- Beverages
- Others
- Competition Landscape
- Market Share Analysis, 2025
- Market Structure
- Competition Intensity Mapping
- Competition Dashboard
- Company Profiles
- Novonesis
- Company Overview
- Product Portfolio/Offerings
- Key Financials
- SWOT Analysis
- Company Strategy and Key Developments
- IFF
- Lallemand Inc.
- dsm-firmenich
- Bioprox Cultures
- Angel Yeast Co., Ltd.
- Biochem S.R.L.
- Dalton Biotecnologie S.r.l.
- Others
- Novonesis
- Appendix
- Research Methodology
- Research Assumptions
- Acronyms and Abbreviations


- Food Ingredients & Additives
- Protective Cultures Market
Protective Cultures Market Size, Share, Growth, and Regional Forecast, 2026 to 2033
Protective Cultures Market by Form (Freeze Dried, Frozen), Microorganism Type (Bacteria, Yeast & Molds), End-user (Dairy, Meat & Poultry, Seafood, Bakery & Confectionery, Beverages, Others), and Regional Analysis, 2026 - 2033
Key Industry Highlights:
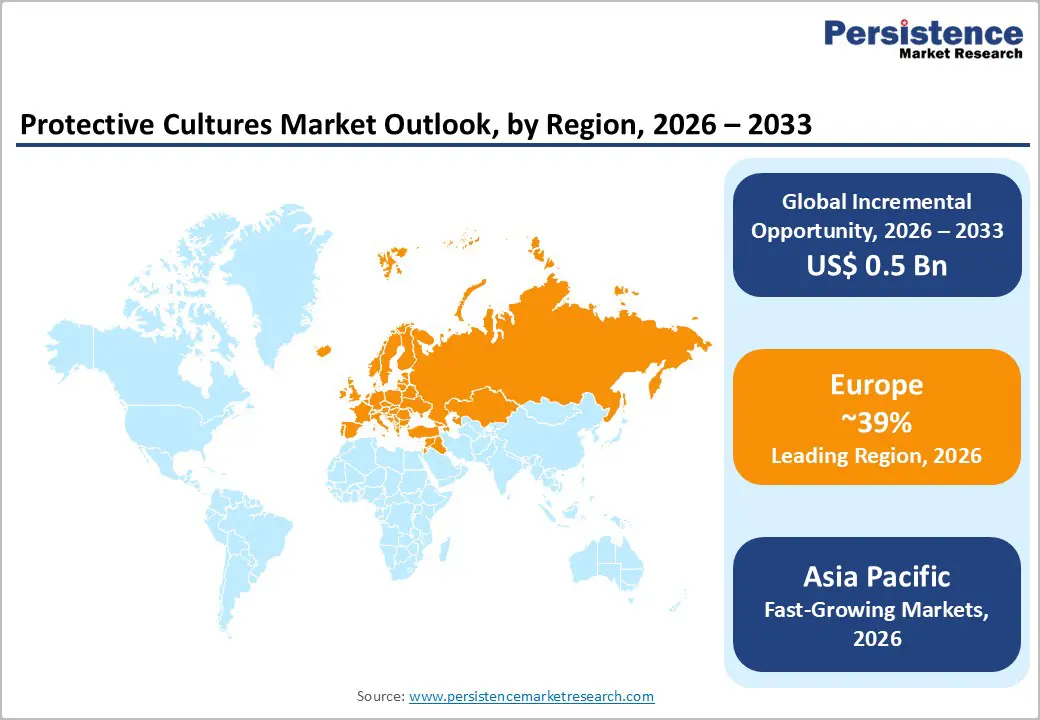
- Leading Region: Europe, accounting for ~39% market share, supported by deep-rooted fermented food traditions, stringent EFSA regulations, and strong presence of microbial science leaders such as Novonesis and DSM-Firmenich.
- Fastest-Growing Region: Asia Pacific, driven by rapid urbanization, expansion of packaged and refrigerated foods, tightening food safety regulations in China and ASEAN, and rising demand for functional dairy and export-grade meat products.
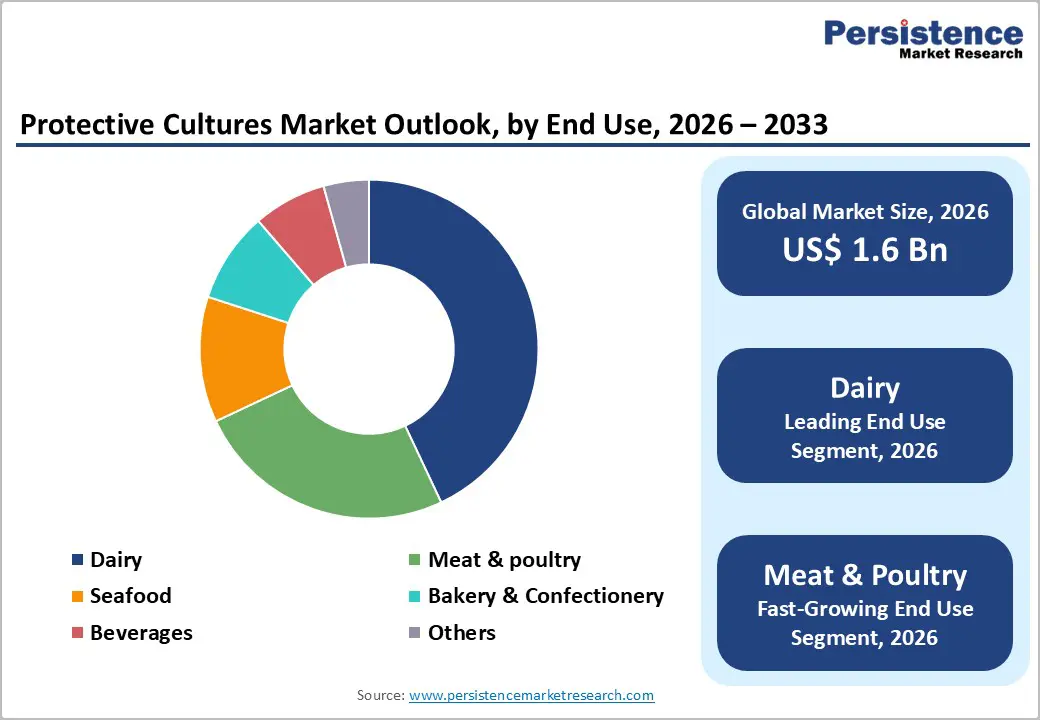
- Dominant End-users: Dairy, holding the largest share due to its intrinsic reliance on fermentation, widespread elimination of chemical antifungals, and strong clean-label yogurt and cheese penetration in Europe and North America.
- Fastest-Growing End-users: Meat & Poultry, propelled by regulatory pressure to reduce nitrites, heightened concern over Listeria control, and rising adoption of natural bio-preservation in ready-to-eat and processed meats.
- Leading Microorganism Type: Bacteria (Lactic Acid Bacteria), favored for their GRAS/QPS status, broad-spectrum antimicrobial activity, minimal sensory impact, and proven scalability across dairy, meat, and bakery applications.
| Global Market Attributes | Key Insights |
|---|---|
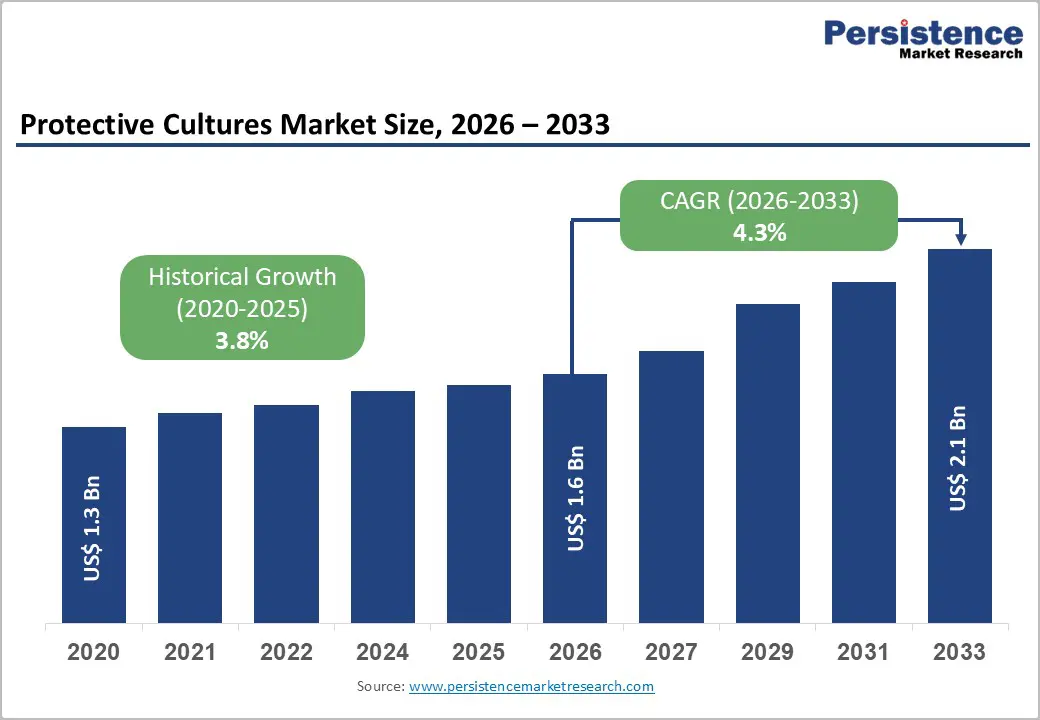
| Global Protective Cultures Market Size (2026E) | US$ 1.6 Bn |
| Market Value Forecast (2033F) | US$ 2.1 Bn |
| Projected Growth (CAGR 2026 to 2033) | 4.3% |
| Historical Market Growth (CAGR 2020 to 2025) | 3.8% |
Market Dynamics
Driver - Rising Consumer Demand for Clean-Label and Preservative-Free Food Products
The modern food landscape is witnessing a significant pivot toward clean-label products, a trend that serves as a primary engine for the Protective Cultures market. Consumers are more informed than ever, actively scrutinizing ingredient lists for synthetic chemicals such as sodium benzoate, potassium sorbate, and nitrates. According to the World Health Organization (WHO), food safety is a global priority, and the reduction of chemical additives is seen as a positive step for long-term health. Protective Cultures, which are essentially friendly bacteria or yeasts, offer a biological alternative that maintains product integrity while satisfying the transparency required by health-conscious demographics. Industry data suggests that over 65% of global consumers are willing to pay a premium for food items that are entirely free from artificial preservatives. This behavioral change compels major food processors like Nestlé and Danone to reformulate their existing lines, integrating microbial solutions that naturally inhibit the growth of unwanted microorganisms through the production of organic acids and bacteriocins.
Restraints - Stringent and Varied Regulatory Frameworks Across Different Jurisdictions
One of the most formidable barriers to the universal adoption of Protective Cultures is the lack of a harmonized global regulatory landscape. While the European Union generally views these cultures as food ingredients rather than additives under certain conditions, other regions may require extensive safety dossiers and clinical evidence to prove that the strains do not carry antibiotic resistance genes. Organizations such as the International Dairy Federation (IDF) have highlighted the complexities in labeling requirements, which vary significantly from the United States to China. In some markets, a protective strain might need to be declared as a starter culture, while in others, it must be listed by its specific species name, such as Lactobacillus rhamnosus. These regulatory hurdles increase the time-to-market and R&D costs for companies like Novonesis and IFF, potentially slowing down the pace of innovation for smaller players who lack the capital to navigate multi-regional compliance.
Opportunity - Rapid Growth in the Meat and Poultry Sector Driven by Natural Bio-Preservation
The Meat & Poultry segment represents a massive frontier for Protective Cultures, especially as consumer backlash against nitrites and nitrates in processed meats intensifies. According to research from the International Agency for Research on Cancer (IARC), processed meats have been linked to health risks, leading to a surge in demand for nitrite-free hams, sausages, and deli meats. This opens a significant window for companies to market specialized cultures that effectively target Listeria monocytogenesa deadly pathogen frequently associated with ready-to-eat meat products. By 2033, the integration of protective microbial systems in meat processing is expected to be a standard industry practice. The Fastest Growing Segment in this market is expected to be Meat & Poultry due to this regulatory and health-driven shift. Manufacturers who develop strains capable of surviving the high-salt and low-temperature environments typical of meat processing will capture a substantial share of this burgeoning market.
Category-wise Analysis
By End-user Insights
The Dairy segment stands as the undisputed leader in the global Protective Cultures market, accounting for a staggering 83% market share in 2025. This dominance is rooted in the historical and fundamental role of fermentation in dairy processing. From yogurt and kefir to aged cheeses, microbial activity is the heart of the production process. The industry has successfully transitioned from using simple starter cultures to complex, multi-functional Protective Cultures that serve the dual purpose of fermentation and bio-preservation. Statistics from the Global Dairy Platform indicate that global milk production is rising, and with it, the demand for processed dairy products that can withstand longer transportation times. In the European and North American markets, the push for clean label yogurt has almost entirely eliminated chemical antifungal agents, replacing them with cultures like Lactobacillus paracasei that naturally inhibit yeast and mold growth. The deep integration of these solutions in the dairy supply chain ensures its continued dominance through the forecast period.
By Microorganism Type Insights
The Bacteria segment is the leading microorganism type, capturing approximately 88% of the market share in 2025. The primary reason for this overwhelming preference is the versatility and efficacy of Lactic Acid Bacteria (LAB). Strains such as Lactobacillus, Lactococcus, and Pediococcus are widely recognized as Generally Recognized as Safe (GRAS) by the FDA. These bacteria work through competitive exclusion and the production of natural antimicrobial compounds such as bacteriocins (e.g., nisin) and lactic acid, which lower the pH to levels where pathogens cannot survive. Their ability to protect food without significantly altering its organoleptic properties makes them the gold standard for preservation. While Yeast & Molds are utilized in specific applications like surface-ripened cheeses and certain fermented meats, their application is more niche. However, Yeast & Molds are anticipated to be the Fastest Growing Segment in specific regions due to their increasing use in specialty fermented beverages and artisanal food products that require specific bio-protective barriers against spoilage fungi.
Regional Insights
North America Protective Cultures Market Trends and Insights
North America remains a critical hub for innovation and consumption in the protective cultures market, characterized by a sophisticated regulatory framework and a highly aware consumer base. The United States leads the region, driven by the strong presence of global food giants and a robust R&D ecosystem. The Clean Label Alliance and other industry groups have pushed for transparency, leading to a rapid phase-out of traditional chemical preservatives in premium food tiers. The region is also witnessing a significant surge in the fresh and healthy snack category, where refrigerated dips, hummus, and fresh-cut produce are increasingly using protective microbial solutions to maintain safety. The FDA's Food Safety Modernization Act (FSMA) has placed more responsibility on manufacturers to prevent contamination, making the adoption of Protective Cultures a strategic necessity for risk mitigation. Innovation in the U.S. is currently focused on developing clean-label solutions for the massive meat-snacking industry, which is seeking natural alternatives to traditional curing salts.
Europe Protective Cultures Market Trends and Insights
Europe is the largest regional market, commanding a 39% share in 2025. The region’s leadership is anchored by its long-standing tradition of fermented food consumption and some of the world's most stringent food safety regulations. Countries like Germany, France, and the Netherlands are at the forefront of microbial research, with companies like Novonesis (formerly Chr. Hansen) and DSM-Firmenich headquartered here. The European Food Safety Authority (EFSA)’s Qualified Presumption of Safety (QPS) list provides a clear, albeit rigorous, pathway for the approval of new protective strains, fostering a stable environment for investment.
Regulatory harmonization across the EU has facilitated the cross-border trade of bio-preserved products, allowing a French cheese producer to sell natural preservation products across the continent with consistent labeling. Furthermore, the European Green Deal and the Farm to Fork Strategy are encouraging food systems that reduce waste and chemical usage, directly benefiting the Protective Cultures market. The high maturity of the Dairy sector in Europe ensures that it remains the primary consumer of these cultures, with a growing interest in using them for organic and artisanal meat products.
Asia Pacific Protective Cultures Market Trends and Insights
Asia Pacific is the fastest-growing segment for the protective cultures market, with a projected CAGR that significantly outpaces Western markets. This growth is fueled by rapid urbanization, a burgeoning middle class in China and India, and a massive shift toward westernized, packaged food habits. As the retail landscape in ASEAN countries matures, there is an increasing demand for convenience foods that do not compromise on safety or health. China’s State Administration for Market Regulation (SAMR) has been tightening food safety standards, prompting domestic manufacturers to adopt international best practices in preservation.
The manufacturing advantage in the Asia Pacific is also a key factor; the region is becoming a hub for cost-effective fermentation and production. Countries like India are seeing a rise in the consumption of functional dairy products such as probiotic yogurts and lassi, where Protective Cultures are integrated to ensure stability in varying climates. The expansion of the meat processing industry in Vietnam and Thailand to meet export demands for the Japanese and Korean markets is also a significant driver, as these markets demand the highest standards of bio-preservation.
Competitive Landscape
The global protective cultures market is moderately consolidated, with a handful of Tier-1 players dominating the overall share, while several specialized biotech firms compete in niche application areas. The recent merger of Chr. Hansen and Novozymes to form Novonesis has created a powerhouse in the microbial solutions space, possessing an unparalleled library of strains and deep application expertise. Key strategies among leaders include heavy investment in Research and Development (R&D) to discover strains that are more resilient to high-heat processing and the cleaner extraction of bacteriocins. Market leaders are also focusing on customization as a key differentiator, providing food processors with bespoke microbial blends that address specific spoilage challenges unique to their regional raw materials or factory environments.
Emerging business models are increasingly revolving around solution selling, where companies provide not just the cultures but also the technical support, diagnostic tools, and regulatory assistance as a bundled package to ensure the success of the client’s product launch.
Companies Covered in Protective Cultures Market
- Novonesis
- IFF
- Lallemand Inc.
- dsm-firmenich
- Bioprox Cultures
- Angel Yeast Co., Ltd.
- Biochem S.R.L.
- Dalton Biotecnologie S.r.l.
- Others
Frequently Asked Questions
The global Protective Cultures market is expected to be valued at US$ 1.6 billion in 2026, reflecting a steady recovery and expansion following the integration of major industry mergers and the rising global demand for food safety.
The most significant driver is the global Clean-Label Trend. Consumers are increasingly avoiding synthetic preservatives like sodium benzoate, forcing food manufacturers to adopt natural, microbial-based preservation methods to maintain product safety and shelf life.
Europe is the leading region, holding a 39% market share in 2025. This leadership is due to a robust regulatory environment under EFSA and a deeply ingrained culture of consuming fermented dairy and meat products.
The Fastest Growing Opportunity lies in the Meat & Poultry sector and the Plant-Based food market. As regulations tighten around chemical additives in meats, bio-protective cultures offer a natural solution to inhibit pathogens like Listeria.
The market is led by industry giants such as Novonesis, IFF, dsm-firmenich, and Lallemand Inc., who leverage extensive patent portfolios and global distribution networks to maintain their competitive edge.


