


- Off-Road Equipment & Machinery
- Piling Machines Market
Piling Machines Market Size, Share, and Growth Forecast 2026 - 2033
Piling Machines Market by Product Type (Vibratory Driver, Impact Hammer, Hydraulic Press-in, Piling Rig, Others), End-user (Building and Construction, Oil and Gas, Others), and Regional Analysis, 2026 - 2033
Piling Machines Market Size and Trend Analysis
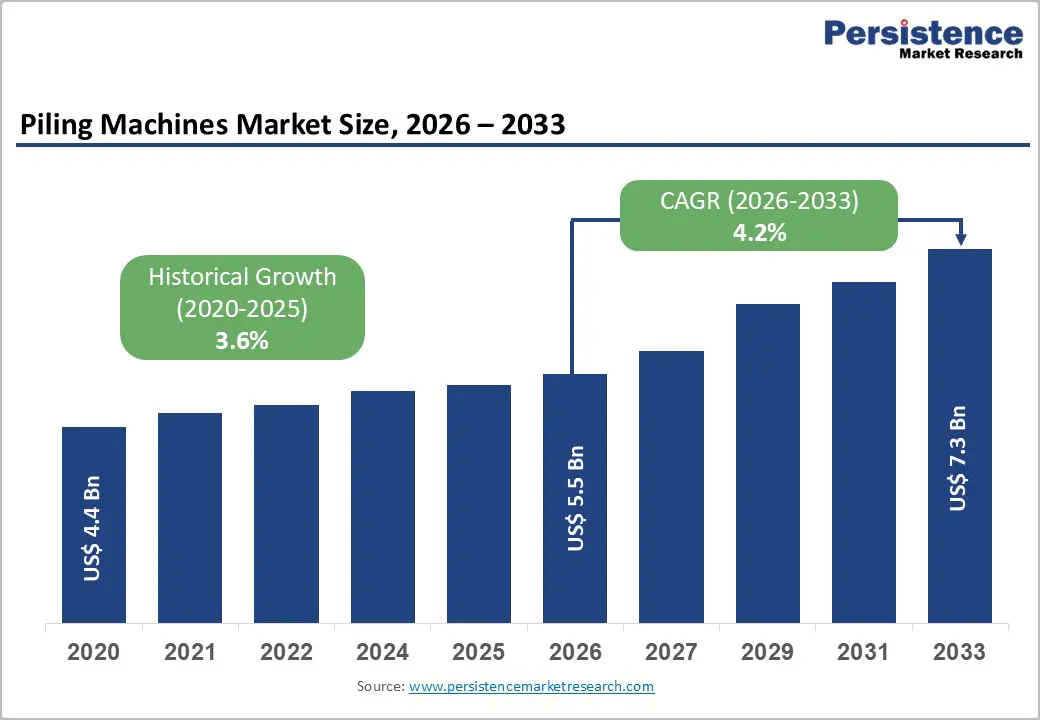
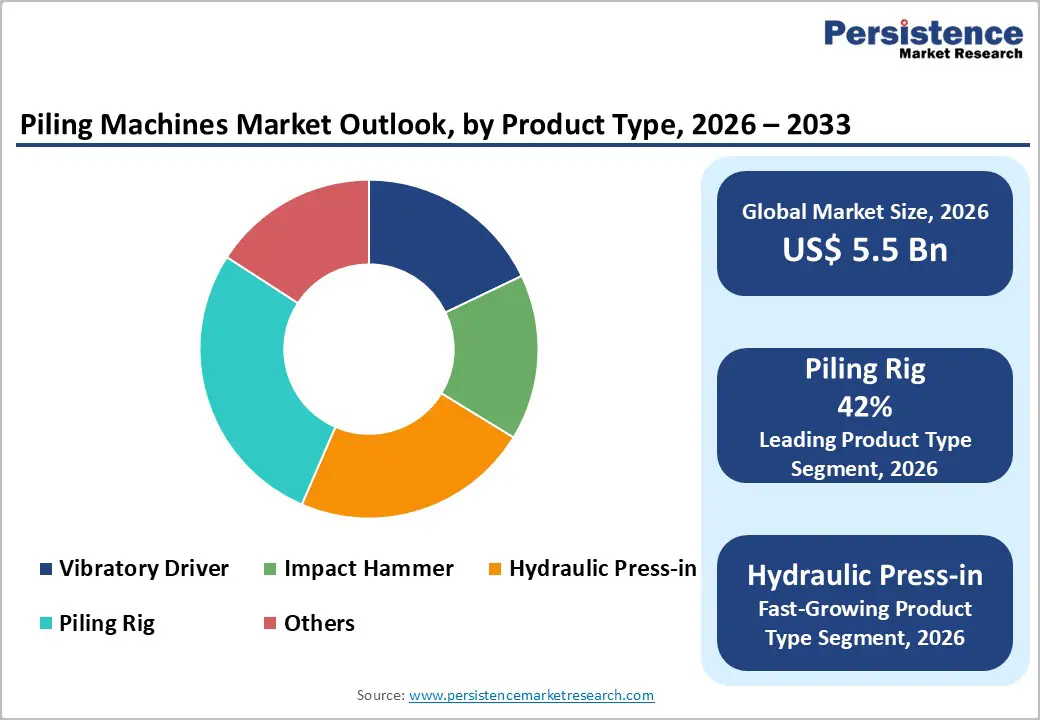
The global piling machines market size is expected to be valued at US$ 5.5 billion in 2026 and projected to reach US$ 7.3 billion by 2033, growing at a CAGR of 4.2% between 2026 and 2033.
This growth is primarily driven by rapid urbanization and large-scale infrastructure development across both emerging and developed economies. Increasing investments in transportation networks, energy facilities, and commercial construction are boosting demand for deep foundation solutions. Governments worldwide are supporting major projects such as highways, bridges, ports, and rail corridors, which require reliable piling equipment. Additionally, advancements in piling machine efficiency, automation, and sustainability are further accelerating market adoption globally.
Key Market Highlights
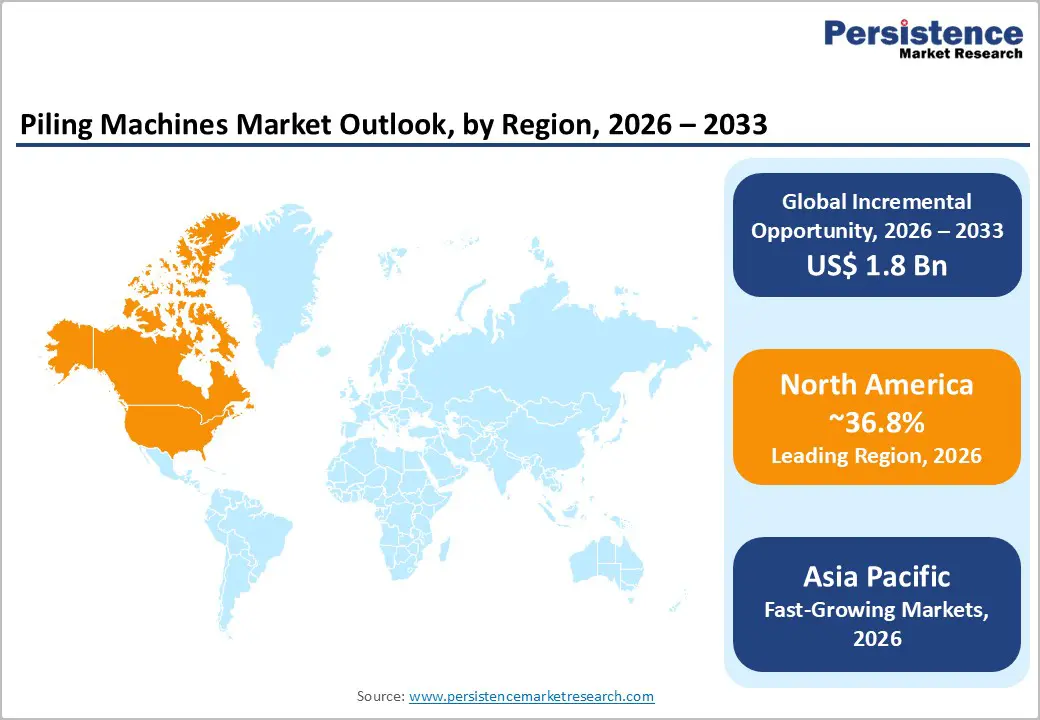
- Leading Region: North America leads the market with 36.8% share in 2025, driven by infrastructure projects and hybrid piling rigs for highways and renewable energy foundations.
- Fastest-Growing Region: Asia Pacific is the fastest-growing region with 34.5% share in 2025 and rapid urbanization, driven by infrastructure investments and smart city developments.
- Leading Product Category: Piling rigs dominate the product type segment with a 42% share in 2025, valued for versatility across rotary and CFA applications in deep foundations.
- Fastest-Growing Product Category: Hydraulic press-in machines are the fastest-growing product type, favored for low-vibration urban installations and dense city construction projects.
- Key Market Opportunity: Renewable energy foundations present significant growth potential, supporting 234 GW of offshore wind capacity globally, requiring specialized low-vibration and deep-water piling solutions.
| Key Insights | Details |
|---|---|
| Piling Machines Size (2026E) | US$ 5.5 billion |
| Market Value Forecast (2033F) | US$ 7.3 billion |
| Projected Growth CAGR(2026-2033) | 4.2% |
| Historical Market Growth (2020-2025) | 3.6% |

Market Dynamics
Drivers
Infrastructure Expansion and Urban Construction Accelerating Demand
Rapid global urbanization and rising infrastructure investments are strongly driving demand for piling machines. Developing economies across Asia, the Middle East, and Africa are expanding highways, metro systems, bridges, and smart cities, requiring deep foundation solutions. The Asian Development Bank estimates that developing Asia needs trillions in infrastructure spending by 2030, supporting continuous construction activity.
Government-backed initiatives, such as the U.S. Bipartisan Infrastructure Law allocating major funding for roads, rail, and energy networks, further boost piling requirements. This wave of large-scale projects increases the need for efficient foundation equipment to reduce construction timelines and improve structural stability.
Advanced Automation and Smart Technologies Improving Efficiency
Technological advancements are reshaping piling machine operations through automation, IoT integration, and energy-efficient power systems. Modern rigs equipped with AI-enabled drilling controls enhance precision, reduce errors, and improve productivity on complex job sites. Hybrid engines and optimized hydraulic systems also help lower fuel consumption and emissions, aligning with stricter environmental regulations.
For example, Liebherr’s positioning systems using DGNSS enable accurate pile placement, reducing time spent on manual stake-out work. These innovations allow piling machines to perform effectively in dense urban areas, offshore wind projects, and challenging soil conditions, accelerating adoption across global construction markets.
Restraints
High Capital Investment and Maintenance Costs Restricting Adoption
The high upfront cost of piling machines remains a key barrier, particularly for small and mid-sized contractors. Advanced hydraulic rigs, rotary systems, and automated equipment require significant capital investment, often exceeding several hundred thousand dollars per unit. In addition, maintenance, spare parts, and skilled operator requirements further increase ownership costs.
Rising equipment prices due to supply chain disruptions have also slowed fleet replacement in developing regions. Industry associations such as the Federation of Indian Chambers of Commerce & Industry have noted notable cost increases in recent years, making it difficult for smaller firms to upgrade machinery and limiting wider market penetration.
Strict Environmental and Noise Regulations Creating Operational Constraints
Stringent environmental regulations are increasingly challenging piling machine deployment, especially for diesel-based impact hammers. Emission standards enforced by authorities such as the European Union require manufacturers and contractors to invest in cleaner technologies or costly retrofits, raising operational expenses.
Beyond emissions, urban construction sites face strict limits on noise and vibration levels, restricting the use of traditional piling methods. Regulatory requirements in countries like the UK mandate detailed ground and vibration assessments before piling activities. These compliance burdens can delay projects, increase costs, and constrain adoption in densely populated areas.
Opportunity
Expanding Renewable Energy Projects Driving Demand for Specialized Piling Solutions
The global shift toward renewable energy, particularly offshore wind farms, is creating significant opportunities for piling machine manufacturers. As wind capacity grows, resilient and durable foundations are required to withstand harsh marine conditions. Hydraulic press-in and vibration-reducing technologies are especially suited for sensitive offshore environments, enabling construction without disturbing nearby structures or ecosystems.
Manufacturers are developing rigs tailored for these conditions, combining precision, deep-water capability, and operational efficiency. Advanced systems like Junttan’s Evolution Series are optimized for large-scale offshore projects, allowing contractors to meet tight timelines and strict safety standards while supporting the rapid expansion of renewable energy infrastructure worldwide.
Smart City Initiatives and Urban Infrastructure Projects Creating New Opportunities
Large-scale urban renewal and smart city projects in regions like ASEAN and India are driving increased demand for advanced piling solutions. Investments exceeding $100 billion are fueling metro, high-rise, and commercial developments, where deep foundations are critical for safety and longevity. Rotary bored and hybrid piling techniques perform effectively in variable soil conditions, accommodating dense urban environments.
Innovative equipment, such as Sany Group’s Hydrohammer IQ, delivers higher power bursts for challenging strata, ensuring efficient pile installation in limited spaces. These technological advancements support timely project completion, cost efficiency, and enhanced adoption of modern piling machines in rapidly developing urban centers.
Category-wise Analysis
Product Type Insights
Piling rigs lead the market with a 42% share in 2025, reflecting their versatility across rotary and continuous flight auger (CFA) applications. Essential for deep foundation work in high-rise buildings and major infrastructure, rigs such as Casagrande models can handle pile diameters ranging from 1,500 to 2,000 mm in hard soil conditions. Infrastructure booms continue to reinforce their dominance globally.
Hydraulic press-in machines are emerging as the fastest-growing product segment, particularly favored for low-vibration urban installations. Their quiet operation and precision make them suitable for dense city environments, metro projects, and sensitive sites where minimal disruption is critical. This growing adoption reflects a shift toward advanced, environmentally considerate piling technologies.
End-user Insights
The building and construction sector commands 65% of the market in 2025, driven by urbanization and large-scale civil projects such as highways, bridges, and skyscrapers. Deep foundations provided by piling machines are critical to ensure structural stability and longevity. Robust construction activity across residential, commercial, and infrastructure segments continues to anchor the demand for heavy-duty piling solutions.
The oil and gas sector is the fastest-growing end-use segment, requiring specialized piling for offshore platforms and energy infrastructure. Advanced machines capable of handling challenging marine conditions, deep seabed soils, and high-load applications are increasingly adopted. This growth reflects rising global energy demand and the push for secure, resilient offshore foundations.
Regional Insights
North America Piling Machines Market Trends
North America holds a significant 36.8% share in 2025 of the global piling machines market, driven primarily by the U.S. through the Infrastructure Investment and Jobs Act (IIJA). Major funding for bridges, highways, and renewable energy projects fuels strong demand for piling rigs. Tier 4 hybrid machines are increasingly deployed for highway piers and wind farm foundations, while states like California and Texas prioritize seismic-resilient deep foundations.
Canada contributes through Arctic infrastructure developments, emphasizing automation and precision in challenging terrains. Across the region, manufacturers focus on hybrid and low-emission rigs, addressing both efficiency and environmental standards, further consolidating North America’s leading position in the global piling machines landscape.
Europe Piling Machines Market Trends
Europe is witnessing steady growth in the piling machines market, with an estimated CAGR of 4.5% during the forecast period. Germany’s $40 billion investment in rail infrastructure between 2024 and 2027 drives the adoption of low vibration piling methods, while the EU’s harmonized emissions regulations encourage electric and hybrid hammers. The UK mandates platform certifications to ensure safety, and France and Spain are focusing on renewable energy projects.
Major infrastructure developments, such as the Femern A/S tunnel connecting Denmark and Germany, rely on advanced piling rigs capable of handling complex soils and long-term durability requirements. These initiatives collectively strengthen Europe’s position as a technologically advanced and regulatory-compliant market.
Asia Pacific Piling Machines Market Trends
Asia Pacific commands a 34.5% share in 2025, led by China and India, driven by rapid urbanization and $26 trillion infrastructure requirements by 2030. Local manufacturing advantages from companies like Sany and XCMG support widespread adoption, while smart city projects across ASEAN promote rotary bored and hybrid piling methods for high-rise buildings and metro systems.
Japan contributes through innovations in earthquake-resistant piling technology, enabling safer urban and industrial construction. Rapid infrastructure expansion, coupled with advanced machine localization and cost efficiency, positions Asia Pacific as a high-demand region, supporting both conventional and technologically sophisticated piling solutions across urban and industrial applications.
Competitive Landscape
The global piling machines market is moderately consolidated, led by a few key players investing heavily in research and development. Manufacturers focus on automation, precision control, and digital solutions to enhance machine performance and operational efficiency. Differentiation is achieved through superior torque capacity, low-emission engines, and compliance with environmental standards, allowing companies to meet evolving regulatory and urban construction requirements.
Emerging strategies include offering hybrid models and flexible deployment options, such as rental fleets, to attract small and medium-sized contractors. Innovation in machine versatility, low-vibration technologies, and smart monitoring systems further strengthens competitive positioning in this growing market.
Key Developments:
- In May 2025, Comacchio launched the CH 850 piling rig, the largest model in its CH series, designed for deep foundation projects. It offers enhanced lifting capacity, improved stability, and precision handling for high-rise and heavy infrastructure applications.
- In January 2025, Junttan introduced the Evolution Series DR5 rig, engineered for displacement piling. The rig features advanced automation, optimized energy use, and precise pile placement, enabling efficient operations in urban and challenging construction sites while reducing environmental impact.
- In September 2022, Sany Group debuted the Hydrohammer IQ, designed to optimize energy delivery for hard and variable soil conditions. The machine provides higher efficiency, enhanced durability, and reliable performance for large-scale construction and offshore piling projects.
Companies Covered in Piling Machines Market
- Bauer Group
- Liebherr‑International AG
- Soilmec S.p.A.
- Junttan Oy
- XCMG Group
- SANY Group
- BSP International Foundations Ltd.
- Dieseko Group
- International Construction Equipment (ICE)
- Watson Drill Rigs
- MAIT S.p.A.
- DELMAG GmbH & Co. KG
- Fundex Equipment
- IQIP B.V.
- Tescar S.r.l.
Frequently Asked Questions
The global Piling Machines market is expected to reach US$ 5.5 billion in 2026.
Rapid infrastructure investments, like Asia's $26 trillion needs, drive demand for stable foundations.
North America leads with 36.8% share in 2025, driven by highways, bridges, and renewable energy projects.
Renewable energy foundations, including 234 GW of offshore wind capacity, create strong demand for specialized rigs.
Leaders include Bauer Group, Liebherr‑International AG, Soilmec S.p.A., Junttan Oy, and XCMG Group, focusing on innovative rigs.


