

- Executive Summary
- Global Physical Therapy Services Market Snapshot, 2025 and 2032
- Market Opportunity Assessment, 2025 - 2032, US$ Mn
- Key Market Trends
- Future Market Projections
- Premium Market Insights
- Industry Developments and Key Market Events
- PMR Analysis and Recommendations
- Market Overview
- Market Scope and Definition
- Market Dynamics
- Drivers
- Restraints
- Opportunity
- Challenges
- Key Trends
- Macro-Economic Factors
- Global Sectorial Outlook
- Global GDP Growth Outlook
- COVID-19 Impact Analysis
- Forecast Factors - Relevance and Impact
- Value Added Insights
- Regulatory Landscape
- Service Adoption Analysis
- Value Chain Analysis
- Key Deals and Mergers
- PESTLE Analysis
- Porter’s Five Force Analysis
- Global Physical Therapy Services Market Outlook:
- Key Highlights
- Market Size (US$ Mn) and Y-o-Y Growth
- Absolute $ Opportunity
- Market Size (US$ Mn) Analysis and Forecast
- Historical Market Size (US$ Mn) Analysis, 2019-2024
- Market Size (US$ Mn) Analysis and Forecast, 2025-2032
- Global Physical Therapy Services Market Outlook: Service
- Introduction / Key Findings
- Historical Market Size (US$ Mn) Analysis, By Service, 2019 - 2024
- Market Size (US$ Mn) Analysis and Forecast, By Service, 2025 - 2032
- Orthopedic Physical Therapy
- Neurological Physical Therapy
- Cardiopulmonary Physical Therapy
- Sports Physical Therapy
- Women's Health Physiotherapy
- Market Attractiveness Analysis: Service
- Global Physical Therapy Services Market Outlook: Application
- Introduction / Key Findings
- Historical Market Size (US$ Mn) Analysis, By Application, 2019 - 2024
- Market Size (US$ Mn) Analysis and Forecast, By Application, 2025 - 2032
- Acute and Chronic Pain
- Sports Rehabilitation
- Neurological Disorder
- General Orthopedic
- Cardiovascular Disorder
- Others
- Market Attractiveness Analysis: Application
- Key Highlights
- Global Physical Therapy Services Market Outlook: Region
- Key Highlights
- Historical Market Size (US$ Mn) Analysis, By Region, 2019 - 2024
- Market Size (US$ Mn) Analysis and Forecast, By Region, 2025 - 2032
- North America
- Europe
- East Asia
- South Asia and Oceania
- Latin America
- Middle East & Africa
- Market Attractiveness Analysis: Region
- North America Physical Therapy Services Market Outlook:
- Key Highlights
- Historical Market Size (US$ Mn) Analysis, By Market, 2019 - 2024
- By Country
- By Service
- By Application
- Market Size (US$ Mn) Analysis and Forecast, By Country, 2025 - 2032
- U.S.
- Canada
- Market Size (US$ Mn) Analysis and Forecast, By Service, 2025 - 2032
- Orthopedic Physical Therapy
- Neurological Physical Therapy
- Cardiopulmonary Physical Therapy
- Sports Physical Therapy
- Women's Health Physiotherapy
- Market Size (US$ Mn) Analysis and Forecast, By Application, 2025 - 2032
- Acute and Chronic Pain
- Sports Rehabilitation
- Neurological Disorder
- General Orthopedic
- Cardiovascular Disorder
- Others
- Market Attractiveness Analysis
- Europe Physical Therapy Services Market Outlook:
- Key Highlights
- Historical Market Size (US$ Mn) Analysis, By Market, 2019 - 2024
- By Country
- By Service
- By Application
- By Distribution Channel
- Market Size (US$ Mn) Analysis and Forecast, By Country, 2025 - 2032
- Germany
- France
- U.K.
- Italy
- Spain
- Russia
- Türkiye
- Rest of Europe
- Market Size (US$ Mn) Analysis and Forecast, By Service, 2025 - 2032
- Orthopedic Physical Therapy
- Neurological Physical Therapy
- Cardiopulmonary Physical Therapy
- Sports Physical Therapy
- Women's Health Physiotherapy
- Market Size (US$ Mn) Analysis and Forecast, By Application, 2025 - 2032
- Acute and Chronic Pain
- Sports Rehabilitation
- Neurological Disorder
- General Orthopedic
- Cardiovascular Disorder
- Others
- Market Attractiveness Analysis
- East Asia Physical Therapy Services Market Outlook:
- Key Highlights
- Historical Market Size (US$ Mn) Analysis, By Market, 2019 - 2024
- By Country
- By Service
- By Application
- By Distribution Channel
- Market Size (US$ Mn) Analysis and Forecast, By Country, 2025 - 2032
- China
- Japan
- South Korea
- Market Size (US$ Mn) Analysis and Forecast, By Service, 2025 - 2032
- Orthopedic Physical Therapy
- Neurological Physical Therapy
- Cardiopulmonary Physical Therapy
- Sports Physical Therapy
- Women's Health Physiotherapy
- Market Size (US$ Mn) Analysis and Forecast, By Application, 2025 - 2032
- Acute and Chronic Pain
- Sports Rehabilitation
- Neurological Disorder
- General Orthopedic
- Cardiovascular Disorder
- Others
- Market Attractiveness Analysis
- South Asia & Oceania Physical Therapy Services Market Outlook:
- Key Highlights
- Historical Market Size (US$ Mn) Analysis, By Market, 2019 - 2024
- By Country
- By Service
- By Application
- By Distribution Channel
- Market Size (US$ Mn) Analysis and Forecast, By Country, 2025 - 2032
- India
- Southeast Asia
- ANZ
- Rest of South Asia & Oceania
- Market Size (US$ Mn) Analysis and Forecast, By Service, 2025 - 2032
- Orthopedic Physical Therapy
- Neurological Physical Therapy
- Cardiopulmonary Physical Therapy
- Sports Physical Therapy
- Women's Health Physiotherapy
- Market Size (US$ Mn) Analysis and Forecast, By Application, 2025 - 2032
- Acute and Chronic Pain
- Sports Rehabilitation
- Neurological Disorder
- General Orthopedic
- Cardiovascular Disorder
- Others
- Market Attractiveness Analysis
- Latin America Physical Therapy Services Market Outlook:
- Key Highlights
- Historical Market Size (US$ Mn) Analysis, By Market, 2019 - 2024
- By Country
- By Service
- By Application
- By Distribution Channel
- Market Size (US$ Mn) Analysis and Forecast, By Country, 2025 - 2032
- Brazil
- Mexico
- Rest of Latin America
- Market Size (US$ Mn) Analysis and Forecast, By Service, 2025 - 2032
- Orthopedic Physical Therapy
- Neurological Physical Therapy
- Cardiopulmonary Physical Therapy
- Sports Physical Therapy
- Women's Health Physiotherapy
- Market Size (US$ Mn) Analysis and Forecast, By Application, 2025 - 2032
- Acute and Chronic Pain
- Sports Rehabilitation
- Neurological Disorder
- General Orthopedic
- Cardiovascular Disorder
- Others
- Market Attractiveness Analysis
- Middle East & Africa Physical Therapy Services Market Outlook:
- Key Highlights
- Historical Market Size (US$ Mn) Analysis, By Market, 2019 - 2024
- By Country
- By Service
- By Application
- By Distribution Channel
- Market Size (US$ Mn) Analysis and Forecast, By Country, 2025 - 2032
- GCC Countries
- Egypt
- South Africa
- Northern Africa
- Rest of Middle East & Africa
- Market Size (US$ Mn) Analysis and Forecast, By Service, 2025 - 2032
- Orthopedic Physical Therapy
- Neurological Physical Therapy
- Cardiopulmonary Physical Therapy
- Sports Physical Therapy
- Women's Health Physiotherapy
- Market Size (US$ Mn) Analysis and Forecast, By Application, 2025 - 2032
- Acute and Chronic Pain
- Sports Rehabilitation
- Neurological Disorder
- General Orthopedic
- Cardiovascular Disorder
- Others
- Market Attractiveness Analysis
- Competition Landscape
- Service Providers (Details - Overview, Financials, Strategy, Recent Developments)
- Select Medical Corporation
- Overview
- Segments and Products
- Key Financials
- Market Developments
- Market Strategy
- Encompass Health Corporation
- Kindred Healthcare LLC
- Concentra Inc.
- ATI Physical Therapy
- NovaCare Rehabilitation
- Kessler Rehabilitation Center
- S. Physical Therapy Inc.
- Athletico Physical Therapy
- HealthSouth Corporation
- FYZICAL Therapy & Balance Centers
- Results Physiotherapy
- CORA Physical Therapy
- Pivot Physical Therapy
- SPEAR Physical Therapy
- Others
- Select Medical Corporation
- Service Providers (Details - Overview, Financials, Strategy, Recent Developments)
- Appendix
- Research Methodology
- Research Assumptions
- Acronyms and Abbreviations


- Healthcare Services
- Physical Therapy Services Market
Physical Therapy Services Market Size, Share, Trends, Growth, and Regional Forecasts 2025 - 2032
Physical Therapy Services Market By Service (Orthopedic Physical Therapy, Neurological Physical Therapy, Cardiopulmonary Physical Therapy, Sports Physical Therapy, Women's Health Physiotherapy, Geriatric Physical Therapy, Pediatric Physical Therapy), Application (Acute and Chronic Pain, Sports Rehabilitation, Neurological Disorder, General Orthopedic, Cardiovascular Disorder, Others), Regional Analysis for 2025 - 2032
Physical Therapy Services Market Size and Trends Analysis
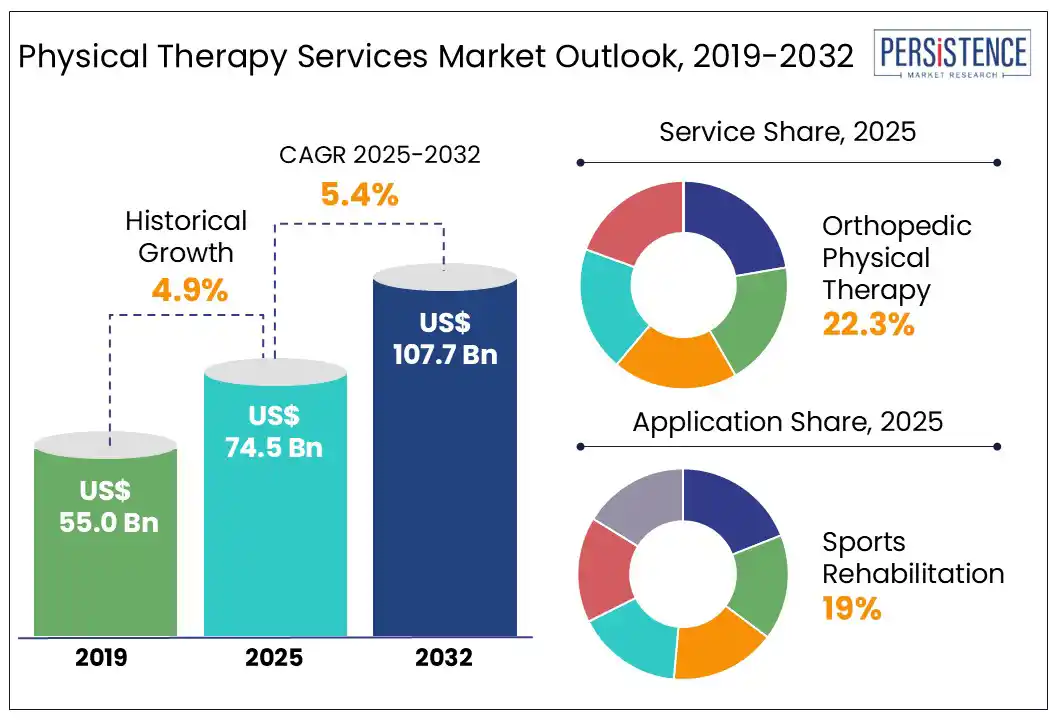
The physical therapy services market size is likely to be valued at US$ 74.5 Bn in 2025 and is estimated to reach US$ 107.7 Bn by 2032, growing at a CAGR of 5.4% during the forecast period 2025-2032. The physical therapy services market is witnessing a steady growth fueled by the rising prevalence of musculoskeletal disorders, post-surgical rehabilitation needs, and age-related mobility issues. Increasing awareness of physical therapy as a non-invasive, cost-effective treatment option is driving patient preference, particularly for chronic pain management and injury recovery.
Government support and healthcare initiatives, expanded insurance coverage, and the integration of physical therapy in primary care are some major growth factors. Providers are focusing on personalized rehabilitation programs, home-based therapy models, and digital platforms for remote consultations. Innovations in therapy techniques and increased demand from aging population continue to enhance the market developments.
Key Industry Highlights:
- Rising geriatric population increases demand for rehabilitation and mobility-focused physical therapy services globally.
- Musculoskeletal and neurological disorders are primary drivers of outpatient physical therapy service use worldwide.
- Technological integration enables remote physiotherapy sessions, enhancing accessibility and continuity of care.
- Government health initiatives and insurance coverage expansion support affordable access to physical therapy treatments.
- Growing awareness of non-invasive recovery options boosts preference for physiotherapy over surgical interventions.
| Global Market Attribute | Key Insights |
| Physical Therapy Services Market Size (2025E) | US$ 74.5 Bn |
| Market Value Forecast (2032F) | US$ 107.7 Bn |
| Projected Growth (CAGR 2025 to 2032) | 5.4% |
| Historical Market Growth (CAGR 2019 to 2024) | 4.9% |
Market Dynamics
Driver - Rising Incidence of Chronic Conditions
Rising incidence of chronic conditions, especially musculoskeletal disorders such as arthritis and chronic low back pain is a key driver of growth in the physical therapy services market. Globally, over 1.3 billion people are living with musculoskeletal conditions (e.g., low back pain, osteoarthritis), accounting for nearly 139 million years lived with disability (DALYs) in 2017. Low back pain alone affected around 619 million individuals in 2020 and is projected to rise to 843 million by 2050. In the U.S., approximately 18.9% of adults, nearly 1 in 5 have been diagnosed arthritis as of 2022, and the prevalence climbs to 53.9% among those 75 and older.
Chronic pain, affecting about 35% of Americans, often drives demand for non-medication-based interventions such as physical therapy. These rising chronic conditions create sustained demand for physical therapy services focused on pain management, mobility improvement, and avoidance of invasive procedures.
Restraint - Issue of Reimbursement Capping for Therapies
The issue of reimbursement capping for therapies acts as a significant restraint on the Physical Therapy Services Market, as fixed payment limits and annual thresholds hinder service access and financial viability. In the U.S., Medicare enforces annual outpatient therapy thresholds, sometimes called “caps” currently set at $3,000 combined for physical therapy (PT) and speech-language pathology or occupational therapy under Part B (CY 2025).
Once a patient’s therapy costs exceed that cap, providers must add a KX modifier and justify medical necessity. Exceeding $3,000 triggers a targeted medical review, increasing administrative burden. Historically, in 2012, caps were much lower, around $1,880, impacting many beneficiaries. Though the “hard cap” was softened post-2018, the thresholds remain rigid. Practices that exceed the cap without KX may see their claims outright denied, an estimated 2% Medicare reimbursement cut in 2023 further squeezes margins. Many small clinics report being forced to reduce staff or limit patient intake due to these financial pressure.
In the U.K., similar funding constraints are evident. The NHS budget for 2023/24 stood at £188.5 billion, but physiotherapy must compete with other services in fixed “payment-by-currency” structures, impacting staffing and capacity. Chronic workforce shortages over 125,500 vacancies in hospital and community services as of June 2023, exacerbate the bottleneck.
Impact:
- Access barriers: Patients often face service caps or denials when their therapy needs exceed rigid payment thresholds.
- Administrative strain: KX modifier use and reviews increase billing complexity and time costs.
- Provider limitations: Clinics may decline complex or prolonged PT cases to avoid financial risk.
- Geographic inequity: Resource-limited areas struggle more, reducing access for high-need populations.
Overall, these reimbursement caps and thresholds alongside cost-cutting policies restrict the market’s ability to expand PT services in response to growing demand, limiting treatment availability and innovation across settings.
Opportunity - Tele-rehabilitation & Remote Care
Tele-rehabilitation and remote care are emerging as transformative opportunities within the physical therapy services market, especially in the wake of post-COVID digital healthcare expansion. According to the U.S. Department of Health and Human Services (HHS), telehealth usage in the U.S. increased from less than 1% of outpatient visits in 2019 to nearly 13% by 2021, with physical therapy among the areas showing sustained adoption. The Centers for Medicare & Medicaid Services (CMS) has also extended reimbursement for remote physical therapy under the Public Health Emergency waivers, a move that made virtual rehabilitation accessible to millions of seniors and disabled individuals under Medicare.
Additionally, a study published in the Journal of Telemedicine and Telecare found that tele-rehabilitation produced similar functional outcomes to in-person therapy for patients recovering from orthopedic surgery, while offering greater convenience. For rural and underserved populations where physical therapists are scarce tele-rehab provides a lifeline for continuous care. As broadband access expands globally (India's BharatNet and U.S. FCC's Rural Digital Opportunity Fund), the scalability of remote care makes it a strategic growth path, both for public and private healthcare providers aiming to close accessibility gaps and reduce overall costs.
Category-wise Analysis
By Service Insights
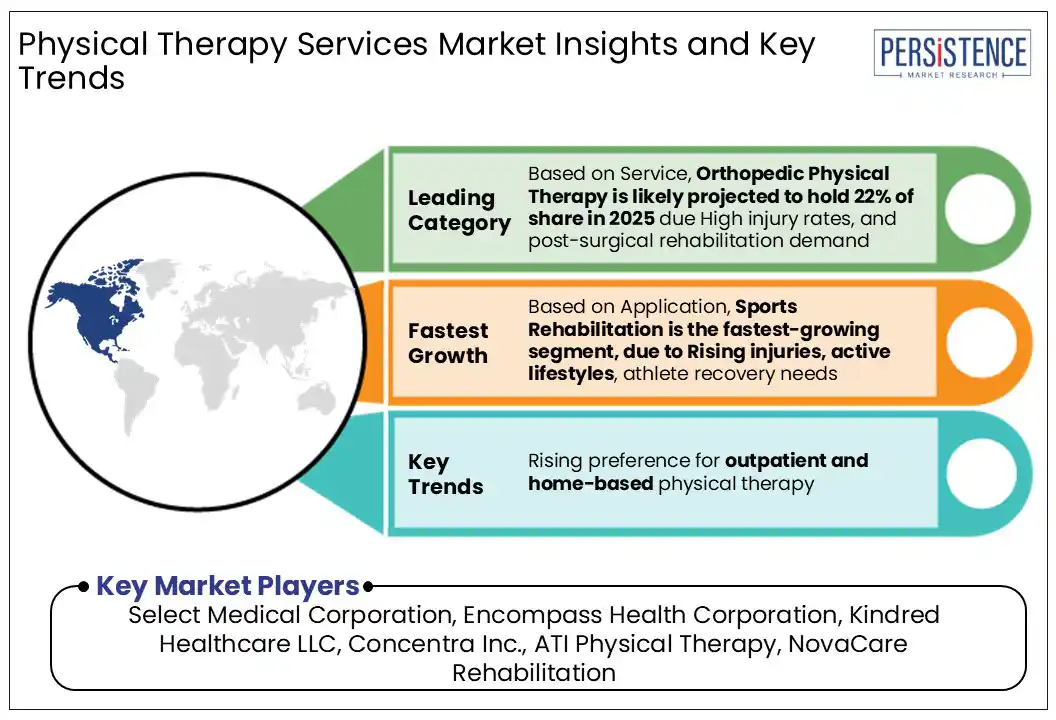
Orthopedic Physical Therapy leads due to the high global burden of musculoskeletal disorders. The WHO reports that 1.71 billion people suffer from such conditions, with low back pain being the leading cause of disability. In the U.S., the CDC notes nearly 1 in 2 adults has a musculoskeletal issue such as arthritis or joint pain. According to the American Academy of Orthopedic Surgeons, over 1 million joint replacement surgeries are performed annually in the U.S., nearly all requiring physical therapy. The aging population and over 8.6 million annual sports injuries, as reported by the National Center for Health Statistics, further drive demand. Together, these trends establish orthopedic therapy as the dominant service in rehabilitation.
Application Insights
Sports Rehabilitation is a leading application in the Physical Therapy Services market due to the high incidence of sports-related injuries and growing participation in athletic and recreational activities. According to the National Safety Council (NSC), over 3.6 million people in the U.S. were treated in emergency departments for sports and recreation-related injuries in 2022. Activities such as football, basketball, cycling, and strength training are among the top causes of such injuries.
The CDC also reports that more than 2.6 million children and adolescents are treated annually for sports-related injuries. These injuries commonly involve the musculoskeletal system, such as sprains, fractures, ligament tears, and overuse injuries, which require structured rehabilitation by physical therapists. Additionally, the rising awareness around injury prevention and performance optimization among both professional and amateur athletes is fueling demand. The increasing emphasis on post-injury return-to-sport protocols and long-term recovery plans further solidifies sports rehabilitation as a major application in the therapy space.
Regional Insights and Trends
North America Physical Therapy Services Market Trends
North America leads the Physical Therapy Services market due to its advanced healthcare infrastructure, high utilization rates, and strong insurance coverage. In the U.S., more than 250,000 licensed physical therapists operate across over 40,000 clinics, delivering an estimated 320 million PT sessions annually. The region’s large aging population over 16% of U.S. residents are aged 65 and older, drives demand for rehabilitation services related to arthritis, joint replacements, and fall injuries. Public and private insurance programs such as Medicare, Medicaid, and Canada’s OHIP cover physical therapy services extensively, enabling broader access.
In Canada alone, there were over 20,600 practicing physical therapists in 2023, with a 4.4% year-over-year increase in workforce numbers. Additionally, physical therapy accounts for around 38% of outpatient rehabilitation revenue in Canada, mainly driven by orthopedic and neurological cases. Aging demographics, insurance accessibility, and a strong provider network firmly position North America as the leading region in the physical therapy services market.
Europe Physical Therapy Services Market Trends
Europe ranks among the leading regions in the Physical Therapy Services market owing to its strong healthcare workforce, aging demographics, and supportive regulatory framework. As of 2021, the European Union employed approximately 611,000 practicing physiotherapists, averaging 136.7 per 100,000 inhabitants, with countries such as Germany (234.4) and Belgium (215.9) boasting the highest densities. The rising demand for services and an ever growing elderly population projected to be nearly 30% of Europe’s population by 2050 is facing chronic illness and mobility issues that require continued physical therapy.
Further, physiotherapists are legally recognized and regulated professionals, with EU-wide mutual recognition standards and university-level training enhancing cross-border practice and consistency. These factors provide ample supply, supportive regulatory environments, and demographic-driven demand combine to make Europe one of the top regions for physical therapy services globally.
Asia Pacific Physical Therapy Services Market Trends
Asia-Pacific is the fastest-growing region in the Physical Therapy Services market due to rapid population aging, rising chronic conditions, and expanding healthcare access. WHO projects Southeast Asia’s 60+ population will rise from 12.2% in 2024 to 22.9% by 2050, while the broader region’s elderly population will nearly triple to 1.3 billion, or 25% of the total population. This surge is increasing demand for physical therapy, especially for age-related and musculoskeletal conditions. Japan leads in rehabilitation capacity, with over 192,000 physical therapists as of 2021. Outpatient rehabilitation services in the Asia Pacific have witnessed strong growth, with physical therapies playing a major role in this expansion. The region’s rapidly aging population, increasing prevalence of chronic conditions, and improving access to healthcare services are the key drivers fueling this momentum. Together, these demographics and healthcare infrastructure developments position Asia-Pacific as the fastest-growing market for physical therapy services worldwide.
Competitive Landscape
The global physical therapy services market is highly competitive, with global and regional players focusing on innovation, brand differentiation, and strategic partnerships. Key companies compete through product variety, sustainable materials, and expanding distribution channels, especially in emerging markets across Asia-Pacific and Latin America.
Key Industry Developments:
- In October 2024, FCUK introduced a new line of condoms and personal lubricants under the Protection Plus range. The launch featured innovative products designed to enhance safety and pleasure, marking the brand’s entry into the sexual wellness segment with a bold and stylish approach.
- In September 2024, Durex, a brand by Reckitt Benckiser, launched the ‘Close Fit Invisible Condom’, marking India’s first close-fit thin condoms. The product was introduced to provide a more secure fit and heightened sensitivity, aiming to enhance intimacy and comfort for users seeking a tailored experience.
Companies Covered in Physical Therapy Services Market
- Select Medical Corporation
- Encompass Health Corporation
- Kindred Healthcare LLC
- Concentra Inc.
- ATI Physical Therapy
- NovaCare Rehabilitation
- Kessler Rehabilitation Center
- S. Physical Therapy Inc.
- Athletico Physical Therapy
- HealthSouth Corporation
- FYZICAL Therapy & Balance Centers
- Results Physiotherapy
- CORA Physical Therapy
- Pivot Physical Therapy
- SPEAR Physical Therapy
- Others
Frequently Asked Questions
The global physical therapy services market is estimated to increase from US$ 74.5 Bn in 2025 to US$ 107.7 Bn in 2032.
The physical therapy services market is driven by an aging population, increasing chronic conditions, post-surgical rehab needs, sports injuries, and expanded healthcare access drive physical therapy services growth.
The market is projected to record a CAGR of 5.4% during the forecast period from 2025 to 2032.
Opportunities include tele-rehabilitation, aging population care, chronic disease management, sports injury rehab, and expansion in underserved rural areas.
The physical therapy services market players include Select Medical Corporation, Encompass Health Corporation, Kindred Healthcare LLC, Concentra Inc., ATI Physical Therapy, NovaCare Rehabilitation and Others.


