


- Executive Summary
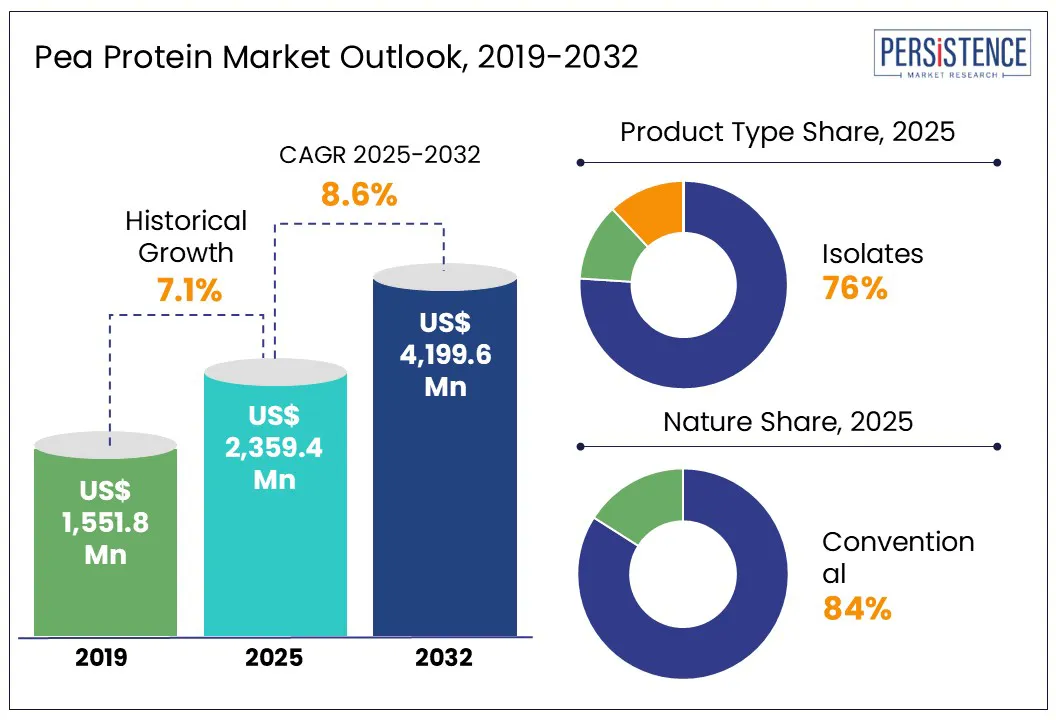
- Global Pea Protein Market Snapshot, 2025 and 2032
- Market Opportunity Assessment, 2025 - 2032, US$ Mn
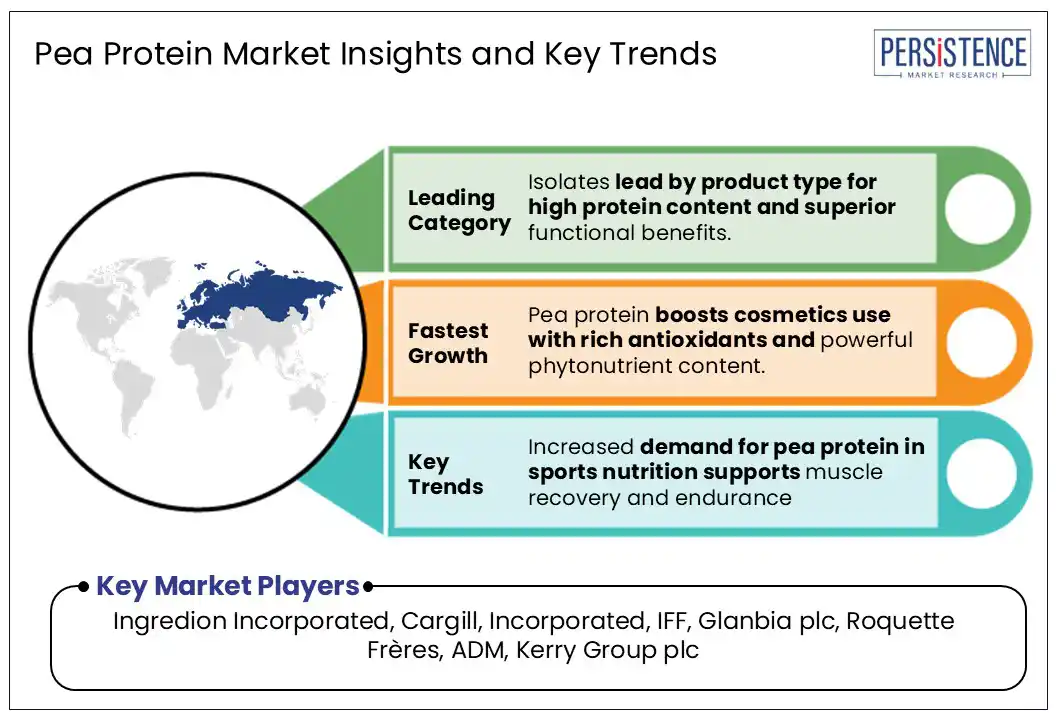
- Key Market Trends
- Future Market Projections
- Premium Market Insights
- Industry Developments and Key Market Events
- PMR Analysis and Recommendations
- Market Overview
- Market Scope and Definition
- Market Dynamics
- Drivers
- Restraints
- Opportunity
- Challenges
- Key Trends
- COVID-19 Impact Analysis
- Forecast Factors - Relevance and Impact
- Value Added Insights
- Value Chain Analysis
- Key Market Players
- Regulatory Landscape
- PESTLE Analysis
- Porter’s Five Force Analysis
- Price Trend Analysis, 2019 - 2032
- Pricing Analysis, By Product Type
- Key Factors Impacting Product Prices
- Global Pea Protein Market Outlook
- Key Highlights
- Market Volume (Tons) Projections
- Market Size (US$ Mn) and Y-o-Y Growth
- Absolute $ Opportunity
- Market Size (US$ Mn) Analysis and Forecast
- Historical Market Size (US$ Mn) Analysis, 2019-2024
- Market Size (US$ Mn) Analysis and Forecast, 2025-2032
- Global Pea Protein Market Outlook: Product Type
- Historical Market Size (US$ Mn) and Volume (Tons) Analysis, By Product Type, 2019-2024
- Market Size (US$ Mn) and Volume (Tons) Analysis and Forecast, By Product Type, 2025-2032
- Isolates
- Concentrates
- Hydrolysate
- Market Attractiveness Analysis: Product Type
- Global Pea Protein Market Outlook: Nature
- Historical Market Size (US$ Mn) and Volume (Tons) Analysis, By Nature, 2019-2024
- Market Size (US$ Mn) and Volume (Tons) Analysis and Forecast, By Nature, 2025-2032
- Organic
- Conventional
- Market Attractiveness Analysis: Nature
- Global Pea Protein Market Outlook: Application
- Historical Market Size (US$ Mn) and Volume (Tons) Analysis, By Application, 2019-2024
- Market Size (US$ Mn) and Volume (Tons) Analysis and Forecast, By Application, 2025-2032
- Food & Beverage
- Bakery & Confectionery
- Snacks & Cereals
- Meat Additives
- Beverages
- Sports & Clinical Nutrition
- Animal Feed
- Cosmetics & personal care
- Others
- Food & Beverage
- Market Attractiveness Analysis: Application
- Global Pea Protein Market Outlook: Distribution Channel
- Historical Market Size (US$ Mn) and Volume (Tons) Analysis, By Distribution Channel, 2019-2024
- Market Size (US$ Mn) and Volume (Tons) Analysis and Forecast, By Distribution Channel, 2025-2032
- B2B
- B2C
- Market Attractiveness Analysis: Distribution Channel
- Key Highlights
- Global Pea Protein Market Outlook: Region
- Historical Market Size (US$ Mn) and Volume (Tons) Analysis, By Region, 2019-2024
- Market Size (US$ Mn) and Volume (Tons) Analysis and Forecast, By Region, 2025-2032
- North America
- Latin America
- Europe
- East Asia
- South Asia and Oceania
- Middle East & Africa
- Market Attractiveness Analysis: Region
- North America Pea Protein Market Outlook
- Historical Market Size (US$ Mn) and Volume (Tons) Analysis, By Market, 2019-2024
- By Country
- By Product Type
- By Nature
- By Application
- By Distribution Channel
- Market Size (US$ Mn) and Volume (Tons) Analysis and Forecast, By Country, 2025-2032
- U.S.
- Canada
- Market Size (US$ Mn) and Volume (Tons) Analysis and Forecast, By Product Type, 2025-2032
- Isolates
- Concentrates
- Hydrolysate
- Market Size (US$ Mn) and Volume (Tons) Analysis and Forecast, By Nature, 2025-2032
- Organic
- Conventional
- Market Size (US$ Mn) and Volume (Tons) Analysis and Forecast, By Application, 2025-2032
- Food & Beverage
- Bakery & Confectionery
- Snacks & Cereals
- Meat Additives
- Beverages
- Sports & Clinical Nutrition
- Animal Feed
- Cosmetics & personal care
- Others
- Food & Beverage
- Market Size (US$ Mn) and Volume (Tons) Analysis and Forecast, By Distribution Channel, 2025-2032
- B2B
- B2C
- Market Attractiveness Analysis
- Historical Market Size (US$ Mn) and Volume (Tons) Analysis, By Market, 2019-2024
- Europe Pea Protein Market Outlook
- Historical Market Size (US$ Mn) and Volume (Tons) Analysis, By Market, 2019-2024
- By Country
- By Product Type
- By Nature
- By Application
- By Distribution Channel
- Market Size (US$ Mn) and Volume (Tons) Analysis and Forecast, By Country, 2025-2032
- Germany
- France
- U.K.
- Italy
- Spain
- Russia
- Rest of Europe
- Market Size (US$ Mn) and Volume (Tons) Analysis and Forecast, By Product Type, 2025-2032
- Isolates
- Concentrates
- Hydrolysate
- Market Size (US$ Mn) and Volume (Tons) Analysis and Forecast, By Nature, 2025-2032
- Organic
- Conventional
- Market Size (US$ Mn) and Volume (Tons) Analysis and Forecast, By Application, 2025-2032
- Food & Beverage
- Bakery & Confectionery
- Snacks & Cereals
- Meat Additives
- Beverages
- Sports & Clinical Nutrition
- Animal Feed
- Cosmetics & personal care
- Others
- Food & Beverage
- Market Size (US$ Mn) and Volume (Tons) Analysis and Forecast, By Distribution Channel, 2025-2032
- B2B
- B2C
- Market Attractiveness Analysis
- Historical Market Size (US$ Mn) and Volume (Tons) Analysis, By Market, 2019-2024
- East Asia Pea Protein Market Outlook
- Historical Market Size (US$ Mn) and Volume (Tons) Analysis, By Market, 2019-2024
- By Country
- By Product Type
- By Nature
- By Application
- By Distribution Channel
- Market Size (US$ Mn) and Volume (Tons) Analysis and Forecast, By Country, 2025-2032
- China
- Japan
- South Korea
- Market Size (US$ Mn) and Volume (Tons) Analysis and Forecast, By Product Type, 2025-2032
- Isolates
- Concentrates
- Hydrolysate
- Market Size (US$ Mn) and Volume (Tons) Analysis and Forecast, By Nature, 2025-2032
- Organic
- Conventional
- Market Size (US$ Mn) and Volume (Tons) Analysis and Forecast, By Application, 2025-2032
- Food & Beverage
- Bakery & Confectionery
- Snacks & Cereals
- Meat Additives
- Beverages
- Sports & Clinical Nutrition
- Animal Feed
- Cosmetics & personal care
- Others
- Food & Beverage
- Market Size (US$ Mn) and Volume (Tons) Analysis and Forecast, By Distribution Channel, 2025-2032
- B2B
- B2C
- Market Attractiveness Analysis
- Historical Market Size (US$ Mn) and Volume (Tons) Analysis, By Market, 2019-2024
- South Asia & Oceania Pea Protein Market Outlook
- Historical Market Size (US$ Mn) and Volume (Tons) Analysis, By Market, 2019-2024
- By Country
- By Product Type
- By Nature
- By Application
- By Distribution Channel
- Market Size (US$ Mn) and Volume (Tons) Analysis and Forecast, By Country, 2025-2032
- India
- Indonesia
- Thailand
- Singapore
- ANZ
- Rest of South Asia & Oceania
- Market Size (US$ Mn) and Volume (Tons) Analysis and Forecast, By Product Type, 2025-2032
- Isolates
- Concentrates
- Hydrolysate
- Market Size (US$ Mn) and Volume (Tons) Analysis and Forecast, By Nature, 2025-2032
- Organic
- Conventional
- Market Size (US$ Mn) and Volume (Tons) Analysis and Forecast, By Application, 2025-2032
- Food & Beverage
- Bakery & Confectionery
- Snacks & Cereals
- Meat Additives
- Beverages
- Sports & Clinical Nutrition
- Animal Feed
- Cosmetics & personal care
- Others
- Food & Beverage
- Market Size (US$ Mn) and Volume (Tons) Analysis and Forecast, By Distribution Channel, 2025-2032
- B2B
- B2C
- Market Attractiveness Analysis
- Historical Market Size (US$ Mn) and Volume (Tons) Analysis, By Market, 2019-2024
- Latin America Pea Protein Market Outlook
- Historical Market Size (US$ Mn) and Volume (Tons) Analysis, By Market, 2019-2024
- By Country
- By Product Type
- By Nature
- By Application
- By Distribution Channel
- Market Size (US$ Mn) and Volume (Tons) Analysis and Forecast, By Country, 2025-2032
- Brazil
- Mexico
- Rest of Latin America
- Market Size (US$ Mn) and Volume (Tons) Analysis and Forecast, By Product Type, 2025-2032
- Isolates
- Concentrates
- Hydrolysate
- Market Size (US$ Mn) and Volume (Tons) Analysis and Forecast, By Nature, 2025-2032
- Organic
- Conventional
- Market Size (US$ Mn) and Volume (Tons) Analysis and Forecast, By Application, 2025-2032
- Food & Beverage
- Bakery & Confectionery
- Snacks & Cereals
- Meat Additives
- Beverages
- Sports & Clinical Nutrition
- Animal Feed
- Cosmetics & personal care
- Others
- Food & Beverage
- Market Size (US$ Mn) and Volume (Tons) Analysis and Forecast, By Distribution Channel, 2025-2032
- B2B
- B2C
- Market Attractiveness Analysis
- Historical Market Size (US$ Mn) and Volume (Tons) Analysis, By Market, 2019-2024
- Middle East & Africa Pea Protein Market Outlook
- Historical Market Size (US$ Mn) and Volume (Tons) Analysis, By Market, 2019-2024
- By Country
- By Product Type
- By Nature
- By Application
- By Distribution Channel
- Market Size (US$ Mn) and Volume (Tons) Analysis and Forecast, By Country, 2025-2032
- GCC Countries
- Egypt
- South Africa
- Northern Africa
- Rest of Middle East & Africa
- Market Size (US$ Mn) and Volume (Tons) Analysis and Forecast, By Product Type, 2025-2032
- Isolates
- Concentrates
- Hydrolysate
- Market Size (US$ Mn) and Volume (Tons) Analysis and Forecast, By Nature, 2025-2032
- Organic
- Conventional
- Market Size (US$ Mn) and Volume (Tons) Analysis and Forecast, By Application, 2025-2032
- Food & Beverage
- Bakery & Confectionery
- Snacks & Cereals
- Meat Additives
- Beverages
- Sports & Clinical Nutrition
- Animal Feed
- Cosmetics & personal care
- Others
- Food & Beverage
- Market Size (US$ Mn) and Volume (Tons) Analysis and Forecast, By Distribution Channel, 2025-2032
- B2B
- B2C
- Market Attractiveness Analysis
- Historical Market Size (US$ Mn) and Volume (Tons) Analysis, By Market, 2019-2024
- Competition Landscape
- Market Share Analysis, 2024
- Market Structure
- Competition Intensity Mapping By Market
- Competition Dashboard
- Company Profiles (Details - Overview, Financials, Strategy, Recent Developments)
- Ingredion Incorporated
- Overview
- Segments and Product Type
- Key Financials
- Market Developments
- Market Strategy
- Cargill, Incorporated
- IFF
- DuPont de Nemours, Inc.
- Glanbia plc
- Roquette Frères
- A&B Ingredients, Inc
- NOW® Foods
- ADM
- Kerry Group plc
- Burcon
- The Scoular Company
- COSUCRA
- Emsland Group
- AGT Food and Ingredients Inc.
- Puris
- Daily Harvest
- Others
- Ingredion Incorporated
- Appendix
- Research Methodology
- Research Assumptions
- Acronyms and Abbreviations

Loading page data
Please wait a moment


