

- Executive Summary
- Global Oncology Mice Models Market Snapshot, 2026 and 2033
- Market Opportunity Assessment, 2026 – 2033, US$ Mn
- Key Market Trends
- Future Market Projections
- Premium Market Insights
- Industry Developments and Key Market Events
- PMR Analysis and Recommendations
- Market Overview
- Market Scope and Definition
- Market Dynamics
- Drivers
- Restraints
- Opportunity
- Challenges
- Key Trends
- Macro-Economic Factors
- Global Sectorial Outlook
- Global GDP Growth Outlook
- COVID-19 Impact Analysis
- Forecast Factors – Relevance and Impact
- Value Added Insights
- Regulatory Landscape
- Product Adoption Analysis
- Value Chain Analysis
- Key Deals and Mergers
- PESTLE Analysis
- Porter’s Five Force Analysis
- Global Oncology Mice Models Market Outlook:
- Key Highlights
- Market Size (US$ Mn) and Y-o-Y Growth
- Absolute $ Opportunity
- Market Size (US$ Mn) Analysis and Forecast
- Historical Market Size (US$ Mn) Analysis, 2020-2025
- Market Size (US$ Mn) Analysis and Forecast, 2026–2033
- Global Oncology Mice Models Market Outlook: Product
- Introduction / Key Findings
- Historical Market Size (US$ Mn) Analysis, By Product, 2020 – 2025
- Market Size (US$ Mn) Analysis and Forecast, By Product, 2026 – 2033
- Humanized Immune System Mice Models
- Syngeneic Tumor Mice Models
- Immunodeficient Mice Models
- NOG Mice Models
- Spontaneous Tumor Mice Models
- Others
- Market Attractiveness Analysis: Product
- Global Oncology Mice Models Market Outlook: End User
- Introduction / Key Findings
- Historical Market Size (US$ Mn) Analysis, By End User, 2020 – 2025
- Market Size (US$ Mn) Analysis and Forecast, By End User, 2026 – 2033
- Contract Research Organizations
- Pharma and Biopharma Companies
- Academic and Research Institutes
- Market Attractiveness Analysis: End User
- Key Highlights
- Global Oncology Mice Models Market Outlook: Region
- Key Highlights
- Historical Market Size (US$ Mn) Analysis, By Region, 2020 – 2025
- Market Size (US$ Mn) Analysis and Forecast, By Region, 2026 – 2033
- North America
- Europe
- East Asia
- South Asia and Oceania
- Latin America
- Middle East & Africa
- Market Attractiveness Analysis: Region
- North America Oncology Mice Models Market Outlook:
- Key Highlights
- Historical Market Size (US$ Mn) Analysis, By Market, 2020 – 2025
- By Country
- By Product
- By End User
- Market Size (US$ Mn) Analysis and Forecast, By Country, 2026 – 2033
- U.S.
- Canada
- Market Size (US$ Mn) Analysis and Forecast, By Product, 2026 – 2033
- Humanized Immune System Mice Models
- Syngeneic Tumor Mice Models
- Immunodeficient Mice Models
- NOG Mice Models
- Spontaneous Tumor Mice Models
- Others
- Market Size (US$ Mn) Analysis and Forecast, By End User, 2026 – 2033
- Contract Research Organizations
- Pharma and Biopharma Companies
- Academic and Research Institutes
- Market Attractiveness Analysis
- Europe Oncology Mice Models Market Outlook:
- Key Highlights
- Historical Market Size (US$ Mn) Analysis, By Market, 2020 – 2025
- By Country
- By Product
- By End User
- Market Size (US$ Mn) Analysis and Forecast, By Country, 2026 – 2033
- Germany
- France
- U.K.
- Italy
- Spain
- Russia
- Rest of Europe
- Market Size (US$ Mn) Analysis and Forecast, By Product, 2026 – 2033
- Humanized Immune System Mice Models
- Syngeneic Tumor Mice Models
- Immunodeficient Mice Models
- NOG Mice Models
- Spontaneous Tumor Mice Models
- Others
- Market Size (US$ Mn) Analysis and Forecast, By End User, 2026 – 2033
- Contract Research Organizations
- Pharma and Biopharma Companies
- Academic and Research Institutes
- Market Attractiveness Analysis
- East Asia Oncology Mice Models Market Outlook:
- Key Highlights
- Historical Market Size (US$ Mn) Analysis, By Market, 2020 – 2025
- By Country
- By Product
- By End User
- Market Size (US$ Mn) Analysis and Forecast, By Country, 2026 – 2033
- China
- Japan
- South Korea
- Market Size (US$ Mn) Analysis and Forecast, By Product, 2026 – 2033
- Humanized Immune System Mice Models
- Syngeneic Tumor Mice Models
- Immunodeficient Mice Models
- NOG Mice Models
- Spontaneous Tumor Mice Models
- Others
- Market Size (US$ Mn) Analysis and Forecast, By End User, 2026 – 2033
- Contract Research Organizations
- Pharma and Biopharma Companies
- Academic and Research Institutes
- Market Attractiveness Analysis
- South Asia & Oceania Oncology Mice Models Market Outlook:
- Key Highlights
- Historical Market Size (US$ Mn) Analysis, By Market, 2020 – 2025
- By Country
- By Product
- By End User
- Market Size (US$ Mn) Analysis and Forecast, By Country, 2026 – 2033
- India
- Southeast Asia
- ANZ
- Rest of South Asia & Oceania
- Market Size (US$ Mn) Analysis and Forecast, By Product, 2026 – 2033
- Humanized Immune System Mice Models
- Syngeneic Tumor Mice Models
- Immunodeficient Mice Models
- NOG Mice Models
- Spontaneous Tumor Mice Models
- Others
- Market Size (US$ Mn) Analysis and Forecast, By End User, 2026 – 2033
- Contract Research Organizations
- Pharma and Biopharma Companies
- Academic and Research Institutes
- Market Attractiveness Analysis
- Latin America Oncology Mice Models Market Outlook:
- Key Highlights
- Historical Market Size (US$ Mn) Analysis, By Market, 2020 – 2025
- By Country
- By Product
- By End User
- Market Size (US$ Mn) Analysis and Forecast, By Country, 2026 – 2033
- Brazil
- Mexico
- Rest of Latin America
- Market Size (US$ Mn) Analysis and Forecast, By Product, 2026 – 2033
- Humanized Immune System Mice Models
- Syngeneic Tumor Mice Models
- Immunodeficient Mice Models
- NOG Mice Models
- Spontaneous Tumor Mice Models
- Others
- Market Size (US$ Mn) Analysis and Forecast, By End User, 2026 – 2033
- Contract Research Organizations
- Pharma and Biopharma Companies
- Academic and Research Institutes
- Market Attractiveness Analysis
- Middle East & Africa Oncology Mice Models Market Outlook:
- Key Highlights
- Historical Market Size (US$ Mn) Analysis, By Market, 2020 – 2025
- By Country
- By Product
- By End User
- Market Size (US$ Mn) Analysis and Forecast, By Country, 2026 – 2033
- GCC Countries
- Egypt
- South Africa
- Northern Africa
- Rest of Middle East & Africa
- Market Size (US$ Mn) Analysis and Forecast, By Product, 2026 – 2033
- Humanized Immune System Mice Models
- Syngeneic Tumor Mice Models
- Immunodeficient Mice Models
- NOG Mice Models
- Spontaneous Tumor Mice Models
- Others
- Market Size (US$ Mn) Analysis and Forecast, By End User, 2026 – 2033
- Contract Research Organizations
- Pharma and Biopharma Companies
- Academic and Research Institutes
- Market Attractiveness Analysis
- Competition Landscape
- Market Share Analysis, 2025
- Market Structure
- Competition Intensity Mapping By Market
- Competition Dashboard
- Company Profiles (Details – Overview, Financials, Strategy, Recent Developments)
- The Jackson Laboratory
- Overview
- Segments and Products
- Key Financials
- Market Developments
- Market Strategy
- Charles River
- Taconic
- Shanghai Model organism
- Envigo
- Biocytogen
- Cyagen
- Genoway
- Applied stem cells
- Ingenious targeting labs
- PolyGene - Transgenic mice model company
- Creative Biolabs
- TransCure Bioservices
- Champions oncology
- Certis oncology
- Sygnature Discovery
- Pharmaron
- Labcorp
- Gempharmatech
- Janvier Labs
- Harbour Biomed
- Crown Bioscience Inc. (JSR Corporation)
- Others
- The Jackson Laboratory
- Appendix
- Research Methodology
- Research Assumptions
- Acronyms and Abbreviations


- Biotechnology
- Oncology Mice Models Market
Oncology Mice Models Market Size, Share, Growth, and Regional Forecast, 2026 to 2033
Oncology Mice Models Market by Product (Humanized Immune System Mice Model, Syngeneic Tumor Mice Model, Immunodeficient Mice Models, NOG Mice Models, Spontaneous Tumor Mice Models, Others), Distribution Channel (Contract Research Organizations, Pharma and Biopharma Companies, Academic and Research Institutes), and Regional Analysis from 2026 to 2033.
Key Industry Highlights
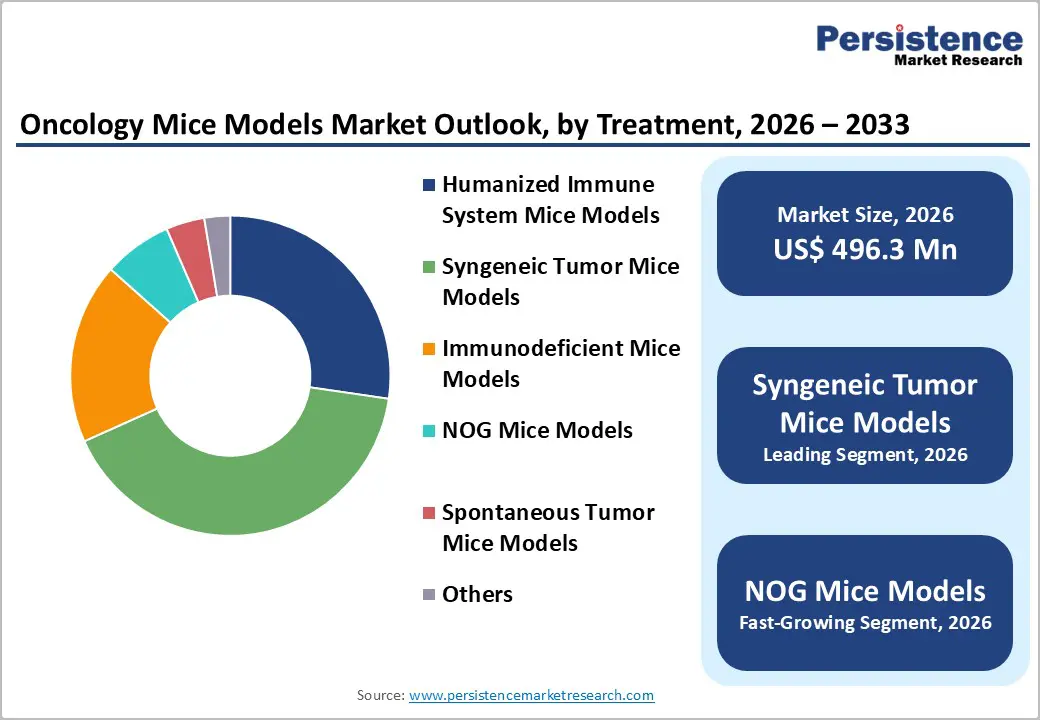
- Dominant Segment: Syngeneic Tumor Mice Models account for 41.0% share of the oncology mice models market in 2025, driven by their extensive use in immuno-oncology research, compatibility with intact immune systems, cost-effectiveness, and strong adoption in checkpoint inhibitor and combination therapy studies.
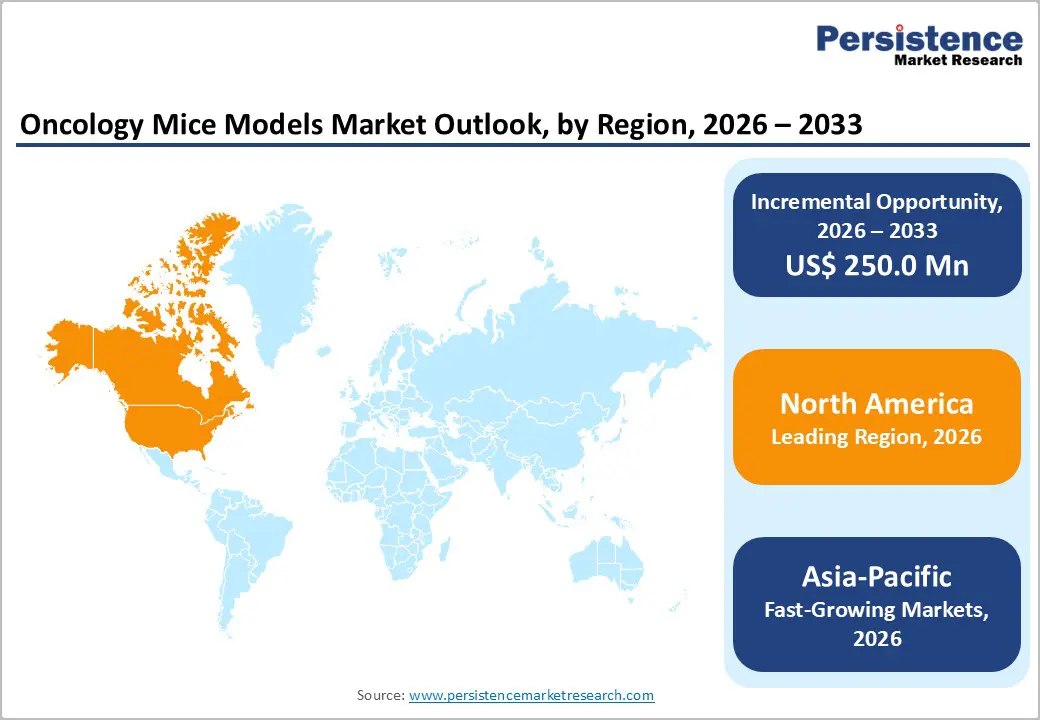
- Dominant Region: North America leads the oncology mice models market with 44.0% share in 2025, supported by robust biopharma R&D spending, advanced preclinical infrastructure, and strong academic–industry collaboration. Asia-Pacific is the fastest-growing region, driven by expanding CRO capacity, rising oncology drug pipelines, and increasing government research funding.
- Market Drivers: Rising global cancer incidence, rapid growth of immuno-oncology and cell-based therapies, increasing demand for predictive and translational preclinical models, expansion of outsourced research to CROs, and continuous innovation in humanized and genetically engineered mouse models are driving market growth.
- Market Opportunity: Key opportunities include development of advanced humanized immune system models, integration with precision oncology platforms, expansion of personalized tumor xenograft services, increased adoption in emerging biotech firms, and growth across Asia-Pacific supported by rising clinical research investments.
| Key Insights | Details |
|---|---|
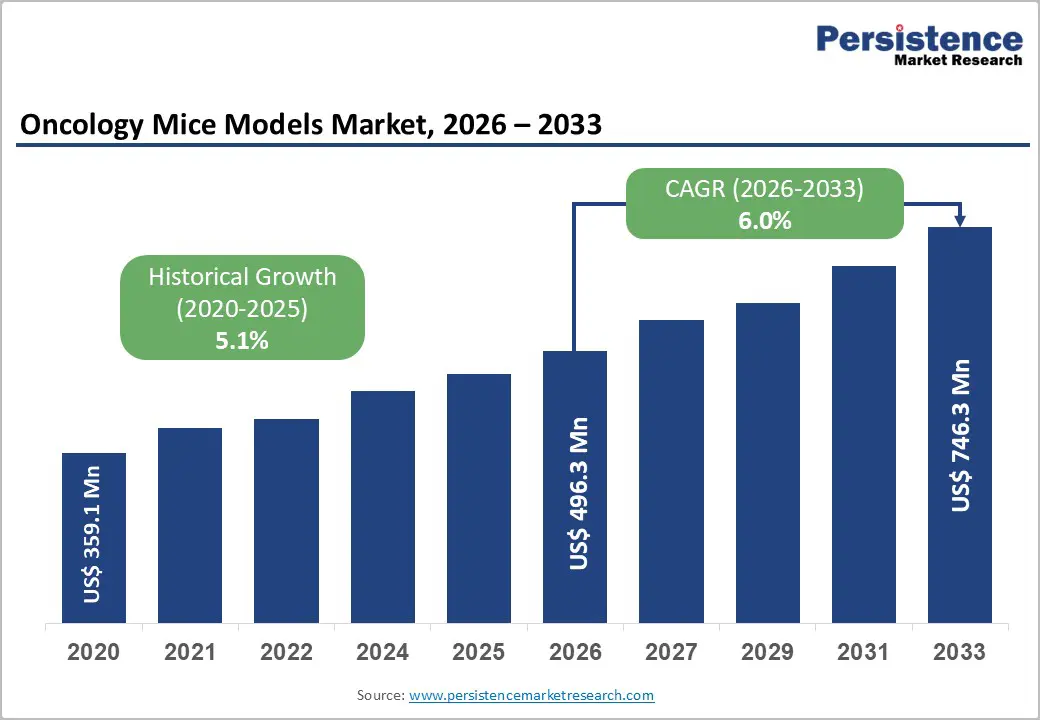
| Oncology Mice Models Market Size (2026E) | US$ 496.3 Mn |
| Market Value Forecast (2033F) | US$ 746.3 Mn |
| Projected Growth (CAGR 2026 to 2033) | 6.0% |
| Historical Market Growth (CAGR 2020 to 2025) | 5.1% |
Market Dynamics
Driver: Rapid Growth of Immuno-Oncology and Cell-Based Therapies
The global immuno-oncology sector is expanding rapidly as cancer treatment pivots toward immune-based approaches that harness the patient’s own immune system. Market valuation projections and clinical trial activity reflect this shift: multiple reports forecast the immuno-oncology market to grow at robust compounded annual growth rates (CAGRs) above 15–19% through the early 2030s, driven by immune checkpoint inhibitors, CAR-T therapies, and emerging combination regimens. Immuno-oncology treatments represent a substantial portion of new cancer therapeutic approvals and clinical pipelines, with an increasing number of therapies now focusing on personalized and targeted immune engagement to improve survival outcomes across diverse tumor types.
This surge directly fuels demand for advanced preclinical oncology models, including syngeneic, humanized, and genetically engineered mouse models, which are essential for testing immunotherapies, checkpoint inhibitors, and adaptive cell therapies before clinical translation. Preclinical researchers and biopharma companies use these models to assess efficacy, toxicity, and immune modulation in vivo, helping streamline candidate selection and reduce late-stage failures. As immuno-oncology pipelines proliferate and biomarkers become central to therapy stratification, the requirement for predictive and translational animal models in early-stage drug discovery and IND submissions increases proportionally.
Restraints: High Cost of Developing and Maintaining Specialized Mouse Models
Specialized oncology mouse models particularly genetically engineered and humanized models, command significantly higher acquisition and maintenance costs than basic laboratory rodents. Reports indicate that genetically modified animal models can cost 60–80% more than standard laboratory animals due to added breeding complexity, genetic validation, and facility requirements. Such premium cost structures present budgetary constraints for smaller academic labs, emerging biotech firms, and research institutions with limited grant funding, constraining broader adoption despite demonstrated scientific utility.
In addition to model procurement expenses, compliance with regulatory and animal welfare standards , such as those mandated by the U.S. Animal Welfare Act further elevates operational costs through facility upgrades, trained veterinary care, and specialized technical staffing. These financial and compliance burdens can delay project timelines, reduce available research funds for experimental cohorts, and drive some groups to explore non-animal alternatives or scaled-down in vivo programs. The net impact is a market restraint where cost concerns limit investment in advanced model platforms.
Opportunity: Integration with Precision Oncology and Biomarker Research
Precision oncology, the tailoring of cancer treatment to individual molecular and genetic profiles is rapidly reshaping oncology research and clinical practice. Clinical data show that a growing share of oncology therapies approved by regulatory authorities incorporate molecularly defined biomarkers, with nearly 43% of FDA-approved oncology therapies featuring biomarkers detectable by next-generation sequencing as of 2023. This reflects a paradigm where therapeutic decisions increasingly hinge on genomic signatures and actionable targets, enhancing treatment specificity and clinical outcomes.
This trend opens a significant market opportunity for oncology mice models, as these models can be genetically engineered or selected to mirror specific biomarker profiles in human tumors for preclinical validation of targeted therapies. Researchers use such models to investigate treatment response, resistance mechanisms, and biomarker-guided therapeutic stratification. With continued expansion of precision oncology initiatives (such as broad genomic sequencing efforts and large?scale cohorts), demand for predictive in vivo platforms is expected to grow, enabling companies and research organizations to integrate richer molecular context into preclinical pipelines.
Category-wise Analysis
By Product, Syngeneic Tumor Mice Models Dominates the Oncology Mice Models Market
Syngeneic Tumor Mice Models occupies 41.0% share of the global market in 2025, because they allow evaluation of anticancer agents in an immunocompetent system, essential for immuno-oncology research. Unlike xenograft models that require immunodeficient hosts, syngeneic models preserve intact immune networks, enabling studies of immune checkpoints, vaccines, and combination therapies. The importance of immune-competent models is reflected in clinical trends: the U.S. National Cancer Institute (NCI) reports that immune checkpoint inhibitors (e.g., anti-PD-1/PD-L1 therapies) constituted a significant portion of new oncology drug approvals over the last decade, underscoring the focus on immune mechanisms. Syngeneic models support this research by providing reproducible tumor growth in genetically matched hosts, driving adoption across preclinical pipelines and resulting in market dominance.
By End User, Pharma and Biopharma Companies dominates due to high oncology R&D investment
Pharma and biopharma companies dominate because they conduct the bulk of oncology drug discovery and development, investing heavily in preclinical model systems that support IND filings and regulatory submissions. In the U.S., the FDA’s oncology pipeline consistently shows that a large majority of new drug applications originate from pharmaceutical and biotech sponsors, with over 50% of oncology clinical trials sponsored by industry compared to ~15% by academic institutions (ClinicalTrials.gov dataset). Additionally, companies invest in advanced models, including genetically engineered and humanized mice to assess safety, efficacy, and immune interactions, which smaller institutions often cannot fund. This concentration of R&D spend by industry drives their leading share in the market.
Regional Insights
North America Oncology Mice Models Market Trends
North America dominates due to its largest share of global oncology research, advanced infrastructure, and substantial funding for cancer R&D. The region accounts for 44.0% of global oncology mice models market, reflecting heavy investment in preclinical systems that underpin mouse model usage. U.S. institutions like the National Institutes of Health (NIH) invest billions annually in cancer research, driving experimental oncology pipelines and preclinical model demand. The presence of numerous biotechnology clusters, specialized CROs, world-class universities, and a strong regulatory ecosystem fosters rapid translation from research to development. Higher healthcare and research spending per capita further reinforce North America’s role as the primary hub for oncology preclinical activity and model adoption.
Europe Oncology Mice Models Market Trends
Europe is a key market due to its robust healthcare systems, collaborative research networks, and substantial public funding for oncology and translational science. Countries such as Germany, the U.K., and France maintain advanced preclinical research capabilities and strong regulatory frameworks that support model development and adoption. European healthcare systems often cover a high share of treatment costs, enabling broader access to oncology innovations and facilitating clinical research synergies with preclinical work. Cross-border academic and industry collaborations, supported by EU-level programs and comprehensive cancer registries, contribute to Europe’s significant role in oncology research. The prevalence of targeted therapy use and biomarker-driven clinical strategies further boosts demand for sophisticated animal models in translational cancer studies.
Asia-Pacific Oncology Mice Models Market Trends
Asia-Pacific’s rapid growth is propelled by its rising cancer burden, expanding research infrastructure, and increasing healthcare investments. APAC accounts for a substantial share of new global cancer cases and deaths, creating strong demand for improved diagnostics and therapeutic research capacity. The large and diverse patient population supports efficient recruitment for oncology research and preclinical programs alike. Governments across China, India, and other nations are boosting healthcare expenditure and building advanced facilities, increasing local R&D activity. Operational costs in Asia-Pacific are typically lower than in Western regions, attracting global trials and preclinical outsourcing. Growth in contract research organizations and improved regulatory acceptance of regional data also accelerates adoption of oncology models in this region.
Market Competitive Landscape
The oncology mice models market comprises specialized biotechnology firms, laboratory animal suppliers, and CROs providing syngeneic, humanized, and genetically engineered models. Competition is driven by model reliability, translational relevance, and regulatory compliance. Companies focus on innovation in immune-humanized platforms, CRISPR-based engineering, strategic partnerships, and expansion of preclinical research services globally.
Key Industry Developments:
- In December 2025, The Jackson Laboratory announced that it had received a contract award of up to $30 million to advance drug safety testing through the development of artificial intelligence–powered “virtual hearts.” The initiative aimed to enhance preclinical safety assessment by using computational models and AI algorithms to simulate human cardiac responses to investigational drugs.
- In April 2025, Charles River Laboratories announced that it had leveraged advanced technologies to accelerate oncology drug discovery and development programs. The company integrated innovative in vivo and in vitro platforms, including advanced mouse models, cell-based assays, and data analytics tools, to improve translational accuracy and streamline preclinical workflows.
Companies Covered in Oncology Mice Models Market
- The Jackson Laboratory
- Charles River
- Taconic
- Shanghai Model organism
- Envigo
- Biocytogen
- Cyagen
- Genoway
- Applied stem cells
- Ingenious targeting labs
- PolyGene - Transgenic mice model company
- Creative Biolabs
- TransCure Bioservices
- Champions oncology
- Certis oncology
- Sygnature Discovery
- Pharmaron
- Labcorp
- Gempharmatech
- Janvier Labs
- Harbour Biomed
- Crown Bioscience Inc. (JSR Corporation)
- Others
Frequently Asked Questions
The global oncology mice models market is projected to be valued at US$ 496.3 Mn in 2026.
Rising cancer incidence and expanding immuno-oncology drug development pipelines globally.
The global oncology mice models market is poised to witness a CAGR of 6.0% between 2026 and 2033.
Advanced humanized models and precision oncology biomarker-driven preclinical research expansion.
The Jackson Laboratory, Charles River, Taconic, Shanghai Model organism, Envigo, Biocytogen.


