


- Biotechnology
- Oncology Biosimilars Market
Oncology Biosimilars Market Size, Share, Growth, and Regional Forecast, 2026 to 2033
Oncology Biosimilars Market by Drug Class (Monoclonal Antibodies (mAbs), Granulocyte Colony-Stimulating Factor (G-CSF), Erythropoiesis-Stimulating Agents (ESAs), Others), Indication (Breast Cancer, Lung Cancer, Colorectal Cancer, Cervical Cancer, Blood Cancer, Others), Route of Administration (Intravenous (IV), Subcutaneous (SC), Others), Distribution Channel (Hospital Pharmacies, Retail Pharmacies, Online Pharmacies), and Regional Analysis from 2026 to 2033
Oncology Biosimilars Market Share and Trends Analysis
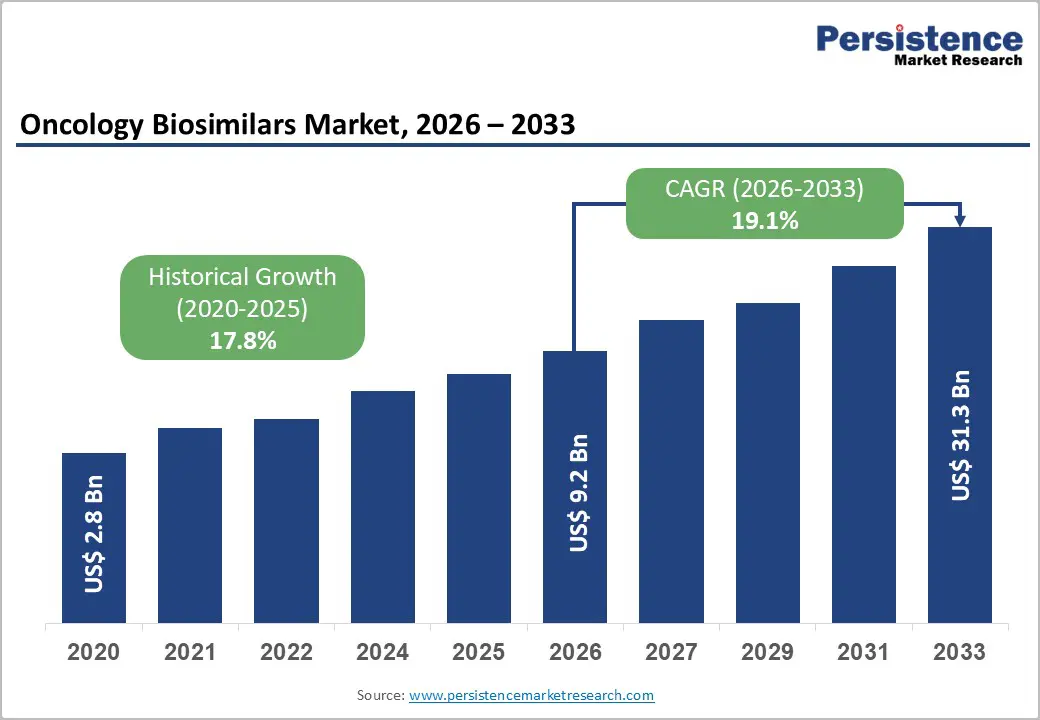
The global oncology biosimilars market is estimated to grow from US$ 9.2 billion in 2026 to US$ 31.3 billion by 2033. The market is projected to record a CAGR of 19.1% during the forecast period from 2026 to 2033.
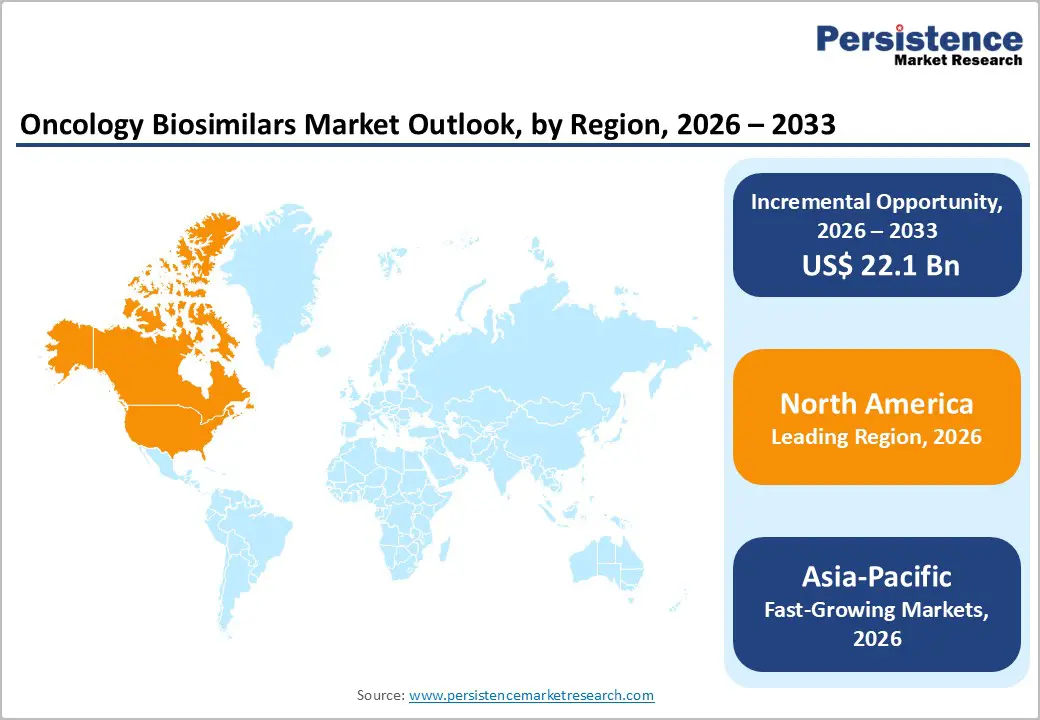
The global market is expanding steadily due to rising cancer prevalence, increasing demand for cost-effective biologic therapies, and patent expirations of major oncology biologics. Europe leads the market with strong biosimilar adoption and supportive regulatory frameworks, while Asia-Pacific is the fastest-growing region, driven by expanding healthcare access, local biosimilar manufacturing, and increasing cancer treatment demand.
Key Industry Highlights:
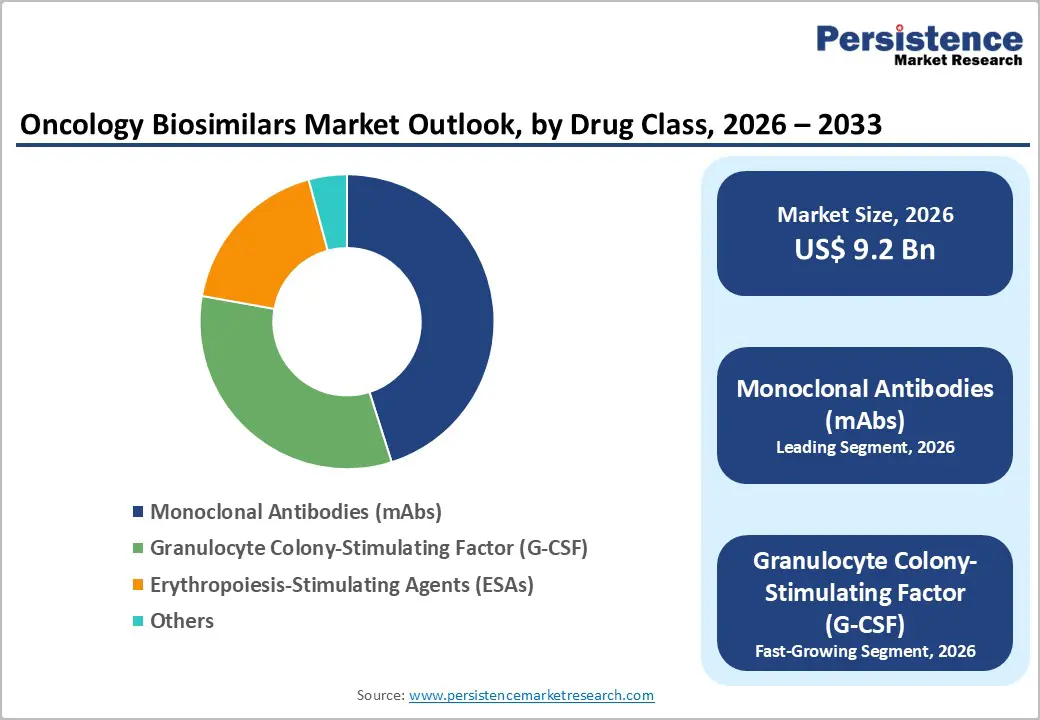
- Dominant Drug Class Segment: Monoclonal Antibodies (mAbs) accounted for 45.1% share in 2025, driven by strong demand for biosimilars of blockbuster biologics such as trastuzumab, rituximab, and bevacizumab. Increasing patent expirations of originator biologics, rising adoption of targeted cancer therapies, and supportive regulatory approvals are accelerating the commercialization and uptake of monoclonal antibody biosimilars globally.
- Regional Leadership: North America is the leading region in the oncology biosimilars market with around 38.0% share in 2025, supported by increasing adoption of biosimilar oncology drugs, strong healthcare infrastructure, favorable regulatory approvals, growing cancer prevalence, and the presence of major biopharmaceutical companies expanding biosimilar portfolios.
- Growth Indicators: Rise in global cancer prevalence, increasing demand for cost-effective biologic therapies, patent expirations of major oncology biologics, growing acceptance of biosimilars among physicians, and supportive regulatory frameworks encouraging biosimilar approvals and market entry.
- Market Opportunity: Opportunities include expanding biosimilar pipelines for monoclonal antibodies, increasing biosimilar adoption in emerging markets, strategic collaborations between biopharmaceutical companies, and growing government initiatives aimed at reducing oncology treatment costs through wider biosimilar utilization.
| Key Insights | Details |
|---|---|
| Global Oncology Biosimilars Market Size (2026E) | US$ 9.2 Bn |
| Market Value Forecast (2033F) | US$ 31.3 Bn |
| Projected Growth (CAGR 2026 to 2033) | 19.1% |
| Historical Market Growth (CAGR 2020 to 2025) | 17.8% |
Market Dynamics
Driver: Increasing Adoption of Cost-Effective Biosimilar Therapies
The increasing adoption of cost-effective biosimilar therapies is a major driver of the Oncology Biosimilars Market because biologic cancer drugs are among the most expensive treatments globally. Biosimilars offer comparable safety and efficacy to reference biologics but at significantly lower prices, improving patient access to cancer therapy. Studies show that biosimilars typically cost about 30% less than original biologic medicines, creating strong incentives for healthcare providers and insurers to adopt them in oncology treatment pathways. In addition, competition from biosimilars has significantly reduced the prices of several widely used oncology biologics, including trastuzumab and rituximab, enabling healthcare systems to manage rising cancer treatment costs more effectively.
The economic impact of biosimilar adoption has already been substantial across healthcare systems. In the United States, biosimilars generated more than $12.4 billion in healthcare savings in 2023, and total savings since their introduction in 2015 have reached approximately $36 billion, according to data from the Association for Accessible Medicines. Oncology biosimilars alone have contributed billions in cost reductions, with reports indicating over $17 billion in oncology-related savings in recent years as biosimilar versions of drugs such as bevacizumab and trastuzumab entered the market. These cost advantages are encouraging hospitals, insurers, and national health systems to prioritize biosimilars, accelerating their adoption and supporting overall market growth.
Restraint: High Development and Manufacturing Costs of Biosimilars
Despite their long-term cost benefits, biosimilars require significant investment in development and manufacturing, which acts as a major restraint for the Oncology Biosimilars Market. Unlike traditional generic drugs, biosimilars are complex biologic products produced using living cells, making the manufacturing process technically challenging and highly regulated. Developers must conduct extensive analytical testing, clinical trials, and comparability studies to demonstrate similarity to the reference biologic, increasing both development time and financial risk. Regulatory authorities such as the U.S. Food and Drug Administration require detailed evidence to ensure that biosimilars match the safety, quality, and efficacy of originator biologics before approval.
As a result, biosimilar development costs are significantly higher than those of conventional generics. Industry analyses suggest that biosimilar development can cost hundreds of millions of dollars, and complex regulatory requirements further increase expenses. Regulatory agencies are now exploring ways to reduce development costs; for example, recent FDA proposals aim to streamline biosimilar testing requirements and could potentially reduce development costs by up to 50%, lowering expenses by around $20 million per product. However, the high upfront investment remains a key barrier for many pharmaceutical companies, limiting the number of firms able to enter the biosimilar market and slowing the pace of new oncology biosimilar launches.
Opportunity: Expanding Biosimilar Pipeline for Oncology Monoclonal Antibodies
The expanding pipeline of biosimilars for oncology monoclonal antibodies presents a major opportunity for the Oncology Biosimilars Market. Many blockbuster biologic cancer therapies, including monoclonal antibodies targeting HER2, VEGF, and CD20 are approaching or have recently reached patent expiration. As these patents expire, pharmaceutical companies are increasingly developing biosimilar versions to capture market share and provide more affordable treatment options. The strong uptake of existing oncology biosimilars demonstrates the commercial potential of this segment. For example, biosimilars of widely used oncology antibodies such as bevacizumab, trastuzumab, and rituximab achieved adoption rates of about 82%, 80%, and 67%, respectively, within three years of launch in some markets.
Future opportunities are further supported by the large number of biologic drugs expected to lose exclusivity over the next decade. With many high-revenue oncology biologics approaching patent expiry, biosimilar developers have significant opportunities to introduce competitive alternatives. Healthcare systems are actively encouraging biosimilar use to control rising cancer treatment costs, particularly as global cancer spending continues to grow rapidly. In the United States alone, cancer treatment spending has exceeded $70 billion annually, creating strong demand for lower-cost biologic alternatives such as biosimilars. As more monoclonal antibody biosimilars enter development and receive regulatory approval, the oncology biosimilars pipeline is expected to expand significantly, creating new revenue opportunities for pharmaceutical manufacturers and improving patient access to advanced cancer therapies.
Category-wise Analysis
By Drug Class Insights
Monoclonal antibodies (mAbs) dominate the oncology biosimilars market with 45.1% share in 2025, because many widely used biologic cancer therapies belong to this class. These targeted therapies are used to treat several cancers, including breast cancer, colorectal cancer, and lymphoma, increasing their clinical demand. As patents of major biologics such as trastuzumab, rituximab, and bevacizumab expire, biosimilar versions are being launched to reduce treatment costs and expand patient access. According to the World Health Organization (WHO), cancer caused nearly 10 million deaths globally in 2022, increasing the need for effective targeted therapies. Monoclonal antibodies work by specifically targeting cancer-related proteins and blocking tumor growth pathways. Due to their proven clinical efficacy, wide therapeutic applications, and increasing biosimilar approvals, monoclonal antibodies hold the largest share in the oncology biosimilars market.
By Indication Insights
Breast cancer dominates the oncology biosimilars market due to its high global prevalence and the widespread use of biologic therapies in its treatment. According to the World Health Organization (WHO), about 2.3 million women were diagnosed with breast cancer worldwide in 2022, making it the most commonly diagnosed cancer globally. Many breast cancer treatments rely on targeted monoclonal antibodies such as trastuzumab for HER2-positive tumors. As patents for these biologic drugs have expired, biosimilar versions are increasingly used to improve treatment affordability and accessibility. Additionally, improved screening programs and rising awareness are increasing early diagnosis rates, further boosting treatment demand. The large patient population, high adoption of targeted therapies, and growing availability of biosimilar trastuzumab products contribute to breast cancer’s leading share in the oncology biosimilars market.
Regional Insights
North America Oncology Biosimilars Market Trends
North America dominates the oncology biosimilars market with 38.7% share in 2025, due to strong regulatory support, high healthcare spending, and the presence of major biopharmaceutical companies. The United States plays a major role because the U.S. Food and Drug Administration (FDA) has established a clear approval pathway for biosimilars through the Biologics Price Competition and Innovation Act. As of 2025, the FDA has approved over 80 biosimilars, many used for oncology and autoimmune diseases, improving patient access to lower-cost biologic therapies. Additionally, North America has a high cancer burden and an advanced healthcare infrastructure that supports the adoption of biologic treatments. Government initiatives to reduce healthcare costs and increase physician confidence in biosimilars are further accelerating adoption, making North America the leading regional market for oncology biosimilars.
Europe Oncology Biosimilar Market Trends
Europe is a key region in the oncology biosimilars market due to early adoption of biosimilars and strong regulatory support from the European Medicines Agency (EMA). Europe was the first region to establish a comprehensive biosimilar regulatory framework, which has encouraged rapid approvals and widespread clinical use. By 2024, more than 100 biosimilars had been approved in Europe, reflecting strong regulatory encouragement for affordable biologic therapies. Additionally, many European countries have implemented policies such as tender-based procurement and biosimilar substitution programs that promote adoption in hospitals. The region also faces a significant cancer burden, with around 2.7 million new cancer cases diagnosed annually in Europe, creating strong demand for cost-effective oncology treatments. These supportive policies and high healthcare awareness make Europe a critical market for oncology biosimilars.
Asia-Pacific Oncology Biosimilar Market Trends
Asia Pacific is the fastest-growing region in the oncology biosimilars market due to the large cancer patient population, improving healthcare infrastructure, and increasing production of biosimilars by regional pharmaceutical companies. According to global cancer statistics, the Asia-Pacific region accounts for nearly 50% of new cancer cases worldwide and over 60% of cancer-related deaths, highlighting the significant demand for affordable oncology treatments. Countries such as China, India, Japan, and South Korea are investing heavily in biosimilar development and manufacturing to reduce treatment costs. Governments across the region are also promoting access to cost-effective biologic medicines through supportive regulatory policies and healthcare expansion programs. Rising awareness of cancer treatment options and increasing adoption of biosimilar monoclonal antibodies are further accelerating market growth across Asia Pacific.
Competitive Landscape
The oncology biosimilars market is highly competitive, led by major biopharmaceutical companies such as Pfizer, Novartis (Sandoz), Viatris, Amgen, and Samsung Bioepis. These players focus on biosimilar development, regulatory approvals, strategic partnerships, and expanding manufacturing capabilities to increase market presence and provide cost-effective biologic cancer therapies worldwide.
Key Industry Developments:
- In September 2025, Novartis deepened its collaboration with Monte Rosa Therapeutics through a second agreement focused on developing protein degrader therapies. The partnership aimed to advance innovative treatments that selectively degrade disease-causing proteins, particularly for cancer and other serious diseases.
- In July 2025, Pfizer completed a licensing agreement with Chinese biotechnology company 3SBio to expand its biosimilar and biologics portfolio. Under the agreement, Pfizer obtained rights to develop and commercialize selected biologic therapies in global markets.
Companies Covered in Oncology Biosimilars Market
- Pfizer Inc.
- Novartis AG
- Mylan N.V. (Viatris)
- Teva Pharmaceutical Industries Ltd.
- BIOCAD
- Apotex Inc.
- Biocon Biologics Ltd.
- Celltrion Inc.
- Amgen Inc.
- Coherus BioSciences, Inc.
- Dr. Reddy’s Laboratories Ltd.
- Alvotech
- Others
Frequently Asked Questions
The global oncology biosimilars market is projected to be valued at US$ 9.2 Bn in 2026.
Rising cancer prevalence, biologic patent expirations, demand for affordable therapies, supportive regulations, and increasing biosimilar adoption globally.
The global oncology biosimilars market is poised to witness a CAGR of 19.1% between 2026 and 2033.
Expanding monoclonal antibody biosimilars, emerging market adoption, patent expirations, strategic partnerships, and advances in biomanufacturing technologies.
Pfizer Inc., Novartis AG, Mylan N.V. (Viatris), Teva Pharmaceutical Industries Ltd., BIOCAD, Apotex Inc.


