

- Executive Summary
- North America North America Quadriplegia Care Devices Market Snapshot, 2026 and 2033
- Market Opportunity Assessment, 2026 – 2033, US$ Mn
- Key Market Trends
- Future Market Projections
- Premium Market Insights
- Industry Developments and Key Market Events
- PMR Analysis and Recommendations
- Market Overview
- Market Scope and Definition
- Market Dynamics
- Drivers
- Restraints
- Opportunity
- Key Trends
- Macro-Economic Factors
- North America Sectorial Outlook
- North America GDP Growth Outlook
- COVID-19 Impact Analysis
- Forecast Factors – Relevance and Impact
- Value Added Insights
- Service Adoption Analysis
- Regulatory Landscape
- Value Chain Analysis
- Key Deals and Mergers
- PESTLE Analysis
- Price Trend Analysis, 2020 - 2033
- Key Highlights
- Key Factors Impacting Product Prices
- Pricing Analysis, By Product Usage
- Regional Prices and Product Preferences
- North America North America Quadriplegia Care Devices Market Outlook:
- Key Highlights
- Market Size (US$ Mn) and Y-o-Y Growth
- Absolute $ Opportunity
- Market Size (US$ Mn) Analysis and Forecast
- Historical Market Size (US$ Mn) Analysis, 2020-2025
- Market Size (US$ Mn) Analysis and Forecast, 2026–2033
- North America North America Quadriplegia Care Devices Market Outlook: Product
- Introduction / Key Findings
- Historical Market Size (US$ Mn) Analysis and Volume (Units) Analysis, By Product, 2020 – 2025
- Market Size (US$ Mn) Analysis and Volume (Units) Analysis and Forecast, By Product, 2026 – 2033
- Wheelchairs
- Assistive Robots
- Adaptive Communication Devices
- Pressure Relief Cushions
- Market Attractiveness Analysis: By Product
- North America North America Quadriplegia Care Devices Market Outlook: Indication
- Introduction / Key Findings
- Historical Market Size (US$ Mn) Analysis, By Indication, 2020 – 2025
- Market Size (US$ Mn) Analysis and Forecast, By Indication, 2026 – 2033
- Incomplete Quadriplegia
- Complete Quadriplegia
- Market Attractiveness Analysis: Indication
- North America North America Quadriplegia Care Devices Market Outlook: End User
- Introduction / Key Findings
- Historical Market Size (US$ Mn) Analysis, By End User, 2020 – 2025
- Market Size (US$ Mn) Analysis and Forecast, By End User, 2026 – 2033
- Hospitals
- Home Care Settings
- Rehabilitation Centers
- Long-Term Care Facilities
- Market Attractiveness Analysis: End User
- Key Highlights
- North America North America Quadriplegia Care Devices Market Outlook: Country
- Key Highlights
- Historical Market Size (US$ Mn) Analysis, By Country, 2020 – 2025
- Market Size (US$ Mn) Analysis and Forecast, By Country, 2026 – 2033
- U.S.
- Canada
- Market Attractiveness Analysis: Country
- U.S. North America Quadriplegia Care Devices Market Outlook:
- Key Highlights
- Historical Market Size (US$ Mn) Analysis, By Market, 2020 – 2025
- By Product
- By Indication
- By End User
- Market Size (US$ Mn) Analysis and Volume (Units) Analysis and Forecast, By Product, 2026 – 2033
- Wheelchairs
- Assistive Robots
- Adaptive Communication Devices
- Pressure Relief Cushions
- Market Size (US$ Mn) Analysis and Forecast, By Indication, 2026 – 2033
- Incomplete Quadriplegia
- Complete Quadriplegia
- Market Size (US$ Mn) Analysis and Forecast, By End User, 2026 – 2033
- Hospitals
- Home Care Settings
- Rehabilitation Centers
- Long-Term Care Facilities
- Market Attractiveness Analysis
- Canada North America Quadriplegia Care Devices Market Outlook:
- Key Highlights
- Historical Market Size (US$ Mn) Analysis, By Market, 2020 – 2025
- By Product
- By Indication
- By End User
- Market Size (US$ Mn) Analysis and Volume (Units) Analysis and Forecast, By Product, 2026 – 2033
- Wheelchairs
- Assistive Robots
- Adaptive Communication Devices
- Pressure Relief Cushions
- Market Size (US$ Mn) Analysis and Forecast, By Indication, 2026 – 2033
- Incomplete Quadriplegia
- Complete Quadriplegia
- Market Size (US$ Mn) Analysis and Forecast, By End User, 2026 – 2033
- Hospitals
- Home Care Settings
- Rehabilitation Centers
- Long-Term Care Facilities
- Market Attractiveness Analysis
- Competition Landscape
- Company Profiles (Details – Overview, Recent Developments)
- Rewalk Robotic Rehab LLP.
- Overview
- Segments and Services
- Key Financials
- Market Developments
- Market Strategy
- Ekso Bionics
- Boston Scientific Corporation
- Medtronic
- Rex Bionics Ltd.
- Össur
- Steeper Group
- Ottobock
- RGK Wheelchair
- AxioBionics
- ONWARD Medical N.V.
- Neuralink
- Others
- Rewalk Robotic Rehab LLP.
- Company Profiles (Details – Overview, Recent Developments)
- Appendix
- Research Methodology
- Research Assumptions
- Acronyms and Abbreviations


- Medical Devices
- North America Quadriplegia Care Devices Market
North America Quadriplegia Care Devices Market Size, Share, Growth, and Regional Forecast, 2026 to 2033
North America Quadriplegia Care Devices Market by Product (Wheelchairs, Assistive Robots, Adaptive Communication Devices, and Pressure Relief Cushions), By Indication (Incomplete Quadriplegia, and Complete Quadriplegia), by End User (Hospitals, Home Care Settings, Rehabilitation Centers, and Long-Term Care Facilities), and Regional Analysis from 2026 to 2033.
North America Quadriplegia Care Devices Market Size and Trend Analysis
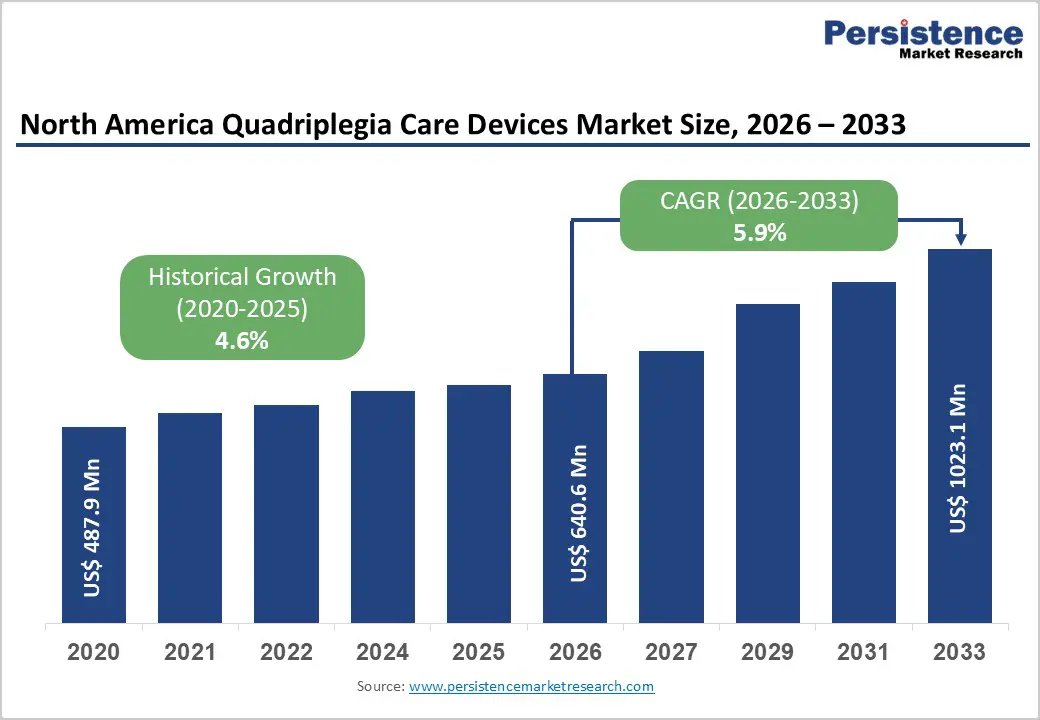
The North America quadriplegia care devices market is estimated to grow from US$ 640.6 Mn in 2026 to US$ 1023.1 Mn by 2033. The market is projected to record a CAGR of 5.9% during the forecast period from 2026 to 2033.
The North America quadriplegia care devices market is driven by the rising incidence of spinal cord injuries, increasing prevalence of chronic and age-related neurological conditions, and growing demand for long-term assistive and rehabilitative care. Traumatic events such as road accidents, falls, sports injuries, and workplace incidents continue to contribute significantly to cervical spinal cord damage, while improved emergency and acute care outcomes are increasing patient survival rates and long-term care needs. Market growth is further supported by sustained investments in advanced mobility technologies, rehabilitation infrastructure, and assistive device innovation, including powered wheelchairs, pressure management systems, robotic rehabilitation tools, and adaptive communication devices. Favorable reimbursement frameworks, disability insurance coverage, and government-supported healthcare and social assistance programs are improving patient access to essential quadriplegia care solutions. Additionally, the expanding shift toward home-based care models and the integration of digital health and smart assistive technologies are further strengthening demand across the region.
Key Industry Highlights
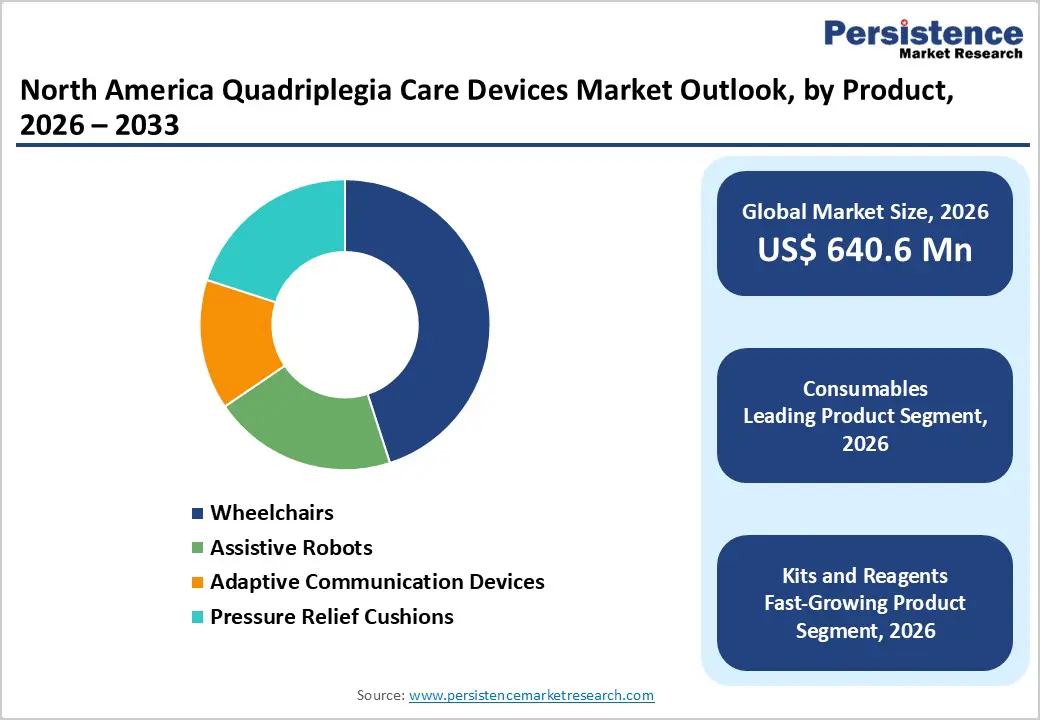
- Leading Product: Wheelchairs dominate the market due to their essential role in daily mobility, rehabilitation, and long-term care for quadriplegic patients. Their broad applicability across hospitals, rehabilitation centers, and home-care settings, combined with relatively lower costs and continuous design improvements, supports widespread adoption.
- Fastest-growing Product: Assistive robots are expanding rapidly owing to advancements in robotic exoskeletons, powered mobility systems, and AI-enabled rehabilitation technologies that enhance functional independence and patient outcomes.
- Leading Indication Type: Incomplete quadriplegia leads the market due to its higher prevalence and the greater need for continuous assistive support, rehabilitation, and mobility enhancement devices over extended care durations.
- Fastest-growing Indication Type: Complete quadriplegia is witnessing steady growth driven by increasing survival rates after severe spinal injuries and rising demand for advanced supportive and communication-assistive technologies.
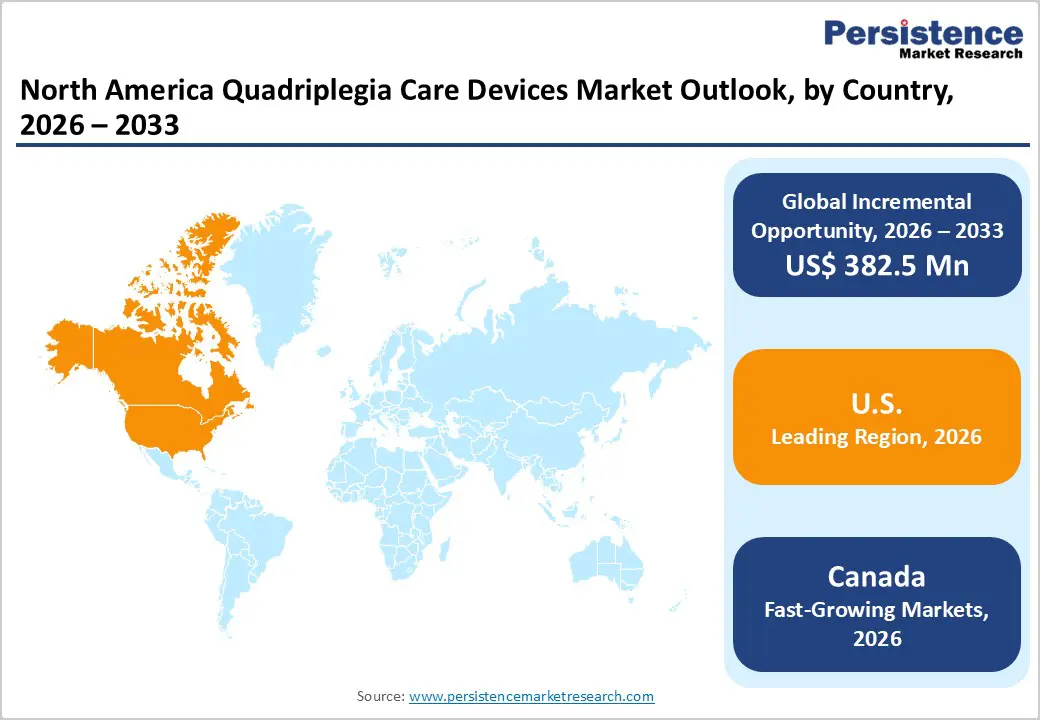
- Leading Country: The U.S. dominates the market due to advanced healthcare infrastructure, higher adoption of assistive technologies, strong reimbursement mechanisms, and a large patient population requiring long-term quadriplegia care.
- Fastest-growing Country: Canada is growing rapidly supported by expanding rehabilitation services, increased government investment in disability care programs, and improved access to advanced assistive devices across urban and remote regions.
| U.S. Market Attributes | Key Insights |
|---|---|
| North America Quadriplegia Care Devices Market Size (2026E) | US$ 640.6 Mn |
| Market Value Forecast (2033F) | US$ 1023.1 Mn |
| Projected Growth (CAGR 2026 to 2033) | 4.6% |
| Historical Market Growth (CAGR 2020 to 2025) | 5.9% |
Market Dynamics
Driver – Rising Spinal Cord Injury Burden & Advancements in Assistive Care Technologies
The North America quadriplegia care devices market is primarily driven by the sustained burden of spinal cord injuries (SCI) and the growing adoption of advanced assistive technologies that improve mobility, independence, and long-term quality of life. Traumatic events such as road accidents, falls, sports injuries, and workplace incidents remain the leading causes of cervical spinal cord damage, resulting in a steady inflow of quadriplegia cases across the U.S. and Canada. Aging demographics further compound demand, as elderly populations face higher risks of falls and degenerative spinal conditions requiring long-term assistive support.
Rapid technological innovation is transforming quadriplegia management. Powered wheelchairs, pressure relief systems, adaptive communication devices, and robotic assistive technologies are enabling greater autonomy, reduced caregiver dependency, and improved clinical outcomes. Integration of smart sensors, AI-driven mobility assistance, and digital health connectivity is enhancing real-time monitoring, posture management, and user-device interaction. Healthcare providers and rehabilitation centers increasingly emphasize early mobility intervention and continuous assistive care to prevent secondary complications such as pressure ulcers, respiratory issues, and muscle atrophy. These factors collectively strengthen demand for comprehensive quadriplegia care device portfolios across clinical, rehabilitation, and home-care settings in North America.
Restraints – High Device Costs & Reimbursement and Regulatory Constraints
The North America quadriplegia care devices market faces notable restraints related to high product costs, reimbursement limitations, and regulatory complexity. Advanced mobility devices, robotic assistive systems, and smart communication technologies often involve substantial upfront capital expenditure, making affordability a major challenge for patients and caregivers. While insurance coverage and public healthcare programs provide partial reimbursement, coverage inconsistencies across private insurers, Medicare, Medicaid, and provincial healthcare systems in Canada frequently result in high out-of-pocket expenses. This limits access, particularly for long-term and technologically advanced devices.
In addition, regulatory requirements governing medical device approvals, safety certifications, and clinical validation increase development timelines and compliance costs for manufacturers. Differences in regulatory pathways between the U.S. FDA and Health Canada further complicate cross-border commercialization and product standardization. Smaller manufacturers and technology innovators may face barriers to market entry due to stringent quality, documentation, and post-market surveillance requirements. Moreover, reimbursement approval delays can slow adoption even after regulatory clearance, restricting market penetration of innovative solutions. These combined financial and regulatory pressures can constrain purchasing decisions, delay technology upgrades, and moderate overall market growth despite rising clinical need
Opportunity – Growth of Home-Based Care Models & Intelligent Assistive Systems
The accelerating shift toward home-based and community-centered care models presents a significant growth opportunity for the North America quadriplegia care devices market. Healthcare systems increasingly prioritize reducing long-term hospital stays and institutional care costs by enabling patients to manage daily activities within home environments. This trend is driving demand for user-friendly, durable, and digitally connected assistive devices tailored for independent living. Home-compatible wheelchairs, pressure relief cushions, adaptive communication tools, and remote-monitoring-enabled devices are gaining traction among patients, caregivers, and payers seeking cost-effective long-term solutions.
Furthermore, advancements in intelligent assistive systems represent a key opportunity for market participants. The integration of robotics, artificial intelligence, voice recognition, and brain–computer interface technologies is reshaping quadriplegia care by enhancing mobility control, environmental interaction, and communication for severely impaired patients. Rehabilitation centers and specialized care providers are increasingly adopting robotic therapy and smart assistive platforms to support neuro-rehabilitation and functional recovery. Furthermore, growing investment in assistive technology research, public–private partnerships, and disability inclusion initiatives across North America is expected to accelerate innovation adoption. These trends collectively position advanced, personalized quadriplegia care devices as a high-growth opportunity over the long term.
Category-wise Analysis
By Product, Wheelchairs Dominate the North America Quadriplegia Care Devices Market
Wheelchairs lead the North America quadriplegia care devices market with an approximate 45.0% share in 2026, driven by their essential role in daily mobility, rehabilitation, and long-term care management for quadriplegic patients. Manual and powered wheelchairs remain the most widely adopted assistive devices across hospitals, rehabilitation centers, and home-care settings due to their versatility, affordability compared to advanced robotic systems, and suitability for a broad patient population. Continuous improvements in ergonomic design, pressure redistribution, powered mobility, and smart control features are enhancing user comfort and independence. In addition, expanding insurance coverage for mobility aids, growing emphasis on early mobility intervention, and rising preference for home-based care further support wheelchair adoption. Compared with high-cost assistive robots and specialized communication devices, wheelchairs offer scalable and practical mobility solutions across both urban and rural healthcare environments, reinforcing their dominant market position.
By Indication, Incomplete Quadriplegia Dominates the Market Due to Higher Patient Prevalence
Incomplete quadriplegia dominates the North America quadriplegia care devices market with a value share of 73.8%, primarily due to its significantly higher prevalence compared to complete quadriplegia. Patients with incomplete injuries often retain partial motor or sensory function, increasing demand for mobility aids, adaptive communication devices, and rehabilitation-focused assistive technologies aimed at maximizing functional recovery. The rising incidence of traumatic spinal cord injuries, combined with improved survival rates following accidents and falls, continues to expand this patient pool. Incomplete quadriplegia patients typically require a wider range of assistive devices over longer care durations, including wheelchairs, pressure relief solutions, and robotic rehabilitation tools, driving sustained device utilization and replacement demand across North America.
By End User, Hospitals Dominate the Market Due to Advanced Care Infrastructure
Hospitals account for the largest share of the North America quadriplegia care devices market, holding a value share of 24.0%, supported by their ability to deliver comprehensive acute and post-acute care. Hospitals serve as the primary point of diagnosis, surgical intervention, and early rehabilitation following spinal cord injuries, resulting in high utilization of mobility, monitoring, and supportive care devices. Advanced infrastructure, availability of multidisciplinary clinical teams, and access to high-end assistive technologies enable hospitals to manage complex quadriplegia cases effectively. Additionally, increasing trauma admissions, rising spinal surgery volumes, and the integration of early rehabilitation protocols continue to drive device demand within hospital settings across the region.
Country-wise Insights
U.S. Quadriplegia Care Devices Market Trends
The U.S. quadriplegia care devices market is witnessing steady momentum, driven largely by heightened emphasis on infection prevention, particularly in post-COVID clinical and long-term care environments, which is accelerating the uptake of automated and touch-free hygiene solutions. Growth in the aging population, along with the expansion of long-term care and rehabilitation facilities, is further supporting demand for assistive equipment such as patient lift systems and macerators. Concurrently, advancements in technology including AI-integrated and smart caregiving devices are improving patient safety, comfort, and caregiver productivity. However, stringent regulatory requirements and reimbursement limitations continue to influence purchasing decisions. In parallel, rising sustainability awareness is increasing interest in eco-friendly and reusable care solutions across healthcare settings.
Market Competitive Landscape
The North America quadriplegia care devices market is moderately competitive, with key players including Rewalk Robotic Rehab LLP., Ekso Bionics, Boston Scientific Corporation, Medtronic, and Rex Bionics Ltd. These companies focus on advancing mobility, rehabilitation, and supportive care technologies to enhance functional independence and quality of life for quadriplegic patients.
Market leaders emphasize product innovation in robotic exoskeletons, powered mobility systems, neuromodulation, and adaptive assistive devices, targeting both clinical and home-care settings. Strategic initiatives such as mergers and acquisitions, partnerships with rehabilitation providers, and geographic expansion across the U.S. and Canada are commonly adopted to strengthen market presence. Continued investment in R&D, regulatory alignment, and clinician training supports broader adoption of advanced quadriplegia care solutions and sustains competitive intensity across the region.
Key Industry Developments:
- In April 2025, ARC-EX, a rehabilitation device designed for individuals with spinal cord injuries, received FDA approval for clinical use in the United States, supported in part by research conducted at the KITE Research Institute. The approval marks an important advancement in spinal cord injury therapy, with KITE playing a key role in the development and validation of this new treatment approach.
- In January 2025, ONWARD Medical N.V. (Euronext: ONWD), a medical technology company focused on developing innovative spinal cord stimulation therapies to restore movement, function, and independence in individuals with spinal cord injury and other movement disorders, announced the first commercial sales of its ARC-EX System in the U.S
Companies Covered in North America Quadriplegia Care Devices Market
- Rewalk Robotic Rehab LLP.
- Ekso Bionics
- Boston Scientific Corporation
- Medtronic
- Rex Bionics Ltd.
- Össur
- Steeper Group
- Ottobock
- RGK Wheelchair
- AxioBionics
- ONWARD Medical N.V.
- Neuralink
- Others
Frequently Asked Questions
The North America quadriplegia care devices market is projected to be valued at US$ 640.6 Mn in 2026.
Rising spinal cord injury incidence, an aging population, and increasing adoption of advanced mobility and assistive technologies drive market growth in North America.
The North America quadriplegia care devices market is poised to witness a CAGR of 5.9% between 2026 and 2033.
Expanding home-based care, integration of robotics and smart assistive systems, and growing reimbursement support for advanced mobility devices present key opportunities.
Major players in the North America quadriplegia care devices market are Rewalk Robotic Rehab LLP., Ekso Bionics, Boston Scientific Corporation, Medtronic, and Rex Bionics Ltd.


