


- Executive Summary
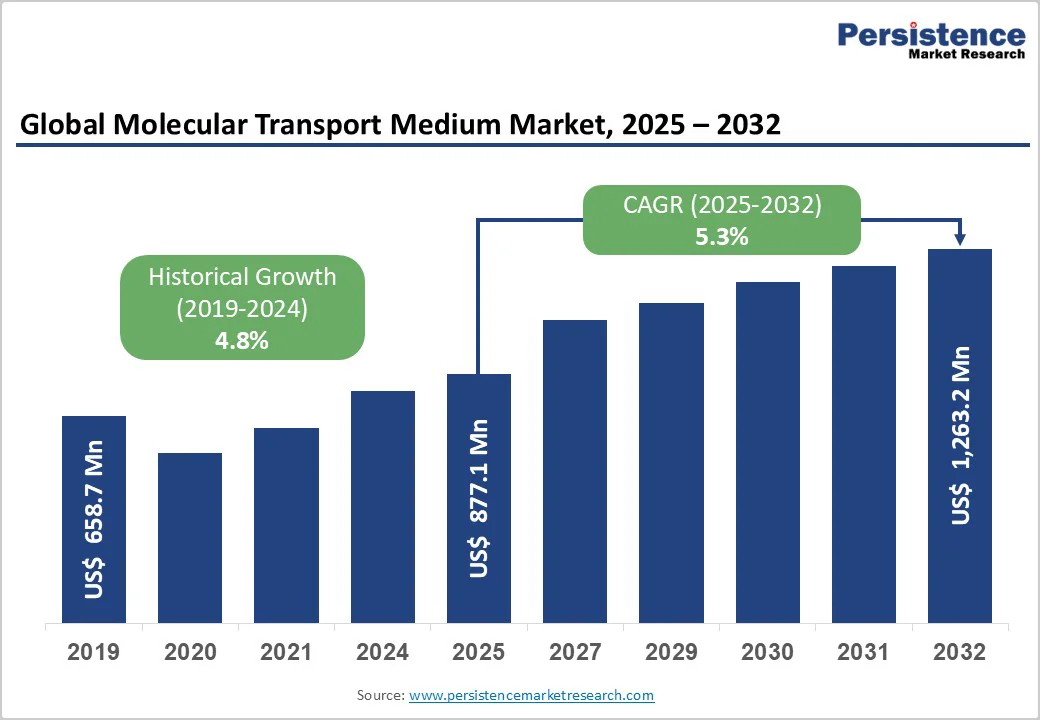
- Global Molecular Transport Medium Market Snapshot, 2025 and 2032
- Market Opportunity Assessment, 2025 - 2032, US$ Mn
- Key Market Trends
- Future Market Projections
- Premium Market Insights
- Industry Developments and Key Market Events
- PMR Analysis and Recommendations
- Market Overview
- Market Scope and Definition
- Market Dynamics
- Drivers
- Restraints
- Opportunity
- Challenges
- Key Trends
- Macro-Economic Factors
- Global Sectorial Outlook
- Global GDP Growth Outlook
- COVID-19 Impact Analysis
- Forecast Factors - Relevance and Impact
- Value Added Insights
- Product Adoption Analysis
- Regulatory Landscape
- Value Chain Analysis
- Key Deals and Mergers
- PESTLE Analysis
- Porter’s Five Force Analysis
- Global Molecular Transport Medium Market Outlook:
- Key Highlights
- Market Size (US$ Mn) and Y-o-Y Growth
- Absolute $ Opportunity
- Market Size (US$ Mn) Analysis and Forecast
- Historical Market Size (US$ Mn) Analysis, 2019-2024
- Market Size (US$ Mn) Analysis and Forecast, 2025-2032
- Global Molecular Transport Medium Market Outlook: Product Type
- Introduction / Key Findings
- Historical Market Size (US$ Mn) Analysis, By Product Type, 2019 - 2024
- Market Size (US$ Mn) Analysis and Forecast, By Product Type, 2025 - 2032
- Active Transport Medium
- Inactivated Transport Medium
- Market Attractiveness Analysis: Product Type
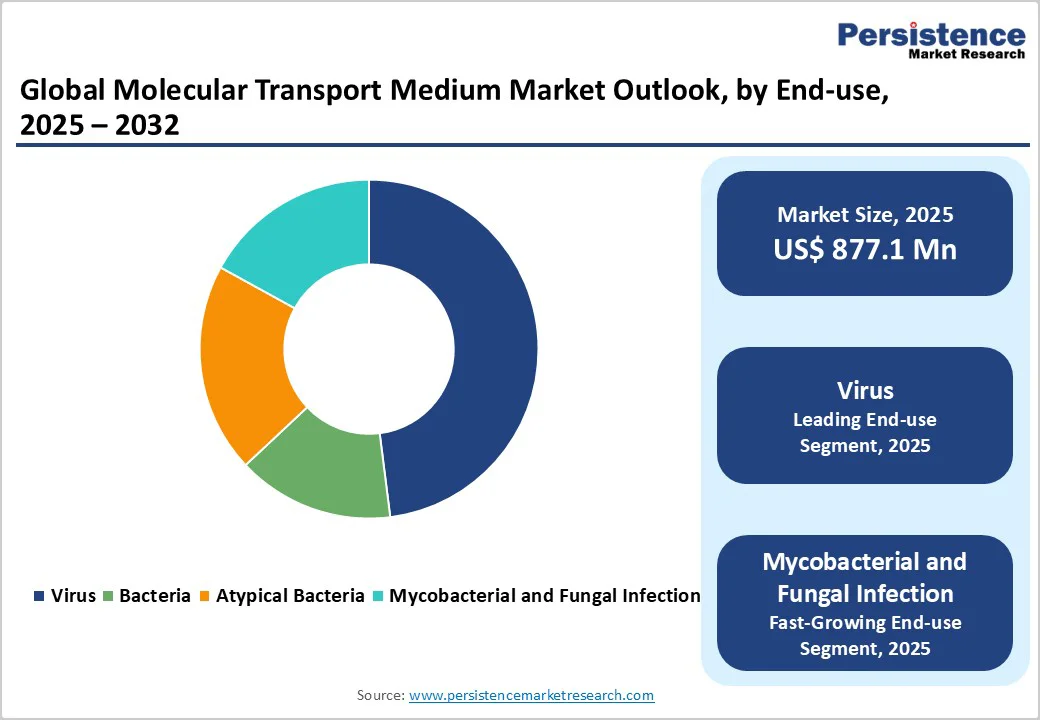
- Global Molecular Transport Medium Market Outlook: Application
- Introduction / Key Findings
- Historical Market Size (US$ Mn) Analysis, By Application, 2019 - 2024
- Market Size (US$ Mn) Analysis and Forecast, By Application, 2025 - 2032
- Virus
- COVID-19
- Middle East Respiratory Syndrome (MERS)
- Influenza
- Human Immunodeficiency Virus (HIV)
- Rhinovirus
- Adenovirus
- Respiratory Syncytial Virus (RSV)
- Bacteria
- Staphylococcus Pneumonia
- Haemophilus Influenza
- Anthrax
- Others
- Atypical Bacteria
- Mycoplasma
- Q-Fever
- Others
- Mycobacterial and Fungal Infection
- Virus
- Market Attractiveness Analysis: Application
- Global Molecular Transport Medium Market Outlook: Sample
- Introduction / Key Findings
- Historical Market Size (US$ Mn) Analysis, By Sample, 2019 - 2024
- Market Size (US$ Mn) Analysis and Forecast, By Sample, 2025 - 2032
- Nasal Washes and Swabs
- Sputum
- Saliva
- Faecal & Stool
- Urine
- Blood
- Tissues
- Others
- Market Attractiveness Analysis: Sample
- Global Molecular Transport Medium Market Outlook: End User
- Introduction / Key Findings
- Historical Market Size (US$ Mn) Analysis, By End User, 2019 - 2024
- Market Size (US$ Mn) Analysis and Forecast, By End User, 2025 - 2032
- Diagnostic Laboratories
- Microbiology Laboratories
- Hospitals & Clinics
- Others
- Market Attractiveness Analysis: End User
- Key Highlights
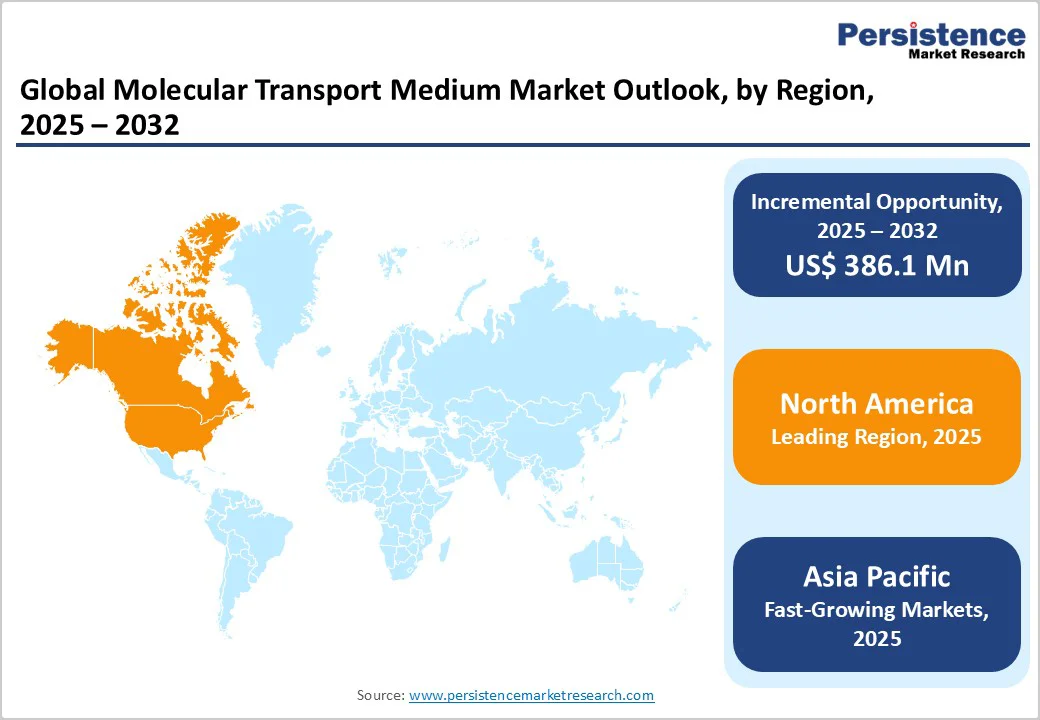
- Global Molecular Transport Medium Market Outlook: Region
- Key Highlights
- Historical Market Size (US$ Mn) Analysis, By Region, 2019 - 2024
- Market Size (US$ Mn) Analysis and Forecast, By Region, 2025 - 2032
- North America
- Europe
- East Asia
- South Asia and Oceania
- Latin America
- Middle East & Africa
- Market Attractiveness Analysis: Region
- North America Molecular Transport Medium Market Outlook:
- Key Highlights
- Historical Market Size (US$ Mn) Analysis, By Market, 2019 - 2024
- By Country
- By Product Type
- By Application
- By Sample
- By End User
- Market Size (US$ Mn) Analysis and Forecast, By Country, 2025 - 2032
- U.S.
- Canada
- Market Size (US$ Mn) Analysis and Forecast, By Product Type, 2025 - 2032
- Active Transport Medium
- Inactivated Transport Medium
- Market Size (US$ Mn) Analysis and Forecast, By Application, 2025 - 2032
- Virus
- COVID-19
- Middle East Respiratory Syndrome (MERS)
- Influenza
- Human Immunodeficiency Virus (HIV)
- Rhinovirus
- Adenovirus
- Respiratory Syncytial Virus (RSV)
- Bacteria
- Staphylococcus Pneumonia
- Haemophilus Influenza
- Anthrax
- Others
- Atypical Bacteria
- Mycoplasma
- Q-Fever
- Others
- Mycobacterial and Fungal Infection
- Virus
- Market Size (US$ Mn) Analysis and Forecast, By Sample, 2025 - 2032
- Nasal Washes and Swabs
- Sputum
- Saliva
- Faecal & Stool
- Urine
- Blood
- Tissues
- Others
- Market Size (US$ Mn) Analysis and Forecast, By End User, 2025 - 2032
- Diagnostic Laboratories
- Microbiology Laboratories
- Hospitals & Clinics
- Others
- Market Attractiveness Analysis
- Europe Molecular Transport Medium Market Outlook:
- Key Highlights
- Historical Market Size (US$ Mn) Analysis, By Market, 2019 - 2024
- By Country
- By Product Type
- By Application
- By Sample
- By End User
- Market Size (US$ Mn) Analysis and Forecast, By Country, 2025 - 2032
- Germany
- France
- U.K.
- Italy
- Spain
- Russia
- Türkiye
- Rest of Europe
- Market Size (US$ Mn) Analysis and Forecast, By Product Type, 2025 - 2032
- Active Transport Medium
- Inactivated Transport Medium
- Market Size (US$ Mn) Analysis and Forecast, By Application, 2025 - 2032
- Virus
- COVID-19
- Middle East Respiratory Syndrome (MERS)
- Influenza
- Human Immunodeficiency Virus (HIV)
- Rhinovirus
- Adenovirus
- Respiratory Syncytial Virus (RSV)
- Bacteria
- Staphylococcus Pneumonia
- Haemophilus Influenza
- Anthrax
- Others
- Atypical Bacteria
- Mycoplasma
- Q-Fever
- Others
- Mycobacterial and Fungal Infection
- Virus
- Market Size (US$ Mn) Analysis and Forecast, By Sample, 2025 - 2032
- Nasal Washes and Swabs
- Sputum
- Saliva
- Faecal & Stool
- Urine
- Blood
- Tissues
- Others
- Market Size (US$ Mn) Analysis and Forecast, By End User, 2025 - 2032
- Diagnostic Laboratories
- Microbiology Laboratories
- Hospitals & Clinics
- Others
- Market Attractiveness Analysis
- East Asia Molecular Transport Medium Market Outlook:
- Key Highlights
- Historical Market Size (US$ Mn) Analysis, By Market, 2019 - 2024
- By Country
- By Product Type
- By Application
- By Sample
- By End User
- Market Size (US$ Mn) Analysis and Forecast, By Country, 2025 - 2032
- China
- Japan
- South Korea
- Market Size (US$ Mn) Analysis and Forecast, By Product Type, 2025 - 2032
- Active Transport Medium
- Inactivated Transport Medium
- Market Size (US$ Mn) Analysis and Forecast, By Application, 2025 - 2032
- Virus
- COVID-19
- Middle East Respiratory Syndrome (MERS)
- Influenza
- Human Immunodeficiency Virus (HIV)
- Rhinovirus
- Adenovirus
- Respiratory Syncytial Virus (RSV)
- Bacteria
- Staphylococcus Pneumonia
- Haemophilus Influenza
- Anthrax
- Others
- Atypical Bacteria
- Mycoplasma
- Q-Fever
- Others
- Mycobacterial and Fungal Infection
- Virus
- Market Size (US$ Mn) Analysis and Forecast, By Sample, 2025 - 2032
- Nasal Washes and Swabs
- Sputum
- Saliva
- Faecal & Stool
- Urine
- Blood
- Tissues
- Others
- Market Size (US$ Mn) Analysis and Forecast, By End User, 2025 - 2032
- Diagnostic Laboratories
- Microbiology Laboratories
- Hospitals & Clinics
- Others
- Market Attractiveness Analysis
- South Asia & Oceania Molecular Transport Medium Market Outlook:
- Key Highlights
- Historical Market Size (US$ Mn) Analysis, By Market, 2019 - 2024
- By Country
- By Product Type
- By Application
- By Sample
- By End User
- Market Size (US$ Mn) Analysis and Forecast, By Country, 2025 - 2032
- India
- Southeast Asia
- ANZ
- Rest of South Asia & Oceania
- Market Size (US$ Mn) Analysis and Forecast, By Product Type, 2025 - 2032
- Active Transport Medium
- Inactivated Transport Medium
- Market Size (US$ Mn) Analysis and Forecast, By Application, 2025 - 2032
- Virus
- COVID-19
- Middle East Respiratory Syndrome (MERS)
- Influenza
- Human Immunodeficiency Virus (HIV)
- Rhinovirus
- Adenovirus
- Respiratory Syncytial Virus (RSV)
- Bacteria
- Staphylococcus Pneumonia
- Haemophilus Influenza
- Anthrax
- Others
- Atypical Bacteria
- Mycoplasma
- Q-Fever
- Others
- Mycobacterial and Fungal Infection
- Virus
- Market Size (US$ Mn) Analysis and Forecast, By Sample, 2025 - 2032
- Nasal Washes and Swabs
- Sputum
- Saliva
- Faecal & Stool
- Urine
- Blood
- Tissues
- Others
- Market Size (US$ Mn) Analysis and Forecast, By End User, 2025 - 2032
- Diagnostic Laboratories
- Microbiology Laboratories
- Hospitals & Clinics
- Others
- Market Attractiveness Analysis
- Latin America Molecular Transport Medium Market Outlook:
- Key Highlights
- Historical Market Size (US$ Mn) Analysis, By Market, 2019 - 2024
- By Country
- By Product Type
- By Application
- By Sample
- By End User
- Market Size (US$ Mn) Analysis and Forecast, By Country, 2025 - 2032
- Brazil
- Mexico
- Rest of Latin America
- Market Size (US$ Mn) Analysis and Forecast, By Product Type, 2025 - 2032
- Active Transport Medium
- Inactivated Transport Medium
- Market Size (US$ Mn) Analysis and Forecast, By Application, 2025 - 2032
- Virus
- COVID-19
- Middle East Respiratory Syndrome (MERS)
- Influenza
- Human Immunodeficiency Virus (HIV)
- Rhinovirus
- Adenovirus
- Respiratory Syncytial Virus (RSV)
- Bacteria
- Staphylococcus Pneumonia
- Haemophilus Influenza
- Anthrax
- Others
- Atypical Bacteria
- Mycoplasma
- Q-Fever
- Others
- Mycobacterial and Fungal Infection
- Virus
- Market Size (US$ Mn) Analysis and Forecast, By Sample, 2025 - 2032
- Nasal Washes and Swabs
- Sputum
- Saliva
- Faecal & Stool
- Urine
- Blood
- Tissues
- Others
- Market Size (US$ Mn) Analysis and Forecast, By End User, 2025 - 2032
- Diagnostic Laboratories
- Microbiology Laboratories
- Hospitals & Clinics
- Others
- Market Attractiveness Analysis
- Middle East & Africa Molecular Transport Medium Market Outlook:
- Key Highlights
- Historical Market Size (US$ Mn) Analysis, By Market, 2019 - 2024
- By Country
- By Product Type
- By Application
- By Sample
- By End User
- Market Size (US$ Mn) Analysis and Forecast, By Country, 2025 - 2032
- GCC Countries
- Egypt
- South Africa
- Northern Africa
- Rest of Middle East & Africa
- Market Size (US$ Mn) Analysis and Forecast, By Product Type, 2025 - 2032
- Active Transport Medium
- Inactivated Transport Medium
- Market Size (US$ Mn) Analysis and Forecast, By Application, 2025 - 2032
- Virus
- COVID-19
- Middle East Respiratory Syndrome (MERS)
- Influenza
- Human Immunodeficiency Virus (HIV)
- Rhinovirus
- Adenovirus
- Respiratory Syncytial Virus (RSV)
- Bacteria
- Staphylococcus Pneumonia
- Haemophilus Influenza
- Anthrax
- Others
- Atypical Bacteria
- Mycoplasma
- Q-Fever
- Others
- Mycobacterial and Fungal Infection
- Virus
- Market Size (US$ Mn) Analysis and Forecast, By Sample, 2025 - 2032
- Nasal Washes and Swabs
- Sputum
- Saliva
- Faecal & Stool
- Urine
- Blood
- Tissues
- Others
- Market Size (US$ Mn) Analysis and Forecast, By End User, 2025 - 2032
- Diagnostic Laboratories
- Microbiology Laboratories
- Hospitals & Clinics
- Others
- Market Attractiveness Analysis
- Competition Landscape
- Market Share Analysis, 2024
- Market Structure
- Competition Intensity Mapping By Market
- Competition Dashboard
- Company Profiles (Details - Overview, Financials, Strategy, Recent Developments)
- Thermo Fisher Scientific Inc.
- Overview
- Segments and Applications
- Key Financials
- Market Developments
- Market Strategy
- Becton, Dickinson, and Company
- Cardinal Health
- Quidel Corporation
- Medical Wire & Equipment
- COPAN Diagnostics Inc.
- Titan Biotech Ltd.
- Alpha Teknova, Inc. [former named Teknova]
- Bio-Genex Laboratories Inc.
- EKF Diagnostics
- Trinity Biotech
- Alpha-Tec Systems, Inc.
- Charm Sciences, Inc.
- Azer Scientific
- bioBoaVista
- AccuGene
- KSL Diagnostics
- Puritan Medical Products
- Amazing Biotech (Shanghai) Co., Ltd.
- Others
- Thermo Fisher Scientific Inc.
- Appendix
- Research Methodology
- Research Assumptions
- Acronyms and Abbreviations

Loading page data
Please wait a moment


