


- Executive Summary
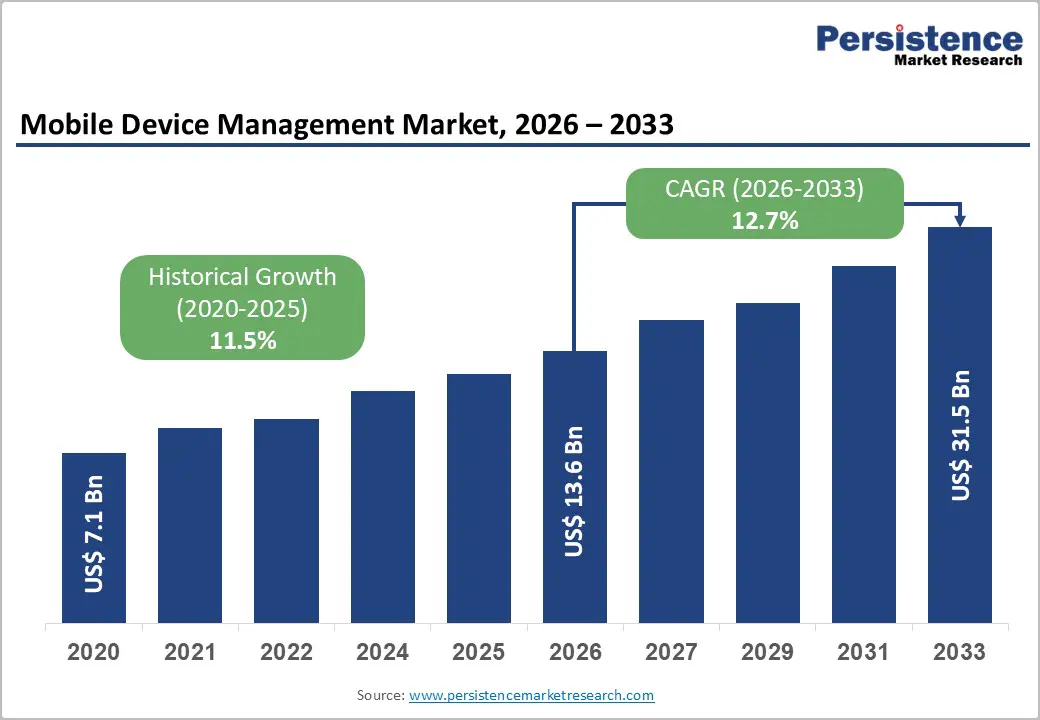
- Global Mobile Device Management Market Snapshot 2026 and 2033
- Market Opportunity Assessment, 2026-2033, US$ Bn
- Key Market Trends
- Industry Developments and Key Market Events
- Demand Side and Supply Side Analysis
- PMR Analysis and Recommendations
- Market Overview
- Market Scope and Definitions
- Value Chain Analysis
- Macro-Economic Factors
- Global GDP Outlook
- Enterprise Digital Transformation Overview
- BYOD and Mobile Workforce Trends Outlook
- Global Cloud Adoption and SaaS Proliferation
- Cybersecurity Threat Landscape
- Forecast Factors – Relevance and Impact
- COVID-19 Impact Assessment
- PESTLE Analysis
- Porter's Five Forces Analysis
- Geopolitical Tensions: Market Impact
- Regulatory and Technology Landscape
- Market Dynamics
- Drivers
- Restraints
- Opportunities
- Trends
- Price Trend Analysis, 2020 – 2033
- Region-wise Price Analysis
- Price by Segments
- Price Impact Factors
- Global Mobile Device Management Market Outlook: Historical (2020 – 2025) and Forecast (2026 – 2033)
- Key Highlights
- Global Mobile Device Management Market Outlook: Component
- Introduction/Key Findings
- Historical Market Size (US$ Bn) Analysis by Component, 2020-2025
- Current Market Size (US$ Bn) Forecast, by Component, 2026-2033
- Solution
- Services
- Market Attractiveness Analysis: Component
- Global Mobile Device Management Market Outlook: Deployment Model
- Introduction/Key Findings
- Historical Market Size (US$ Bn) Analysis by Deployment Model, 2020-2025
- Current Market Size (US$ Bn) Forecast, by Deployment Model, 2026-2033
- Cloud
- On-premise
- Market Attractiveness Analysis: Deployment Model
- Global Mobile Device Management Market Outlook: Enterprise Size
- Introduction/Key Findings
- Historical Market Size (US$ Bn) Analysis by Enterprise Size, 2020-2025
- Current Market Size (US$ Bn) Forecast, by Enterprise Size, 2026-2033
- Large Enterprises
- Small & Medium Enterprises
- Market Attractiveness Analysis: Enterprise Size
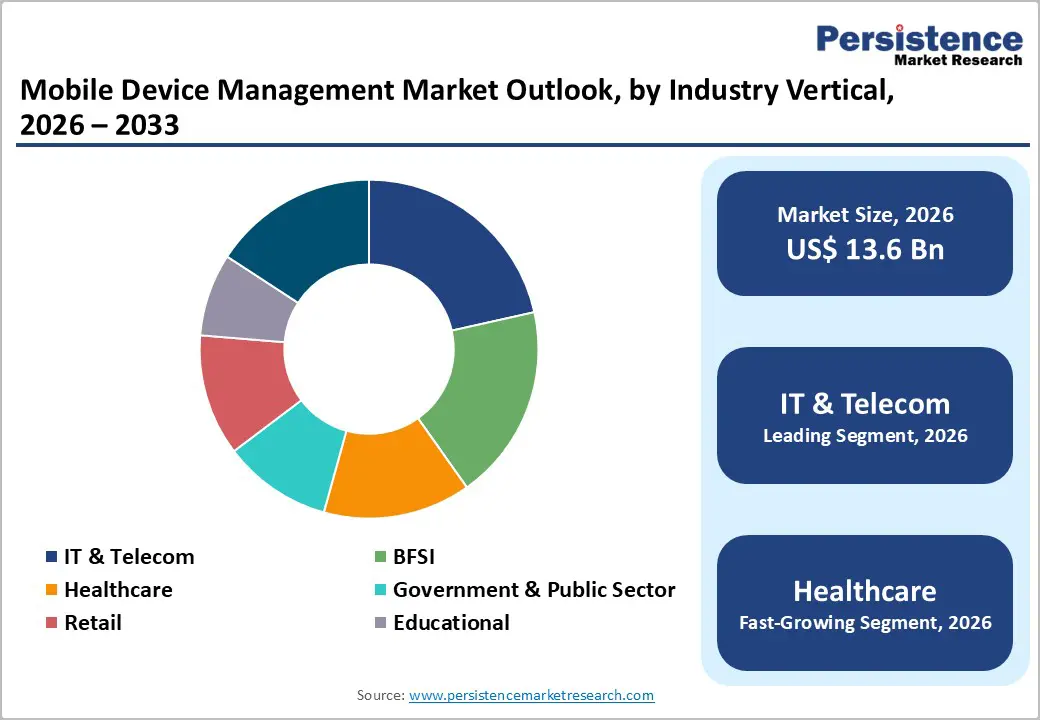
- Global Mobile Device Management Market Outlook: Industry Vertical
- Introduction/Key Findings
- Historical Market Size (US$ Bn) Analysis by Industry Vertical, 2020-2025
- Current Market Size (US$ Bn) Forecast, by Industry Vertical, 2026-2033
- BFSI
- Healthcare
- Government & Public Sector
- IT & Telecom
- Retail
- Educational
- Others
- Market Attractiveness Analysis: Industry Vertical
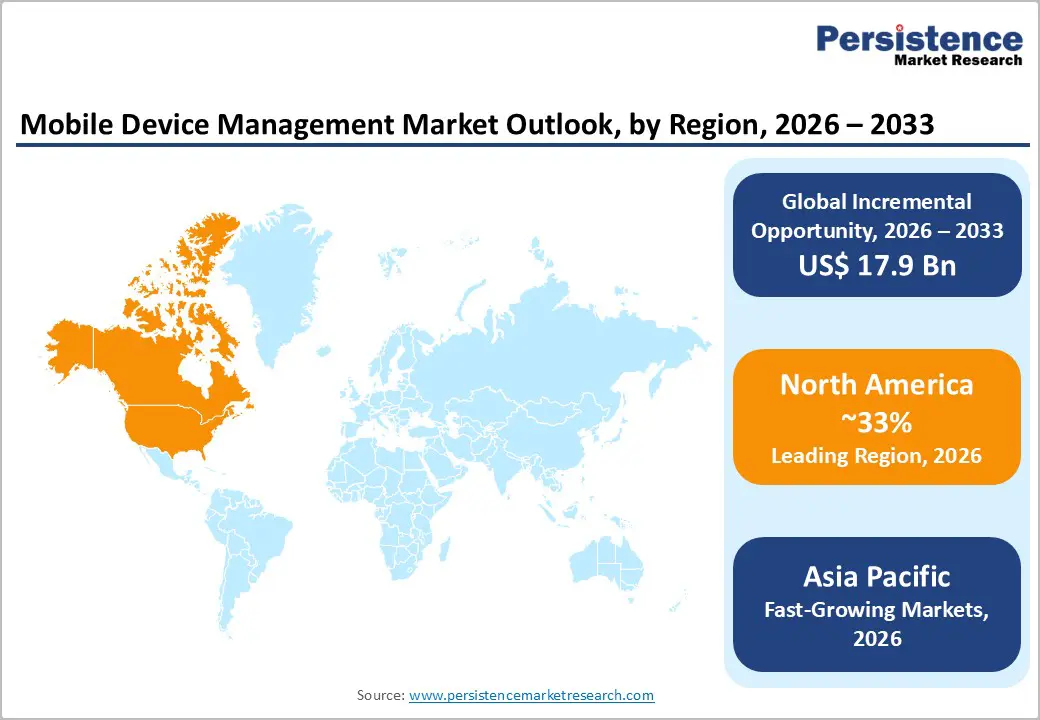
- Global Mobile Device Management Market Outlook: Region
- Key Highlights
- Historical Market Size (US$ Bn) Analysis by Region, 2020-2025
- Current Market Size (US$ Bn) Forecast, by Region, 2026-2033
- North America
- Europe
- East Asia
- South Asia & Oceania
- Latin America
- Middle East & Africa
- Market Attractiveness Analysis: Region
- North America Mobile Device Management Market Outlook: Historical (2020 – 2025) and Forecast (2026 – 2033)
- Key Highlights
- Pricing Analysis
- North America Market Size (US$ Bn) Forecast, by Country, 2026-2033
- U.S.
- Canada
- North America Market Size (US$ Bn) Forecast, by Component, 2026-2033
- Solution
- Services
- North America Market Size (US$ Bn) Forecast, by Deployment Model, 2026-2033
- Cloud
- On-premise
- North America Market Size (US$ Bn) Forecast, by Enterprise Size, 2026-2033
- Large Enterprises
- Small & Medium Enterprises
- North America Market Size (US$ Bn) Forecast, by Industry Vertical, 2026-2033
- BFSI
- Healthcare
- Government & Public Sector
- IT & Telecom
- Retail
- Educational
- Others
- Europe Mobile Device Management Market Outlook: Historical (2020 – 2025) and Forecast (2026 – 2033)
- Key Highlights
- Pricing Analysis
- Europe Market Size (US$ Bn) Forecast, by Country, 2026-2033
- Germany
- Italy
- France
- U.K.
- Spain
- Russia
- Rest of Europe
- Europe Market Size (US$ Bn) Forecast, by Component, 2026-2033
- Solution
- Services
- Europe Market Size (US$ Bn) Forecast, by Deployment Model, 2026-2033
- Cloud
- On-premise
- Europe Market Size (US$ Bn) Forecast, by Enterprise Size, 2026-2033
- Large Enterprises
- Small & Medium Enterprises
- Europe Market Size (US$ Bn) Forecast, by Industry Vertical, 2026-2033
- BFSI
- Healthcare
- Government & Public Sector
- IT & Telecom
- Retail
- Educational
- Others
- East Asia Mobile Device Management Market Outlook: Historical (2020 – 2025) and Forecast (2026 – 2033)
- Key Highlights
- Pricing Analysis
- East Asia Market Size (US$ Bn) Forecast, by Country, 2026-2033
- China
- Japan
- South Korea
- East Asia Market Size (US$ Bn) Forecast, by Component, 2026-2033
- Solution
- Services
- East Asia Market Size (US$ Bn) Forecast, by Deployment Model, 2026-2033
- Cloud
- On-premise
- East Asia Market Size (US$ Bn) Forecast, by Enterprise Size, 2026-2033
- Large Enterprises
- Small & Medium Enterprises
- East Asia Market Size (US$ Bn) Forecast, by Industry Vertical, 2026-2033
- BFSI
- Healthcare
- Government & Public Sector
- IT & Telecom
- Retail
- Educational
- Others
- South Asia & Oceania Mobile Device Management Market Outlook: Historical (2020 – 2025) and Forecast (2026 – 2033)
- Key Highlights
- Pricing Analysis
- South Asia & Oceania Market Size (US$ Bn) Forecast, by Country, 2026-2033
- India
- Southeast Asia
- ANZ
- Rest of SAO
- South Asia & Oceania Market Size (US$ Bn) Forecast, by Component, 2026-2033
- Solution
- Services
- South Asia & Oceania Market Size (US$ Bn) Forecast, by Deployment Model, 2026-2033
- Cloud
- On-premise
- South Asia & Oceania Market Size (US$ Bn) Forecast, by Enterprise Size, 2026-2033
- Large Enterprises
- Small & Medium Enterprises
- South Asia & Oceania Market Size (US$ Bn) Forecast, by Industry Vertical, 2026-2033
- BFSI
- Healthcare
- Government & Public Sector
- IT & Telecom
- Retail
- Educational
- Others
- Latin America Mobile Device Management Market Outlook: Historical (2020 – 2025) and Forecast (2026 – 2033)
- Key Highlights
- Pricing Analysis
- Latin America Market Size (US$ Bn) Forecast, by Country, 2026-2033
- Brazil
- Mexico
- Rest of LATAM
- Latin America Market Size (US$ Bn) Forecast, by Component, 2026-2033
- Solution
- Services
- Latin America Market Size (US$ Bn) Forecast, by Deployment Model, 2026-2033
- Cloud
- On-premise
- Latin America Market Size (US$ Bn) Forecast, by Enterprise Size, 2026-2033
- Large Enterprises
- Small & Medium Enterprises
- Latin America Market Size (US$ Bn) Forecast, by Industry Vertical, 2026-2033
- BFSI
- Healthcare
- Government & Public Sector
- IT & Telecom
- Retail
- Educational
- Others
- Middle East & Africa Mobile Device Management Market Outlook: Historical (2020 – 2025) and Forecast (2026 – 2033)
- Key Highlights
- Pricing Analysis
- Middle East & Africa Market Size (US$ Bn) Forecast, by Country, 2026-2033
- GCC Countries
- South Africa
- Northern Africa
- Rest of MEA
- Middle East & Africa Market Size (US$ Bn) Forecast, by Component, 2026-2033
- Solution
- Services
- Middle East & Africa Market Size (US$ Bn) Forecast, by Deployment Model, 2026-2033
- Cloud
- On-premise
- Middle East & Africa Market Size (US$ Bn) Forecast, by Enterprise Size, 2026-2033
- Large Enterprises
- Small & Medium Enterprises
- Middle East & Africa Market Size (US$ Bn) Forecast, by Industry Vertical, 2026-2033
- BFSI
- Healthcare
- Government & Public Sector
- IT & Telecom
- Retail
- Educational
- Others
- Competition Landscape
- Market Share Analysis, 2025
- Market Structure
- Competition Intensity Mapping
- Competition Dashboard
- Company Profiles
- Microsoft Corporation (Intune)
- Company Overview
- Product Portfolio/Offerings
- Key Financials
- SWOT Analysis
- Company Strategy and Key Developments
- VMware / Omnissa (Workspace ONE)
- IBM Corporation (MaaS360)
- Citrix Systems (Endpoint Management)
- BlackBerry Limited (UEM)
- Apple Inc. (Business Essentials / JAMF ecosystem)
- Samsung Electronics
- ManageEngine (Zoho Corporation)
- Google (Workspace / Android Enterprise)
- Ivanti (MobileIron – acquired)
- Broadcom (Symantec Division)
- Tanium
- NinjaOne
- CrowdStrike
- Microsoft Corporation (Intune)
- Appendix
- Research Methodology
- Research Assumptions
- Acronyms and Abbreviations

Loading page data
Please wait a moment


