

- Executive Summary
- Global Mobile Car Washing Market Snapshot 2026 and 2033
- Market Opportunity Assessment, 2026 - 2033, US$ Bn
- Key Market Trends
- Industry Developments and Key Market Events
- Demand Side and Supply Side Analysis
- PMR Analysis and Recommendations
- Market Overview
- Market Scope and Definitions
- Market Dynamics
- Driver
- Restraint
- Opportunities
- Trends
- Macro-Economic Factors
- Global GDP Outlook
- Global Prison Growth Outlook
- Global Crime Rates by Country
- Global Prison Population by Country
- Global Private Prison Market Growth Outlook
- Other Macro-economic Factors
- Forecast Factors - Relevance and Impact
- COVID-19 Impact Assessment
- Value Added Insights
- Value Chain analysis
- Key Market Players
- Product Adoption Analysis
- Key Promotional Strategies by key players
- PESTLE Analysis
- Porter's Five Forces Analysis
- Regulatory and Technology Landscape
- Price Trend Analysis, 2025
- Region-wise Price Analysis
- Price by Segments
- Price Impact Factors
- Global Mobile Car Washing Market Outlook: Historical (2020 - 2025) and Forecast (2026 - 2033)
- Key Highlights
- Global Mobile Car Washing Market Outlook: Service Type
- Introduction/Key Findings
- Historical Market Size (US$ Bn) and Volume (Units) Analysis by Service Type, 2020-2025
- Current Market Size (US$ Bn) and Volume (Units) Forecast, by Service Type, 2026-2033
- Standard Wash
- Premium Wash
- Waterless Wash
- Supreme Wash
- Deluxe Wash
- Others
- Market Attractiveness Analysis: Service Type
- Global Mobile Car Washing Market Outlook: Car Type
- Introduction/Key Findings
- Historical Market Size (US$ Bn) and Volume (Units) Analysis by Car Type, 2020-2025
- Current Market Size (US$ Bn) and Volume (Units) Forecast, by Car Type, 2026-2033
- Cars
- SUVs
- Big Trucks
- Market Attractiveness Analysis: Car Type
- Global Mobile Car Washing Market Outlook: Booking Type
- Introduction/Key Findings
- Historical Market Size (US$ Bn) and Volume (Units) Analysis by Booking Type, 2020-2025
- Current Market Size (US$ Bn) and Volume (Units) Forecast, by Booking Type, 2026-2033
- Phone Booking
- Online Booking
- Market Attractiveness Analysis: Booking Type
- Global Mobile Car Washing Market Outlook: Service Model
- Introduction/Key Findings
- Historical Market Size (US$ Bn) and Volume (Units) Analysis by Service Model, 2020-2025
- Current Market Size (US$ Bn) and Volume (Units) Forecast, by Service Model, 2026-2033
- One-time Wash
- Subscription-based Wash
- Market Attractiveness Analysis: Service Model
- Global Mobile Car Washing Market Outlook: Region
- Key Highlights
- Historical Market Size (US$ Bn) and Volume (Units) Analysis by Region, 2020-2025
- Current Market Size (US$ Bn) and Volume (Units) Forecast, by Region, 2026-2033
- North America
- Europe
- East Asia
- South Asia & Oceania
- Latin America
- Middle East & Africa
- Market Attractiveness Analysis: Region
- North America Mobile Car Washing Market Outlook: Historical (2020 - 2025) and Forecast (2026 - 2033)
- Key Highlights
- Pricing Analysis
- North America Market Size (US$ Bn) and Volume (Units) Forecast, by Country, 2026-2033
- U.S.
- Canada
- North America Market Size (US$ Bn) and Volume (Units) Forecast, by Service Type, 2026-2033
- Standard Wash
- Premium Wash
- Waterless Wash
- Supreme Wash
- Deluxe Wash
- Others
- North America Market Size (US$ Bn) and Volume (Units) Forecast, by Car Type, 2026-2033
- Cars
- SUVs
- Big Trucks
- North America Market Size (US$ Bn) and Volume (Units) Forecast, by Booking Type, 2026-2033
- Phone Booking
- Online Booking
- North America Market Size (US$ Bn) and Volume (Units) Forecast, by Service Model, 2026-2033
- One-time Wash
- Subscription-based Wash
- Europe Mobile Car Washing Market Outlook: Historical (2020 - 2025) and Forecast (2026 - 2033)
- Key Highlights
- Pricing Analysis
- Europe Market Size (US$ Bn) and Volume (Units) Forecast, by Country, 2026-2033
- Germany
- Italy
- France
- U.K.
- Spain
- Russia
- Rest of Europe
- Europe Market Size (US$ Bn) and Volume (Units) Forecast, by Service Type, 2026-2033
- Standard Wash
- Premium Wash
- Waterless Wash
- Supreme Wash
- Deluxe Wash
- Others
- Europe Market Size (US$ Bn) and Volume (Units) Forecast, by Car Type, 2026-2033
- Cars
- SUVs
- Big Trucks
- Europe Market Size (US$ Bn) and Volume (Units) Forecast, by Booking Type, 2026-2033
- Phone Booking
- Online Booking
- Europe Market Size (US$ Bn) and Volume (Units) Forecast, by Service Model, 2026-2033
- One-time Wash
- Subscription-based Wash
- East Asia Mobile Car Washing Market Outlook: Historical (2020 - 2025) and Forecast (2026 - 2033)
- Key Highlights
- Pricing Analysis
- East Asia Market Size (US$ Bn) and Volume (Units) Forecast, by Country, 2026-2033
- China
- Japan
- South Korea
- East Asia Market Size (US$ Bn) and Volume (Units) Forecast, by Service Type, 2026-2033
- Standard Wash
- Premium Wash
- Waterless Wash
- Supreme Wash
- Deluxe Wash
- Others
- East Asia Market Size (US$ Bn) and Volume (Units) Forecast, by Car Type, 2026-2033
- Cars
- SUVs
- Big Trucks
- East Asia Market Size (US$ Bn) and Volume (Units) Forecast, by Booking Type, 2026-2033
- Phone Booking
- Online Booking
- East Asia Market Size (US$ Bn) and Volume (Units) Forecast, by Service Model, 2026-2033
- One-time Wash
- Subscription-based Wash
- South Asia & Oceania Mobile Car Washing Market Outlook: Historical (2020 - 2025) and Forecast (2026 - 2033)
- Key Highlights
- Pricing Analysis
- South Asia & Oceania Market Size (US$ Bn) and Volume (Units) Forecast, by Country, 2026-2033
- India
- Southeast Asia
- ANZ
- Rest of SAO
- South Asia & Oceania Market Size (US$ Bn) and Volume (Units) Forecast, by Service Type, 2026-2033
- Standard Wash
- Premium Wash
- Waterless Wash
- Supreme Wash
- Deluxe Wash
- Others
- South Asia & Oceania Market Size (US$ Bn) and Volume (Units) Forecast, by Car Type, 2026-2033
- Cars
- SUVs
- Big Trucks
- South Asia & Oceania Market Size (US$ Bn) and Volume (Units) Forecast, by Booking Type, 2026-2033
- Phone Booking
- Online Booking
- South Asia & Oceania Market Size (US$ Bn) and Volume (Units) Forecast, by Service Model, 2026-2033
- One-time Wash
- Subscription-based Wash
- Latin America Mobile Car Washing Market Outlook: Historical (2020 - 2025) and Forecast (2026 - 2033)
- Key Highlights
- Pricing Analysis
- Latin America Market Size (US$ Bn) and Volume (Units) Forecast, by Country, 2026-2033
- Brazil
- Mexico
- Rest of LATAM
- Latin America Market Size (US$ Bn) and Volume (Units) Forecast, by Service Type, 2026-2033
- Standard Wash
- Premium Wash
- Waterless Wash
- Supreme Wash
- Deluxe Wash
- Others
- Latin America Market Size (US$ Bn) and Volume (Units) Forecast, by Car Type, 2026-2033
- Cars
- SUVs
- Big Trucks
- Latin America Market Size (US$ Bn) and Volume (Units) Forecast, by Booking Type, 2026-2033
- Phone Booking
- Online Booking
- Latin America Market Size (US$ Bn) and Volume (Units) Forecast, by Service Model, 2026-2033
- One-time Wash
- Subscription-based Wash
- Middle East & Africa Mobile Car Washing Market Outlook: Historical (2020 - 2025) and Forecast (2026 - 2033)
- Key Highlights
- Pricing Analysis
- Middle East & Africa Market Size (US$ Bn) and Volume (Units) Forecast, by Country, 2026-2033
- GCC Countries
- South Africa
- Northern Africa
- Rest of MEA
- Middle East & Africa Market Size (US$ Bn) and Volume (Units) Forecast, by Service Type, 2026-2033
- Standard Wash
- Premium Wash
- Waterless Wash
- Supreme Wash
- Deluxe Wash
- Others
- Middle East & Africa Market Size (US$ Bn) and Volume (Units) Forecast, by Car Type, 2026-2033
- Cars
- SUVs
- Big Trucks
- Middle East & Africa Market Size (US$ Bn) and Volume (Units) Forecast, by Booking Type, 2026-2033
- Phone Booking
- Online Booking
- Middle East & Africa Market Size (US$ Bn) and Volume (Units) Forecast, by Service Model, 2026-2033
- One-time Wash
- Subscription-based Wash
- Competition Landscape
- Market Share Analysis, 2025
- Market Structure
- Competition Intensity Mapping
- Competition Dashboard
- Company Profiles
- Spiffy, Inc.
- Company Overview
- Product Portfolio/Offerings
- Key Financials
- SWOT Analysis
- Company Strategy and Key Developments
- MobileWash
- Cozicars
- GoWashMyCar Ltd.
- Door2Door Car Wash
- Washos
- Mobile Car Wash
- Quickease LLC
- ProShine
- Green Salute
- Detailking Group
- Ecoclean
- Washé
- TechSquad
- Spiffy, Inc.
- Appendix
- Research Methodology
- Research Assumptions
- Acronyms and Abbreviations


- Retail
- Mobile Car Washing Market
Mobile Car Washing Market Size, Share, and Growth Forecast 2026 - 2033
Mobile Car Washing Market by Service Type (Standard Wash, Premium Wash, Waterless Wash, Supreme Wash, Deluxe Wash, Others), Car Type (Cars, SUVs, Big Trucks), Booking Type (Phone Booking, Online Booking), Service Model (One-time Wash, Subscription-based Wash), and Regional Analysis, 2026 - 2033
Mobile Car Washing Market Size and Trend Analysis
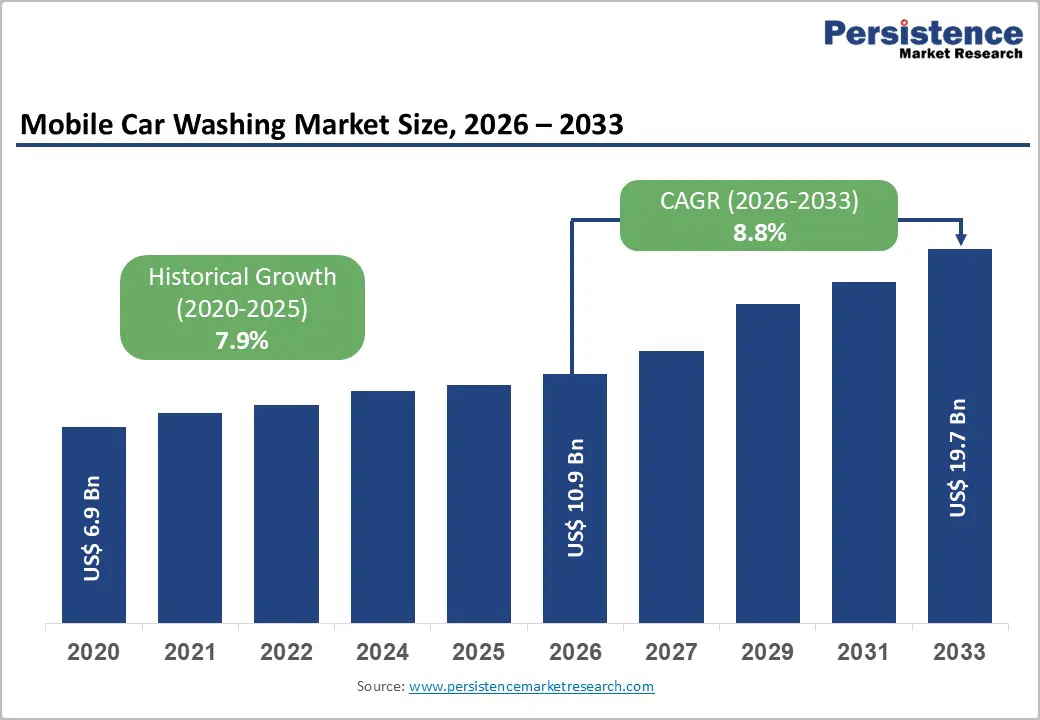
The global mobile car washing market size is expected to be valued at US$ 10.9 billion in 2026 and projected to reach US$ 19.7 billion by 2033, growing at a CAGR of 8.8% between 2026 and 2033. The market is driven by rising consumer demand for convenience, particularly among busy urban populations seeking time-saving solutions.
Increasing vehicle ownership, with over 92.5 million units produced globally in 2024 per OICA, fuels the need for mobile car wash services. Environmental awareness and regulations, such as EPA guidelines limiting water use to 35-40 gallons per vehicle, further boost adoption of eco-friendly mobile washing methods.
Key Industry Highlights:
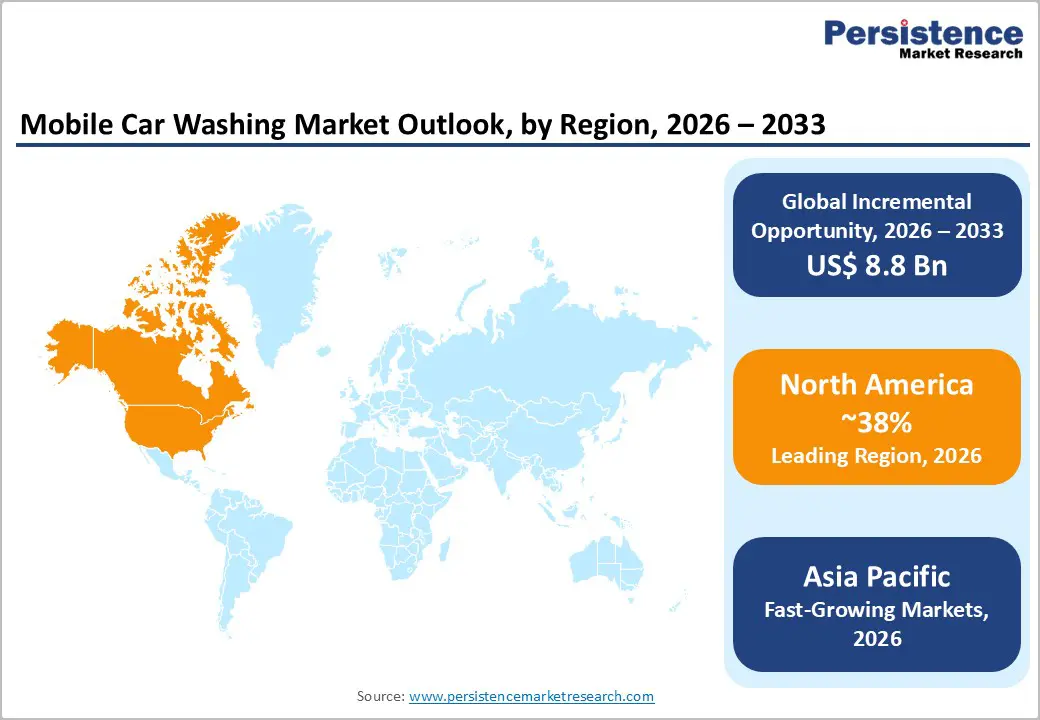
- Leading Region: North America leads the Mobile Car Washing market with a 38% share, driven by high U.S. vehicle density and strong demand for convenient doorstep services.
- Fastest-Growing Region: Asia Pacific is the fastest-growing region, holding a 30% share, fueled by rapid urbanization in China, India, Japan, and ASEAN nations.
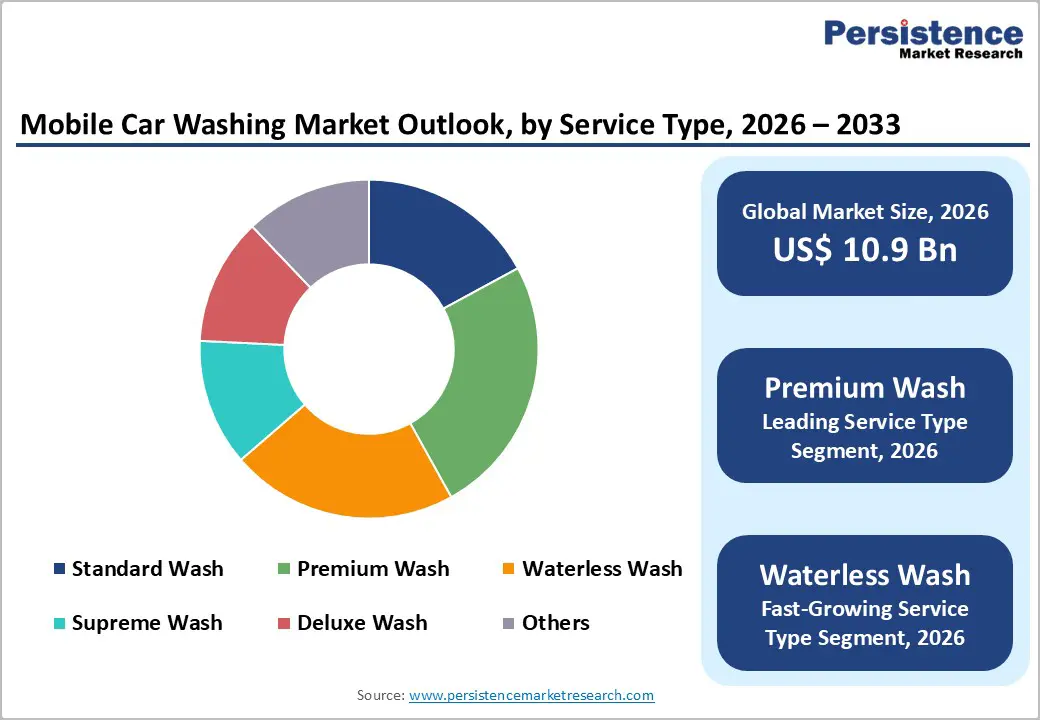
- Leading Service Category: Premium Wash dominates service types with a 35% share, driven by high-income users seeking urban vehicle protection and detailing.
- Fastest-Growing Booking Type: Online Booking leads with a 60% share, expanding rapidly due to app-based convenience and 85% smartphone penetration.
- Key Market Opportunity: Subscription-based services hold a 45% share and offer high retention, with fleets achieving 30% repeat usage for recurring mobile washes.
| Key Insights | Details |
|---|---|
| Mobile Car Washing Size (2026E) | US$ 10.9 billion |
| Market Value Forecast (2033F) | US$ 19.7 billion |
| Projected Growth CAGR (2026 - 2033) | 8.8% |
| Historical Market Growth (2020 - 2025) | 7.9% |
Market Dynamics
Driver - Rising Demand for Convenient and On-Demand Car Cleaning Services
Urbanization and fast-paced lifestyles are driving the demand for mobile car washing solutions. Busy professionals increasingly prefer on-demand, at-home services that save time and effort, particularly in North America, where high vehicle density and long commutes over 50 minutes in major U.S. cities per federal data create a strong need. The global vehicle base, exceeding 1 billion passenger cars according to OICA, further amplifies the market opportunity.
Gig economy platforms and mobile apps enhance service accessibility, allowing customers to schedule washes flexibly. This convenience encourages repeated usage and subscription adoption, contributing to significant market expansion. Rising urban service volumes reflect the growing consumer shift toward doorstep vehicle maintenance, positioning mobile car washing as a practical and efficient alternative to traditional wash stations.
Adoption of Eco-Friendly and Sustainable Mobile Car Wash Technologies
Environmental concerns and regulatory measures are accelerating the adoption of eco-friendly mobile car wash solutions. EPA and EU water regulations promote waterless methods, which consume 70-90% less water than conventional washes. In water-stressed regions such as California, adoption of sustainable washing practices surged 20% following 2023 policy changes.
Additionally, the use of biodegradable cleaning products aligns with millennial and Gen Z preferences, who represent roughly 40% of vehicle owners. These sustainability-focused approaches differentiate service providers, encouraging innovation in product formulations and operational techniques. As consumers increasingly prioritize environmental responsibility, mobile car wash operators integrating eco-friendly technologies are better positioned to capture market share and meet evolving regulatory and customer expectations.
Restraints - High Initial Investment Costs Limit New Entrants in Mobile Car Washing
Starting a mobile car washing business requires significant capital, with equipment and fleet setup ranging from US$ 50,000 to 100,000 per unit, according to small business benchmarks. These high upfront costs create barriers for independent operators and startups. Additionally, fuel price volatility fluctuating 20-30% annually per EIA data combined with ongoing maintenance expenses, increases operational risk and financial strain.
Such challenges contribute to higher business failure rates, with mobile operators experiencing roughly 25% more closures than fixed-site car wash locations. The need for reliable, specialized equipment and vehicles further adds to initial costs, making it difficult for smaller players to scale efficiently and compete with established service providers offering broader coverage and professional-grade fleets.
Regulatory Compliance Challenges Increase Operational Complexity and Costs
Mobile car wash operators face stringent regulatory requirements that affect both cost and expansion. Wastewater management rules, such as EPA permits in the U.S. and EU REACH directives, increase compliance costs by 15-20%, while fines for violations can reach millions, as seen in 2024 enforcement cases.
Multi-location service models encounter zoning restrictions and permitting hurdles, slowing rollout and reducing profitability. Operators must invest in specialized treatment systems and staff training to meet environmental standards. These regulatory pressures increase barriers to entry and operational complexity, requiring careful planning to balance growth ambitions with adherence to legal and environmental obligations.
Opportunity - Expansion into Subscription-Based Mobile Car Washing Services
Subscription models are emerging as a key growth opportunity, mirroring the success seen in ride-sharing platforms. ICA reports indicate 77% customer satisfaction and a 30% increase in retention when users opt for recurring services. Fleet operators, particularly in ride-share and delivery sectors with millions of vehicles, represent a high-volume customer base for subscription offerings.
Incentives in markets like the U.S. for regular eco-friendly cleans further enhance adoption. By providing predictable revenue streams and convenience, subscription-based models allow providers to strengthen customer loyalty, optimize scheduling, and scale operations efficiently. This approach aligns with evolving consumer behavior favoring hassle-free, recurring service solutions for both individual and commercial vehicle segments.
Growth in Waterless Technologies and Digital Booking Platforms
Waterless mobile car wash technologies and online booking platforms present significant growth avenues. In water-scarce regions, such as Australia, waterless methods reduce consumption by up to 90%, offering both environmental and cost advantages. Meanwhile, digital platforms supporting online bookings are growing at an 11.3% CAGR, supported by 85% smartphone penetration per Pew Research.
Targeting urban fleets and tech-savvy individual customers, these solutions enable providers to increase operational efficiency, minimize environmental impact, and expand service reach. The combination of eco-friendly cleaning and convenient app-based scheduling positions operators to achieve double-digit growth in competitive urban markets.
Category-wise Analysis
Service Type Insights
Premium Wash emerges as the leading service type in the mobile car washing market, capturing a 35% share in 2025. Favored by high-income users seeking detailed cleaning and long-term vehicle protection, it offers superior satisfaction, with ICA data reporting 22% higher approval compared to standard washes. Urban pollution levels, such as in Los Angeles where air quality exceeds WHO limits by 50%, further drive demand for thorough exterior and interior care. Premium Wash services often include waxing, polishing, and protective coatings, appealing to consumers prioritizing vehicle aesthetics and longevity.
Waterless and eco-friendly wash services are among the fastest-growing segments. Driven by environmental awareness and regulatory initiatives, these solutions use minimal water, reduce chemical runoff, and attract environmentally conscious users. Adoption is particularly strong in urban and water-stressed regions, where customers prefer sustainable options over traditional methods. Service providers offering these innovative solutions differentiate themselves while expanding reach among millennial and Gen Z vehicle owners.
Car Type Analysis
Passenger cars dominate the mobile car washing market, holding a 55% share in 2025. Representing 75% of the global fleet according to OICA, their compact size and prevalence make them ideal for urban mobile wash services. In the U.S., over 40 million commuters rely on passenger cars, creating consistent demand for at-home cleaning solutions. Cars’ accessibility allows operators to service high-density urban areas efficiently, while frequent use ensures recurring revenue opportunities for providers targeting individual vehicle owners.
SUVs and larger commercial vehicles are among the fastest-growing segments. With increasing fleet ownership for deliveries and ride-sharing, service providers see high-volume demand for these vehicle types. Operators are expanding offerings to accommodate size, cleaning complexity, and premium care needs, targeting both individual and commercial customers in urban and suburban regions.
Booking Type Insights
Online Booking dominates mobile car wash services, accounting for 60% of bookings in 2025. Fueled by app-based platforms and 85% smartphone penetration per Pew Research, digital channels provide convenience, real-time scheduling, and easy payment options. Google Trends data shows a 40% surge in online booking interest in 2024, reflecting consumer preference for digital tracking and service management. Urban professionals and tech-savvy users increasingly choose online channels over phone bookings, driving market efficiency and repeat usage.
Phone bookings are among the fastest-growing segments in certain emerging markets. While online adoption is high, traditional phone-based booking remains relevant for older demographics or regions with lower smartphone penetration. Operators offering hybrid booking options can capture both digitally inclined users and those relying on personal interaction, ensuring broader market coverage and customer retention.
Service Model Insights
Subscription-based mobile car washing services lead with a 45% share in 2025. ICA data indicates these plans deliver 28% cost savings and attract 66% frequent users, averaging 13+ washes per year. Fleet operators, including delivery and ride-sharing vehicles, prefer subscriptions for reliability and convenience. Recurring service models allow providers to optimize scheduling, reduce idle time, and strengthen customer loyalty, while users benefit from predictable costs and consistent maintenance for their vehicles.
One-time wash services are among the fastest-growing segments, appealing to customers seeking flexibility and occasional cleaning. This model attracts individuals who prefer pay-per-use options without long-term commitments. Providers offering both subscription and one-time services can capture diverse consumer segments, from high-frequency users to occasional clients, expanding market reach and maximizing revenue potential.
Regional Insights
North America Mobile Car Washing Market Trends and Insights
North America leads the mobile car washing market, capturing a 38% share in 2025. High vehicle ownership, particularly in the U.S. with 286 cars per 1,000 people (FHWA), drives consistent demand. Environmental regulations, such as EPA water usage limits, promote adoption of eco-friendly mobile solutions, with California alone reporting a 20% growth in mobile wash services in 2024. Innovation hubs like Silicon Valley further accelerate app-based bookings and tech-enabled service delivery, creating a mature and digitally advanced market.
Urban population density and busy lifestyles enhance the appeal of doorstep services, supporting subscription-based and premium offerings. The U.S. remains the largest contributor within the region, while Canada and Mexico also show steady growth due to rising awareness of convenience, sustainability, and digital scheduling options.
Europe Mobile Car Washing Market Trends and Insights
Europe’s mobile car washing market emphasizes eco-friendly and low-water solutions, driven by EU Directive 2000/60/EC harmonization. Germany, the UK, France, and Spain collectively account for a vehicle base of 50 million cars. The UK’s post-Brexit regulatory flexibility enabled a 10% growth in mobile services in 2025, while environmental initiatives across France and Spain encourage sustainable cleaning practices.
The region is projected to grow at a CAGR of 7.2% through 2033, supported by rising urbanization, environmental awareness, and digital adoption. Subscription models, app-based bookings, and premium eco-friendly services are increasingly popular, with operators targeting dense metropolitan areas to maximize operational efficiency and customer retention.
Asia Pacific Mobile Car Washing Market Trends and Insights
Asia Pacific holds a significant 30% share of the global mobile car washing market in 2025, emerging as the fastest-growing region. Rapid urbanization in China, India, Japan, and ASEAN nations is driving demand, with China alone accounting for over 300 million vehicles (MIIT). India’s Clean Air Programme encourages waterless and eco-friendly solutions, while Japan’s environmental initiatives have spurred the adoption of sustainable mobile services.
Increasing vehicle ownership, congested city conditions, and the rise of fleet operators and ride-share vehicles make mobile and app-based services highly attractive. Premium and subscription-based models are gaining popularity among individual and commercial users. Investments in digital platforms, eco-friendly technologies, and urban-targeted marketing enable providers to capture a growing share of the region’s expanding market.
Competitive Landscape
The mobile car washing market is highly fragmented, dominated by numerous local operators alongside smaller chains. Market leaders focus on expansion through franchising and digital platforms, leveraging app-based booking systems to reach wider audiences. Innovation in cleaning technologies, such as steam and waterless methods, helps differentiate services and attract environmentally conscious customers, while maintaining high service quality.
Service differentiation also comes from subscription offerings, eco-friendly certifications, and premium care packages. Emerging gig-economy models further enhance flexibility, allowing providers to scale quickly and cater to on-demand consumer preferences, making competition increasingly dynamic and innovation-driven.
Key Developments:
- In March 2025, MobileWash expanded its operations across the U.S., forming strategic partnerships with Walmart to enhance service accessibility and reach a broader consumer base through in-store promotions and app-based booking integration.
- In July 2024, Washos implemented AI-powered routing in California, improving service efficiency and reducing travel times by 30%, enabling faster vehicle turnaround and optimizing operational logistics for mobile car wash crews.
- In November 2024, Spiffy secured $20 million in funding to scale its mobile car washing services for electric vehicle fleets, supporting specialized cleaning solutions and expanding coverage in urban and commercial EV markets.
Companies Covered in Mobile Car Washing Market
- Spiffy, Inc.
- MobileWash
- Cozicars
- GoWashMyCar Ltd.
- Door2Door Car Wash
- Washos
- Mobile Car Wash
- Quickease LLC
- ProShine
- Green Salute
- Detailking Group
- Ecoclean
- Washé
- TechSquad
Frequently Asked Questions
The mobile car washing market is projected at US$ 10.9 billion, driven by on-demand convenience.
High urban vehicle ownership and busy lifestyles drive strong demand.
North America leads with a 38% share, boosted by U.S. vehicle density and EPA rules.
Subscription-based services hold a 45% share, offering 30% retention for fleets.
The key players in the mobile car washing market are Spiffy, Inc., MobileWash, Cozicars, GoWashMyCar Ltd., and Door2Door Car Wash.


