

- Executive Summary
- Global Managed Security Services Market Snapshot 2026 and 2033
- Market Opportunity Assessment, 2026-2033, US$ Bn
- Key Market Trends
- Industry Developments and Key Market Events
- Demand Side and Supply Side Analysis
- PMR Analysis and Recommendations
- Market Overview
- Market Scope and Definitions
- Value Chain Analysis
- Macro-Economic Factors
- Global GDP Outlook
- Global Healthcare Industry Overview
- Global BFSI Industry Overview
- Forecast Factors – Relevance and Impact
- COVID-19 Impact Assessment
- PESTLE Analysis
- Porter's Five Forces Analysis
- Geopolitical Tensions: Market Impact
- Regulatory and Technology Landscape
- Market Dynamics
- Drivers
- Restraints
- Opportunities
- Trends
- Price Trend Analysis, 2020 – 2033
- Region-wise Price Analysis
- Price by Segments
- Price Impact Factors
- Global Managed Security Services Market Outlook: Historical (2020 – 2025) and Forecast (2026 – 2033)
- Key Highlights
- Global Managed Security Services Market Outlook: By Service Type
- Introduction/Key Findings
- Historical Market Size (US$ Bn) Analysis by By Service Type, 2020-2025
- Current Market Size (US$ Bn) Forecast, by By Service Type, 2026-2033
- Fully Managed Security Services
- Co-managed Security Services
- Market Attractiveness Analysis: By Service Type
- Global Managed Security Services Market Outlook: By Organization Size
- Introduction/Key Findings
- Historical Market Size (US$ Bn) Analysis by By Organization Size, 2020-2025
- Current Market Size (US$ Bn) Forecast, by By Organization Size, 2026-2033
- Large Enterprises
- SMEs
- Market Attractiveness Analysis: By Organization Size
- Global Managed Security Services Market Outlook: By Service Type
- Introduction/Key Findings
- Historical Market Size (US$ Bn) Analysis by By Service Type, 2020-2025
- Current Market Size (US$ Bn) Forecast, by By Service Type, 2026-2033
- Managed Network & Perimeter Security Services
- Managed Endpoint & Application Security Services
- Managed Cloud Security Services
- Managed Security Operations & Monitoring Services
- Managed Advanced Threat Detection Services
- Others
- Market Attractiveness Analysis: By Service Type
- Global Managed Security Services Market Outlook: By End Use
- Introduction/Key Findings
- Historical Market Size (US$ Bn) Analysis by By End Use, 2020-2025
- Current Market Size (US$ Bn) Forecast, by By End Use, 2026-2033
- BFSI
- Government
- Healthcare & Life Sciences
- Telecommunications
- IR & ITeS
- Retail & e-Commerce
- Energy & Utilities
- Manufacturing
- Market Attractiveness Analysis: By End Use
- Global Managed Security Services Market Outlook: Region
- Key Highlights
- Historical Market Size (US$ Bn) Analysis by Region, 2020-2025
- Current Market Size (US$ Bn) Forecast, by Region, 2026-2033
- North America
- Europe
- East Asia
- South Asia & Oceania
- Latin America
- Middle East & Africa
- Market Attractiveness Analysis: Region
- North America Managed Security Services Market Outlook: Historical (2020 – 2025) and Forecast (2026 – 2033)
- Key Highlights
- Pricing Analysis
- North America Market Size (US$ Bn) Forecast, by Country, 2026-2033
- U.S.
- Canada
- North America Market Size (US$ Bn) Forecast, by By Service Type, 2026-2033
- Fully Managed Security Services
- Co-managed Security Services
- North America Market Size (US$ Bn) Forecast, by By Organization Size, 2026-2033
- Large Enterprises
- SMEs
- North America Market Size (US$ Bn) Forecast, by By Service Type, 2026-2033
- Managed Network & Perimeter Security Services
- Managed Endpoint & Application Security Services
- Managed Cloud Security Services
- Managed Security Operations & Monitoring Services
- Managed Advanced Threat Detection Services
- Others
- North America Market Size (US$ Bn) Forecast, by By End Use, 2026-2033
- BFSI
- Government
- Healthcare & Life Sciences
- Telecommunications
- IR & ITeS
- Retail & e-Commerce
- Energy & Utilities
- Manufacturing
- Europe Managed Security Services Market Outlook: Historical (2020 – 2025) and Forecast (2026 – 2033)
- Key Highlights
- Pricing Analysis
- Europe Market Size (US$ Bn) Forecast, by Country, 2026-2033
- Germany
- Italy
- France
- U.K.
- Spain
- Russia
- Rest of Europe
- Europe Market Size (US$ Bn) Forecast, by By Service Type, 2026-2033
- Fully Managed Security Services
- Co-managed Security Services
- Europe Market Size (US$ Bn) Forecast, by By Organization Size, 2026-2033
- Large Enterprises
- SMEs
- Europe Market Size (US$ Bn) Forecast, by By Service Type, 2026-2033
- Managed Network & Perimeter Security Services
- Managed Endpoint & Application Security Services
- Managed Cloud Security Services
- Managed Security Operations & Monitoring Services
- Managed Advanced Threat Detection Services
- Others
- Europe Market Size (US$ Bn) Forecast, by By End Use, 2026-2033
- BFSI
- Government
- Healthcare & Life Sciences
- Telecommunications
- IR & ITeS
- Retail & e-Commerce
- Energy & Utilities
- Manufacturing
- East Asia Managed Security Services Market Outlook: Historical (2020 – 2025) and Forecast (2026 – 2033)
- Key Highlights
- Pricing Analysis
- East Asia Market Size (US$ Bn) Forecast, by Country, 2026-2033
- China
- Japan
- South Korea
- East Asia Market Size (US$ Bn) Forecast, by By Service Type, 2026-2033
- Fully Managed Security Services
- Co-managed Security Services
- East Asia Market Size (US$ Bn) Forecast, by By Organization Size, 2026-2033
- Large Enterprises
- SMEs
- East Asia Market Size (US$ Bn) Forecast, by By Service Type, 2026-2033
- Managed Network & Perimeter Security Services
- Managed Endpoint & Application Security Services
- Managed Cloud Security Services
- Managed Security Operations & Monitoring Services
- Managed Advanced Threat Detection Services
- Others
- East Asia Market Size (US$ Bn) Forecast, by By End Use, 2026-2033
- BFSI
- Government
- Healthcare & Life Sciences
- Telecommunications
- IR & ITeS
- Retail & e-Commerce
- Energy & Utilities
- Manufacturing
- South Asia & Oceania Managed Security Services Market Outlook: Historical (2020 – 2025) and Forecast (2026 – 2033)
- Key Highlights
- Pricing Analysis
- South Asia & Oceania Market Size (US$ Bn) Forecast, by Country, 2026-2033
- India
- Southeast Asia
- ANZ
- Rest of SAO
- South Asia & Oceania Market Size (US$ Bn) Forecast, by By Service Type, 2026-2033
- Fully Managed Security Services
- Co-managed Security Services
- South Asia & Oceania Market Size (US$ Bn) Forecast, by By Organization Size, 2026-2033
- Large Enterprises
- SMEs
- South Asia & Oceania Market Size (US$ Bn) Forecast, by By Service Type, 2026-2033
- Managed Network & Perimeter Security Services
- Managed Endpoint & Application Security Services
- Managed Cloud Security Services
- Managed Security Operations & Monitoring Services
- Managed Advanced Threat Detection Services
- Others
- South Asia & Oceania Market Size (US$ Bn) Forecast, by By End Use, 2026-2033
- BFSI
- Government
- Healthcare & Life Sciences
- Telecommunications
- IR & ITeS
- Retail & e-Commerce
- Energy & Utilities
- Manufacturing
- Latin America Managed Security Services Market Outlook: Historical (2020 – 2025) and Forecast (2026 – 2033)
- Key Highlights
- Pricing Analysis
- Latin America Market Size (US$ Bn) Forecast, by Country, 2026-2033
- Brazil
- Mexico
- Rest of LATAM
- Latin America Market Size (US$ Bn) Forecast, by By Service Type, 2026-2033
- Fully Managed Security Services
- Co-managed Security Services
- Latin America Market Size (US$ Bn) Forecast, by By Organization Size, 2026-2033
- Large Enterprises
- SMEs
- Latin America Market Size (US$ Bn) Forecast, by By Service Type, 2026-2033
- Managed Network & Perimeter Security Services
- Managed Endpoint & Application Security Services
- Managed Cloud Security Services
- Managed Security Operations & Monitoring Services
- Managed Advanced Threat Detection Services
- Others
- Latin America Market Size (US$ Bn) Forecast, by By End Use, 2026-2033
- BFSI
- Government
- Healthcare & Life Sciences
- Telecommunications
- IR & ITeS
- Retail & e-Commerce
- Energy & Utilities
- Manufacturing
- Middle East & Africa Managed Security Services Market Outlook: Historical (2020 – 2025) and Forecast (2026 – 2033)
- Key Highlights
- Pricing Analysis
- Middle East & Africa Market Size (US$ Bn) Forecast, by Country, 2026-2033
- GCC Countries
- South Africa
- Northern Africa
- Rest of MEA
- Middle East & Africa Market Size (US$ Bn) Forecast, by By Service Type, 2026-2033
- Fully Managed Security Services
- Co-managed Security Services
- Middle East & Africa Market Size (US$ Bn) Forecast, by By Organization Size, 2026-2033
- Large Enterprises
- SMEs
- Middle East & Africa Market Size (US$ Bn) Forecast, by By Service Type, 2026-2033
- Managed Network & Perimeter Security Services
- Managed Endpoint & Application Security Services
- Managed Cloud Security Services
- Managed Security Operations & Monitoring Services
- Managed Advanced Threat Detection Services
- Others
- Middle East & Africa Market Size (US$ Bn) Forecast, by By End Use, 2026-2033
- BFSI
- Government
- Healthcare & Life Sciences
- Telecommunications
- IR & ITeS
- Retail & e-Commerce
- Energy & Utilities
- Manufacturing
- Competition Landscape
- Market Share Analysis, 2025
- Market Structure
- Competition Intensity Mapping
- Competition Dashboard
- Company Profiles
- AT&T
- Company Overview
- Product Portfolio/Offerings
- Key Financials
- SWOT Analysis
- Company Strategy and Key Developments
- BAE Systems, Inc.
- Cisco
- Check Point Software Technologies
- Fortinet, Inc.
- Fujitsu
- IBM
- Palo Alto Networks
- Rapid 7
- Verizon
- Wipro
- NTT
- LevelBlue
- Accenture
- DXC Technology
- AT&T
- Appendix
- Research Methodology
- Research Assumptions
- Acronyms and Abbreviations


- Testing, Inspection, & Certification
- Managed Security Services Market
Managed Security Services Market Size, Share, and Growth Forecast 2026 – 2033
Managed Security Services Market Size, Share, and Growth Forecast 2026 – 2033 by Service Type (Managed Network & Perimeter Security Services, Managed Endpoint & Application Security Services, Managed Cloud Security Services, Managed Security Operations & Monitoring Services, Managed Advanced Threat Detection Services, Others), by Operation Mode, by Organization Size, by End Use, by Regional Analysis, 2026–2033
Managed Security Services Market Size and Trend Analysis
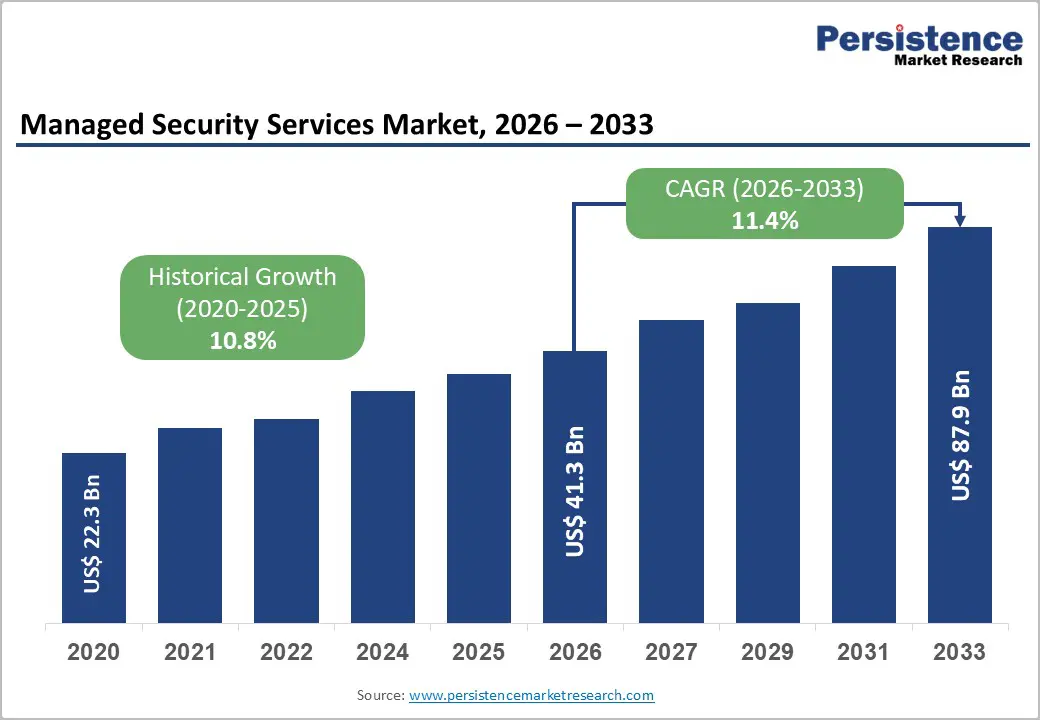
The global Managed Security Services Market size is likely to be valued at US$ 41.3 Billion in 2026 and is expected to reach US$ 87.9 Billion by 2033, growing at a CAGR of 11.4% during the forecast period from 2026 to 2033. This sustained expansion is driven by escalating cyber threats, rapid digital-transformation initiatives, and tightening regulatory frameworks that compel organizations to outsource complex security operations to specialized providers.
Key Market Highlights
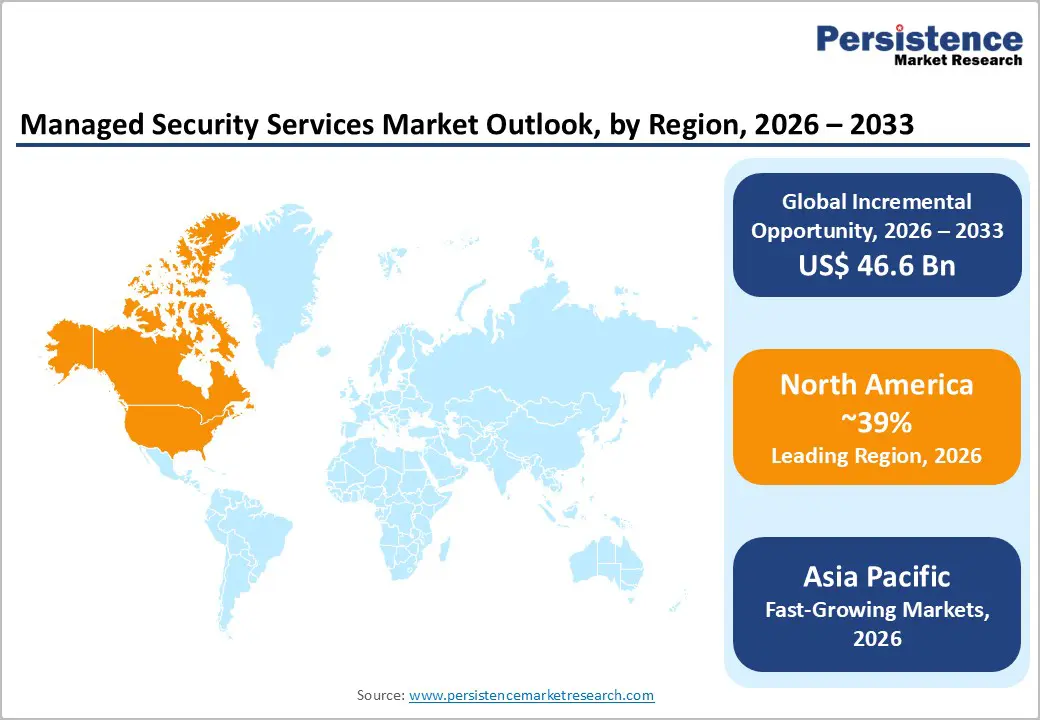
- Leading region: North America leads the Managed Security Services Market, holding a 39% market share, driven by mature cybersecurity regulations, high penetration of digital infrastructure, and early adoption of managed advanced threat detection and cloud security services.
- Fastest-growing region: Asia Pacific leads with a 13.2% CAGR, driven by rapid digitalization, cloud migration, and government-led cybersecurity initiatives in India, China, Japan, and ASEAN countries.
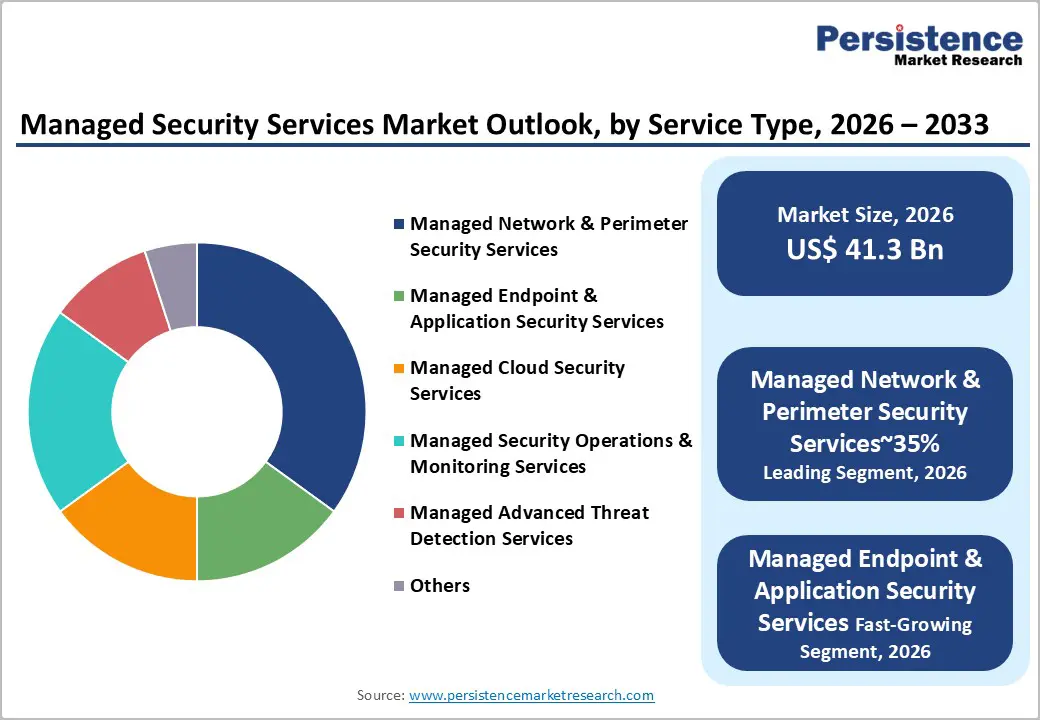
- Dominant segment: The Managed Network & Perimeter Security Services segment dominates, capturing around 35% of the market by providing firewall management, IDS/IPS, and secure remote-access services to BFSI, government, and enterprise networks.
- Fastest-growing segments: The Managed Security Operations & Monitoring Services segment is the fastest-growing, with a share approaching 25% as organizations adopt SOC-as-a-service, managed SIEM, and 24/7 monitoring across IT, OT, and cloud environments.
- Key market opportunity: The expansion of managed cloud and hybrid security services for multi-cloud and remote work environments presents a major opportunity, especially for BFSI, telecommunications, and critical infrastructure sectors seeking compliance-aligned, AI-driven security operations.
| Key Insights | Details |
|---|---|
|
Managed Security Services Market Size (2026E) |
US$ 41.3 Billion |
|
Market Value Forecast (2033F) |
US$ 87.9 Billion |
|
Projected Growth CAGR (2026–2033) |
11.4% |
|
Historical Market Growth (2020–2025) |
10.8% |
Market Dynamics
Market Growth Drivers
Rising cyber threats and digital-transformation initiatives
Organizations worldwide are facing an unprecedented surge in ransomware, phishing, supply-chain attacks, and zero-day exploits, compelling them to augment internal capabilities with managed security services. According to ENISA and national cybersecurity agencies, the number of reported cyber incidents has risen sharply since 2020, with critical infrastructure sectors such as BFSI, healthcare, and energy as primary targets.
At the same time, large-scale digital-transformation projects, cloud migration, SaaS adoption, and remote-work enablement have expanded the` attack surface, making continuous monitoring and incident-response support essential. This environment favors Managed Security Operations & Monitoring Services and Managed Advanced Threat Detection Services, which provide 24/7 surveillance, threat intelligence, and automated response.
Talent shortage and regulatory-compliance pressures
A persistent global shortage of cybersecurity professionals, documented by bodies such as (ISC)² and ISACA, is forcing organizations to outsource security functions instead of building large in-house teams. Surveys indicate that over 3 million cybersecurity roles remain unfilled worldwide, particularly in incident response, threat hunting, and cloud-security engineering.
Regulations such as the EU General Data Protection Regulation (GDPR), NIS2 Directive, PCI DSS, and HIPAA impose strict data-protection and breach-notification requirements, increasing compliance-related costs. Managed Security Service Providers (MSSPs) help enterprises meet these obligations through managed compliance monitoring, vulnerability management, and audit-ready reporting, particularly in the BFSI, government, and healthcare sectors.
Market Restraints: High cost and perceived complexity of managed-security contracts
For many small and medium enterprises (SMEs), the upfront and recurring costs of fully managed security services can be prohibitive, particularly when bundled with advanced threat-detection platforms and dedicated security-operations-center (SOC) resources. Organizations often struggle to quantify return on investment (ROI) from MSSPs, especially in the absence of major incidents, which can delay adoption.
Integrating managed security services with legacy IT systems, on-premise data centers, and multi-cloud environments introduces technical complexity and may require significant change-management efforts. This barrier is particularly pronounced in emerging markets, where budget constraints and fragmented IT landscapes limit willingness to commit to long-term MSS contracts.
Data-privacy concerns and vendor-lock-in risks
Entrusting sensitive network logs, user behavior data, and system configurations to third-party MSSPs raises data-privacy and sovereignty concerns, especially in regulated industries and government entities. Some organizations hesitate to share full-packet captures, identity-management data, or cloud-configuration details due to fears of insider misuse or cross-tenant exposure in shared platforms.
Moreover, reliance on proprietary SIEM, SOAR, and threat intelligence platforms can create vendor lock-in, making it difficult and costly to switch providers or bring capabilities back in-house. These concerns are amplified in regions with stringent data-localization laws, such as certain Middle East and Southeast Asian jurisdictions, where local authorities mandate that critical-infrastructure data remain within national borders.
Market Opportunities
Expansion of managed cloud and hybrid-security services
The shift toward multi-cloud and hybrid-IT architectures is creating a major opportunity for Managed Cloud Security Services and Managed Security Operations & Monitoring Services tailored to AWS, Microsoft Azure, and Google Cloud Platform environments. ENISA and cloud-Security alliances highlight that misconfigurations and identity-related flaws are among the leading causes of cloud security incidents, underscoring the need for continuous configuration audits, identity and access management (IAM) monitoring, and cloud workload protection.
Providers such as Accenture, NTT, and Wipro are expanding cloud-security-as-a-service offerings that combine managed detection and response (MDR), cloud-security posture management (CSPM), and compliance dashboards, targeting enterprises undergoing large-scale cloud migrations. This trend is especially strong in the Asia Pacific, where India and Southeast Asia are witnessing rapid digital infrastructure rollouts.
Growth of SME-focused and subscription-based security models
Small and medium enterprises (SMEs) represent an underpenetrated but rapidly growing segment for Managed Security Services, driven by rising ransomware attacks on small businesses and limited internal expertise. Industry analyses note that SMEs increasingly favor co-managed security services and subscription-based bundles that include endpoint protection, email security, and basic SOC monitoring at predictable monthly fees.
Governments and industry associations in countries such as India, Brazil, and South Africa are promoting cyber-hygiene programs and subsidized security-advisory services, which indirectly boost demand for managed security among SMEs. Providers are responding with standardized playbooks, self-service portals, and automated threat-intelligence feeds, enabling cost-effective protection for organizations that cannot justify full-time security teams.
Category-wise Insights
Service Type Analysis
Managed Network & Perimeter Security Services dominate the Service Type category with approximately 35% market share, reflecting the enduring importance of firewall management, intrusion-detection/prevention systems (IDS/IPS), and secure remote-access gateways. Enterprises with large on-premise data centers and branch networks rely on MSSPs to continuously monitor traffic patterns, update firewall rules, and respond to perimeter-oriented attacks such as DDoS and port-scanning campaigns.
Data from industry security vendors' reports and government cybersecurity advisories indicate that perimeter-centric controls remain a foundational layer of defense-in-depth strategies, particularly for BFSI, government, and manufacturing organizations. The integration of next-generation firewalls (NGFW) and SD-Does WAN security further reinforces demand for managed network security services, as enterprises seek to secure hybrid-work and multi-cloud connectivity.
Operation Mode Analysis
Fully Managed Security Services account for roughly 60% of the Operation Mode segment, as organizations prefer end-to-end outsourcing of monitoring, incident response, and compliance management rather than partial or advisory engagements. This model is particularly attractive to large enterprises with complex, globally distributed IT environments that lack sufficient in-house analysts to staff 24/7 SOCs.
Independent analyses of MSSP portfolios indicate that fully managed offerings typically include managed SIEM, managed firewall, managed endpoint detection and response (EDR), and vulnerability management services, often backed by service-level agreements (SLAs) that guarantee response times and remediation windows. The BFSI and telecommunications sectors are among the heaviest adopters, given their exposure to regulatory audits and high-profile cyber incidents.
Organization Size Analysis
Large Enterprises capture around 65% of the Organization Size segment, driven by their extensive IT footprints, high-value data assets, and stringent compliance obligations. Global corporations in BFSI, healthcare, manufacturing, and energy operate thousands of endpoints, multiple data centers, and complex cloud environments, making internal security management highly resource-intensive.
Surveys by professional-security bodies indicate that large enterprises are more likely to contract dedicated MSSPs for managed advanced threat detection, managed cloud security, and managed security operations, often under multi-year agreements. These organizations also prioritize threat intelligence sharing, red team exercises, and regulatory reporting automation, which are typically bundled into premium managed security packages.
End Use Analysis
The BFSI (Banking, Financial Services, and Insurance) sector accounts for approximately 35% of the End Use segment, making it the largest single industry for Managed Security Services. Financial institutions face persistent threats from online banking fraud, card skimming, SWIFT-related attacks, and ransomware, prompting substantial investment in managed security operations, managed advanced threat detection, and managed cloud security services.
Regulatory frameworks such as GDPR, PCI DSS, and Basel III-linked cybersecurity guidelines require continuous monitoring and incident-reporting capabilities, which MSSPs deliver through 24/7 SOCs, SIEM-as-a-service, and compliance dashboards. ENISA and central-bank advisories emphasize that outsourcing to accredited MSSPs can help banks meet supervisory expectations while reducing operational overhead.
Regional Insights
North America Managed Security Services Trends
North America leads the Managed Security Services Market in terms of adoption, innovation, and regulatory maturity, with the United States accounting for the largest national share. The region benefits from a highly developed cybersecurity ecosystem, including federal agencies such as CISA, NIST, and FBI, which issue frameworks and advisories that shape enterprise security practices.
U.S. organizations are early adopters of managed advanced threat detection, cloud security services, and MDR, driven by frequent ransomware attacks and strict data protection and sector-specific regulations. The presence of major MSSPs such as AT&T, Verizon, Cisco, and Palo Alto Networks fosters a competitive environment that drives continuous innovation in SOC capabilities, threat intelligence platforms, and automation.
Europe Managed Security Services Trends
Europe exhibits strong demand for regulation-aligned managed security services, particularly in Germany, the United Kingdom, France, and Spain. The EU NIS2 Directive, GDPR, and national cybersecurity strategies are pushing BFSI, government, and critical-infrastructure entities to outsource monitoring and incident-response functions to accredited MSSPs.
ENISA reports highlight that European organizations increasingly prioritize managed cloud-security services, managed identity-and-access-management, and managed detection-and-response to address hybrid-cloud and remote-work challenges. Cross-border cybersecurity cooperation and CERT-network collaborations further drive the standardization of managed-security practices, enabling pan-European providers such as Accenture, NTT, and Wipro to offer harmonized services across multiple jurisdictions.
Asia Pacific Managed Security Services Trends
Asia-Pacific is the fastest-growing region for Managed Security Services, driven by rapid digitalization, cloud adoption, and smart city initiatives in China, Japan, India, and the ASEAN countries. India and Southeast Asia are witnessing a surge in e-commerce, fintech, and telecom-digital services, which increases exposure to online fraud, DDoS attacks, and data breach risks.
Governments in India, Singapore, and Malaysia have launched national cybersecurity strategies and cyber-resilience programs, encouraging enterprises to engage MSSPs for managed security operations, cloud security, and incident-response readiness. Local providers are partnering with global players such as Cisco, Fortinet, and Check Point to deliver localized SOC services, language-specific support, and region-specific compliance solutions, leveraging the region’s IT services and BPO strengths.
Competitive Landscape
Market Structure Analysis
The Managed Security Services Market is moderately consolidated, with a mix of global telecom operators, IT-services giants, pure-play MSSPs, and network-security vendors. Leading players such as AT&T, Verizon, Cisco, Palo Alto Networks, Fortinet, Check Point Software Technologies, IBM, Accenture, Wipro, NTT, and BAE Systems hold significant shares through integrated security platforms, global SOCs, and industry-specific solutions.
Smaller and regional MSSPs compete on niche verticals, localized compliance, and cost-competitive bundles, particularly for SMEs and mid-market organizations. Strategic trends include vertical specialization, cloud security as a service, MDR/MXDR integration, and partnerships with hyperscalers, which are reshaping competitive dynamics and driving consolidation through M&A and strategic alliances.
Key Market Developments
- In October 2025: AT&T expanded its Managed Threat Detection & Response (MDR) portfolio with AI-driven analytics and automated playbooks, targeting large enterprises in BFSI and telecommunications across North America and Europe. The upgrade aims to reduce mean time to detection (MTTD) and mean time to response (MTTR) for sophisticated ransomware and supply-chain attacks.
- In June 2024: Accenture launched a cloud-native managed security operations center (SOC) for Asia Pacific clients, integrating Microsoft Azure Sentinel, AWS Security Hub, and Google Chronicle to provide unified visibility across multi-cloud environments. The initiative targets financial institutions, healthcare providers, and government agencies seeking compliance-aligned monitoring.
- In March 2024, Palo Alto Networks introduced a co-managed SOC offering that combines its Cortex XDR platform with Wipro’s security operations expertise, enabling enterprises to retain control over critical decisions while outsourcing 24/7 monitoring and incident triage.
Companies Covered in Managed Security Services Market
- AT&T
- BAE Systems, Inc.
- Cisco
- Check Point Software Technologies
- Fortinet, Inc.
- Fujitsu
- IBM
- Palo Alto Networks
- Rapid7
- Verizon
- Wipro
- NTT
- LevelBlue
- Accenture
- DXC Technology
- Tata Consultancy Services (TCS)
- Capgemini
- Deloitte Cyber
- KPMG Cyber
- Ernst & Young (EY) Cyber
Frequently Asked Questions
The Managed Security Services Market is projected to reach US$ 87.9 Billion by 2033, growing at a CAGR of 11.4% from 2026, driven by rising cyber threats, cloud‑adoption, and regulatory‑compliance requirements.
Key demand drivers include escalating cyber threats, digital‑transformation, cloud‑migration, remote‑work adoption, and shortage of cybersecurity talent, which push organizations to outsource managed security operations, advanced threat detection, and compliance monitoring.
The Managed Network & Perimeter Security Services segment dominates, capturing around 35% of the market by providing firewall management, IDS/IPS, and secure remote‑access services to BFSI, government, and enterprise networks.
North America leads the global Managed Security Services Market, supported by mature regulations, high digital‑infrastructure penetration, and early adoption of managed advanced threat detection and cloud‑security services.
A key opportunity lies in managed cloud and hybrid‑security services for multi‑cloud and remote‑work environments, particularly in BFSI, telecommunications, and critical‑infrastructure sectors seeking AI‑driven, compliance‑aligned security operations.
Major players include AT&T, BAE Systems, Inc., Cisco, Check Point Software Technologies, Fortinet, Inc., Fujitsu, IBM, Palo Alto Networks, Rapid7, Verizon, Wipro, NTT, LevelBlue, Accenture, and DXC Technology, among others.


