

- Executive Summary
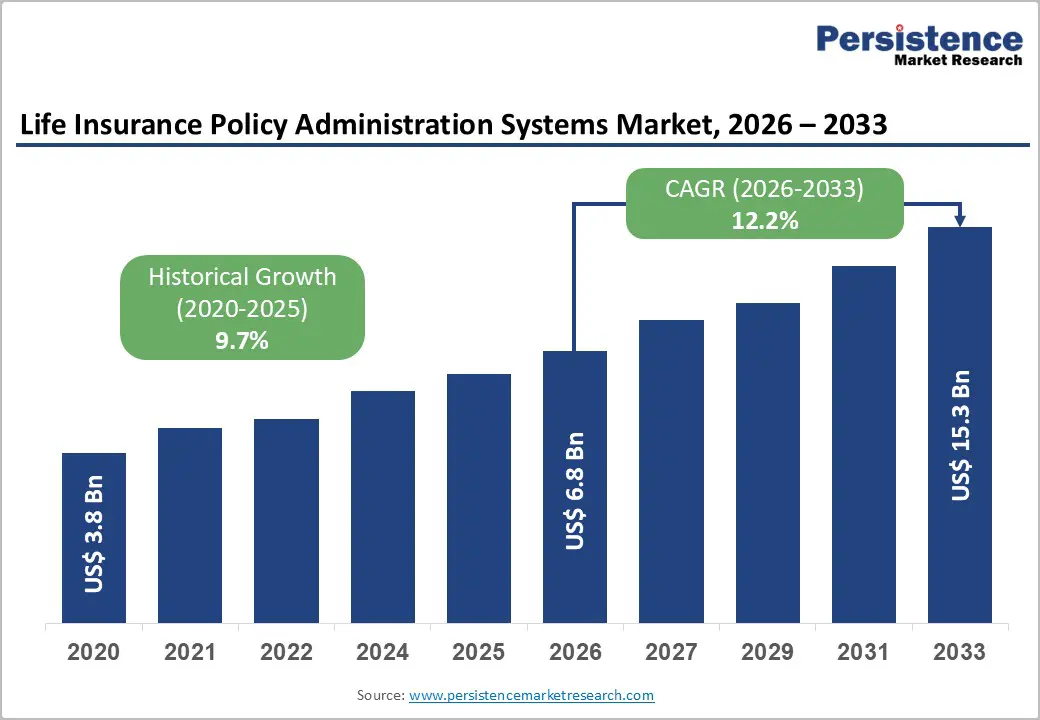
- Global Life Insurance Policy Administration Systems Market Snapshot, 2026 and 2033
- Market Opportunity Assessment, 2026 – 2033, US$ Mn
- Key Market Trends
- Future Market Projections
- Premium Market Insights
- Industry Developments and Key Market Events
- PMR Analysis and Recommendations
- Market Overview
- Market Scope and Definition
- Market Dynamics
- Drivers
- Restraints
- Opportunity
- Challenges
- Key Trends
- Product Lifecycle Analysis
- Global Parent Market Overview
- Life Insurance Policy Administration Systems Market: Value Chain
- List of Raw Policy Type Supplier
- List of Manufacturers
- List of Distributors
- List of End Use Industries
- Profitability Analysis
- Forecast Factors – Relevance and Impact
- Covid-19 Impact Assessment
- PESTLE Analysis
- Porter Five Force’s Analysis
- Geopolitical Tensions: Market Impact
- Regulatory and Policy Type Landscape
- 3.1. Macro-Economic Factors
- Global Sectorial Outlook
- Global GDP Growth Outlook
- Other Macro-economic Factors
- Price Trend Analysis, 2020 – 2033
- Key Highlights
- Key Factors Impacting Product Prices
- Prices By Sensor Type /Policy Type/Deployment Mode
- Regional Prices and Product Preferences
- Global Life Insurance Policy Administration Systems Market Outlook: Historical (2020 – 2025) and Forecast (2026 – 2033)
- Key Highlights
- Market Size and Y-o-Y Growth
- Absolute $ Opportunity
- Market Size (US$ Mn) Analysis and Forecast
- Historical Market Size Analysis, 2020-2025
- Current Market Size Forecast, 2026–2033
- Global Life Insurance Policy Administration Systems Market Outlook: Sensor Type
- Introduction / Key Findings
- Historical Market Size (US$ Mn) Analysis By Component Type, 2020 – 2025
- Current Market Size (US$ Mn) Forecast By Component Type, 2026 – 2033
- Software
- Services
- Market Attractiveness Analysis: Component Type
- Global Life Insurance Policy Administration Systems Market Outlook: Policy Type
- Introduction / Key Findings
- Historical Market Size (US$ Mn) Analysis By Policy Type, 2020 – 2025
- Current Market Size (US$ Mn) Forecast By Policy Type, 2026 – 2033
- Term Life Insurance
- Whole Life Insurance
- Misc.
- Market Attractiveness Analysis: Policy Type
- Global Life Insurance Policy Administration Systems Market Outlook Deployment Mode
- Introduction / Key Findings
- Historical Market Size (US$ Mn) Analysis By Deployment Mode, 2020 – 2025
- Current Market Size (US$ Mn) Forecast By Deployment Mode, 2026 – 2033
- On-Premises
- Cloud/Hosted
- Misc.
- Market Attractiveness Analysis: Deployment Mode
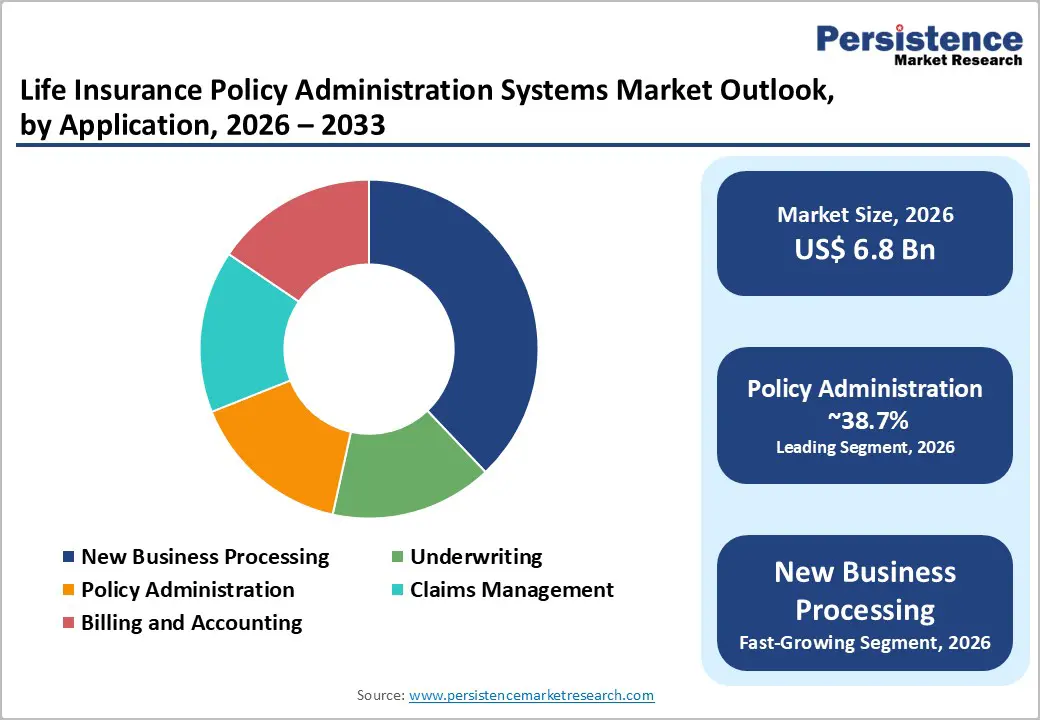
- Global Life Insurance Policy Administration Systems Market Outlook Application
- Introduction / Key Findings
- Historical Market Size (US$ Mn) Analysis By Application, 2020 – 2025
- Current Market Size (US$ Mn) Forecast By Application, 2026 – 2033
- New Business Processing
- Underwriting
- Policy Administration
- Claims Management
- Billing and Accounting
- Market Attractiveness Analysis: Application
- Key Highlights
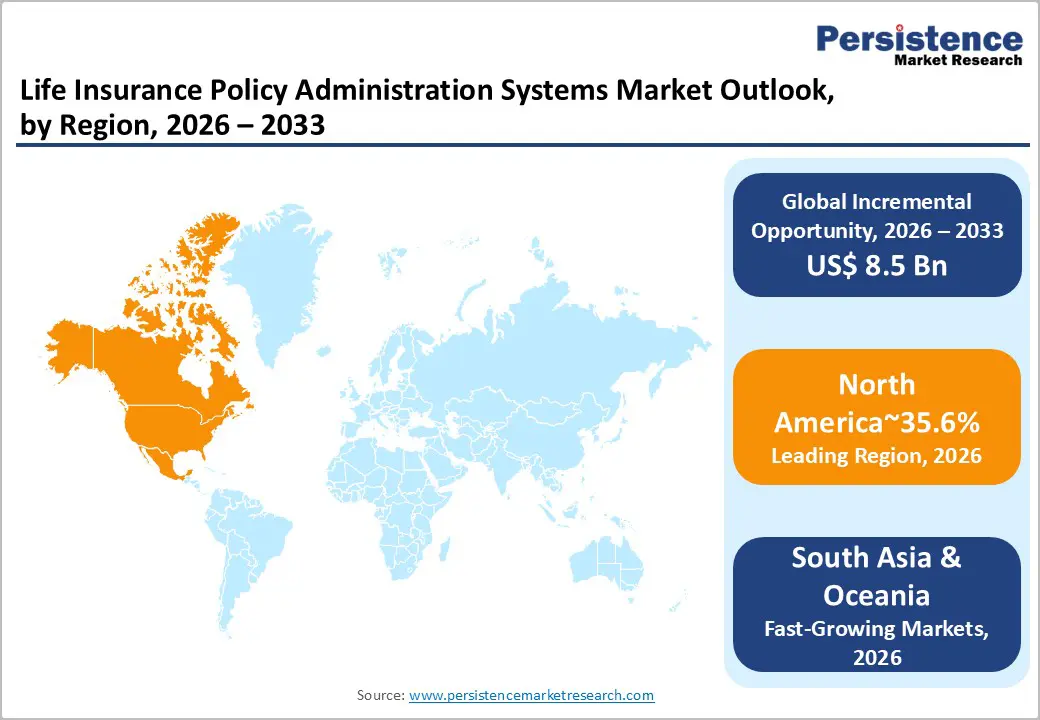
- Global Life Insurance Policy Administration Systems Market Outlook Region
- Key Highlights
- Historical Market Size (US$ Mn) Analysis By Region, 2020 – 2025
- Current Market Size (US$ Mn) Forecast By Region, 2026 – 2033
- North America
- Europe
- East Asia
- South Asia and Oceania
- Latin America
- Middle East & Africa
- Market Attractiveness Analysis: Region
- North America Life Insurance Policy Administration Systems Market Outlook: Historical (2020 – 2025) and Forecast (2026 – 2033)
- Key Highlights
- Pricing Analysis
- Historical Market Size (US$ Mn) Analysis By Market, 2020 – 2025
- By Country
- By Component Type
- By Policy Type
- By Deployment Mode
- By Application
- Current Market Size (US$ Mn) Forecast By Country, 2026 – 2033
- U.S.
- Canada
- Current Market Size (US$ Mn) Forecast By Component Type, 2026 – 2033
- Software
- Services
- Current Market Size (US$ Mn) Forecast By Policy Type, 2026 – 2033
- Term Life Insurance
- Whole Life Insurance
- Misc.
- Current Market Size (US$ Mn) Forecast By Deployment Mode, 2026 – 2033
- On-Premise
- Cloud/Hosted
- Misc.
- Current Market Size (US$ Mn) Forecast By Application, 2026 – 2033
- New Business Processing
- Underwriting
- Policy Administration
- Claims Management
- Billing and Accounting
- Market Attractiveness Analysis
- Europe Life Insurance Policy Administration Systems Market Outlook: Historical (2020 – 2025) and Forecast (2026 – 2033)
- Key Highlights
- Pricing Analysis
- Historical Market Size (US$ Mn) Analysis By Market, 2020 – 2025
- By Country
- By Component Type
- By Policy Type
- By Deployment Mode
- By Application
- By Current Market Size (US$ Mn) Forecast By Country, 2026 – 2033
- Germany
- Italy
- France
- U.K.
- Spain
- Russia
- Türkiye
- Rest of Europe
- Current Market Size (US$ Mn) Forecast By Component Type, 2026 – 2033
- Software
- Services
- Current Market Size (US$ Mn) Forecast By Policy Type, 2026 – 2033
- Term Life Insurance
- Whole Life Insurance
- Misc.
- Current Market Size (US$ Mn) Forecast By Deployment Mode, 2026 – 2033
- On-Premise
- Cloud/Hosted
- Misc.
- Current Market Size (US$ Mn) Forecast By Application, 2026 – 2033
- New Business Processing
- Underwriting
- Policy Administration
- Claims Management
- Billing and Accounting
- Market Attractiveness Analysis
- East Asia Life Insurance Policy Administration Systems Market Outlook: Historical (2020 – 2025) and Forecast (2026 – 2033)
- Key Highlights
- Pricing Analysis
- Historical Market Size (US$ Mn) Analysis By Market, 2020 – 2025
- By Country
- By Component Type
- By Policy Type
- By Deployment Mode
- By Application
- Current Market Size (US$ Mn) Forecast By Country, 2026 – 2033
- China
- Japan
- South Korea
- Current Market Size (US$ Mn) Forecast By Component Type, 2026 – 2033
- Software
- Services
- Current Market Size (US$ Mn) Forecast By Policy Type, 2026 – 2033
- Term Life Insurance
- Whole Life Insurance
- Misc.
- Current Market Size (US$ Mn) Forecast By Deployment Mode, 2026 – 2033
- On-Premises
- Cloud/Hosted
- Misc.
- Current Market Size (US$ Mn) Forecast By Application, 2026 – 2033
- New Business Processing
- Underwriting
- Policy Administration
- Claims Management
- Billing and Accounting
- Market Attractiveness Analysis
- South Asia & Oceania Life Insurance Policy Administration Systems Market Outlook: Historical (2020 – 2025) and Forecast (2026 – 2033)
- Key Highlights
- Pricing Analysis
- Historical Market Size (US$ Mn) Analysis By Market, 2020 – 2025
- By Country
- By Component Type
- By Policy Type
- By Deployment Mode
- By Application
- Current Market Size (US$ Mn) Forecast By Country, 2026 – 2033
- India
- Southeast Asia
- ANZ
- Rest of South Asia & Oceania
- Current Market Size (US$ Mn) Forecast By Component Type, 2026 – 2033
- Software
- Services
- Current Market Size (US$ Mn) Forecast By Policy Type, 2026 – 2033
- Term Life Insurance
- Whole Life Insurance
- Misc.
- Current Market Size (US$ Mn) Forecast By Deployment Mode, 2026 – 2033
- On-Premise
- Cloud/Hosted
- Misc.
- Current Market Size (US$ Mn) Forecast By Application, 2026 – 2033
- New Business Processing
- Underwriting
- Policy Administration
- Claims Management
- Billing and Accounting
- Market Attractiveness Analysis
- Latin America Life Insurance Policy Administration Systems Market Outlook: Historical (2020 – 2025) and Forecast (2026 – 2033)
- Key Highlights
- Pricing Analysis
- Historical Market Size (US$ Mn) Analysis By Market, 2020 – 2025
- By Country
- By Component Type
- By Policy Type
- By Deployment Mode
- By Application
- Current Market Size (US$ Mn) Forecast By Country, 2026 – 2033
- Brazil
- Mexico
- Rest of Latin America
- Current Market Size (US$ Mn) Forecast By Component Type, 2026 – 2033
- Software
- Services
- Current Market Size (US$ Mn) Forecast By Policy Type, 2026 – 2033
- Term Life Insurance
- Whole Life Insurance
- Misc.
- Current Market Size (US$ Mn) Forecast By Deployment Mode, 2026 – 2033
- On-Premise
- Cloud/Hosted
- Misc.
- Current Market Size (US$ Mn) Forecast By Application, 2026 – 2033
- New Business Processing
- Underwriting
- Policy Administration
- Claims Management
- Billing and Accounting
- Market Attractiveness Analysis
- Middle East & Africa Life Insurance Policy Administration Systems Market Outlook: Historical (2020 – 2025) and Forecast (2026 – 2033)
- Key Highlights
- Pricing Analysis
- Historical Market Size (US$ Mn) Analysis By Market, 2020 – 2025
- By Country
- By Component Type
- By Policy Type
- By Deployment Mode
- By Application
- Current Market Size (US$ Mn) Forecast By Country, 2026 – 2033
- GCC Countries
- South Africa
- Northern Africa
- Rest of MEA
- Current Market Size (US$ Mn) Forecast By Component Type, 2026 – 2033
- Software
- Services
- Current Market Size (US$ Mn) Forecast By Policy Type, 2026 – 2033
- Term Life Insurance
- Whole Life Insurance
- Misc.
- Current Market Size (US$ Mn) Forecast By Deployment Mode, 2026 – 2033
- On-Premise
- Cloud/Hosted
- Misc.
- Current Market Size (US$ Mn) Forecast By Application, 2026 – 2033
- New Business Processing
- Underwriting
- Policy Administration
- Claims Management
- Billing and Accounting
- Market Attractiveness Analysis
- Competition Landscape
- Market Share Analysis, 2025
- Market Structure
- Competition Intensity Mapping By Market
- Competition Dashboard
- Apparent Production Component Type
- Company Profiles (Details – Overview, Financials, Strategy, Recent Developments)
- Oracle Corporation
- Overview
- Segments and Products
- Key Financials
- Market Developments
- Market Strategy
- Accenture plc
- InsPro Technologies LLC
- Concentrix Corporation
- DXC Technology Company
- Infosys Limited
- SAP SE
- Capgemini SE
- Mphasis Wyde
- EXL
- Sapiens International Corporation
- Majesco
- Andesa Services
- FAST Technology
- Oracle Corporation
Note: List of companies is not exhaustive in Nature . It is subject to further augmentation during course of research
- Appendix
- Research Methodology
- Research Assumptions
- Acronyms and Abbreviations


