


- Executive Summary
- Global Laboratory Informatics Market Snapshot, 2026 and 2033
- Market Opportunity Assessment, 2026 – 2033, US$ Bn
- Key Market Trends
- Future Market Projections
- Premium Market Insights
- Industry Developments and Key Market Events
- PMR Analysis and Recommendations
- Market Overview
- Market Scope and Definition
- Market Dynamics
- Drivers
- Restraints
- Opportunity
- Challenges
- Key Trends
- Macro-Economic Factors
- Global Sectorial Outlook
- Global GDP Growth Outlook
- COVID-19 Impact Analysis
- Forecast Factors – Relevance and Impact
- Value Added Insights
- Regulatory Landscape
- Product Adoption Analysis
- Value Chain Analysis
- Key Deals and Mergers
- PESTLE Analysis
- Porter’s Five Force Analysis
- Global Laboratory Informatics Market Outlook:
- Key Highlights
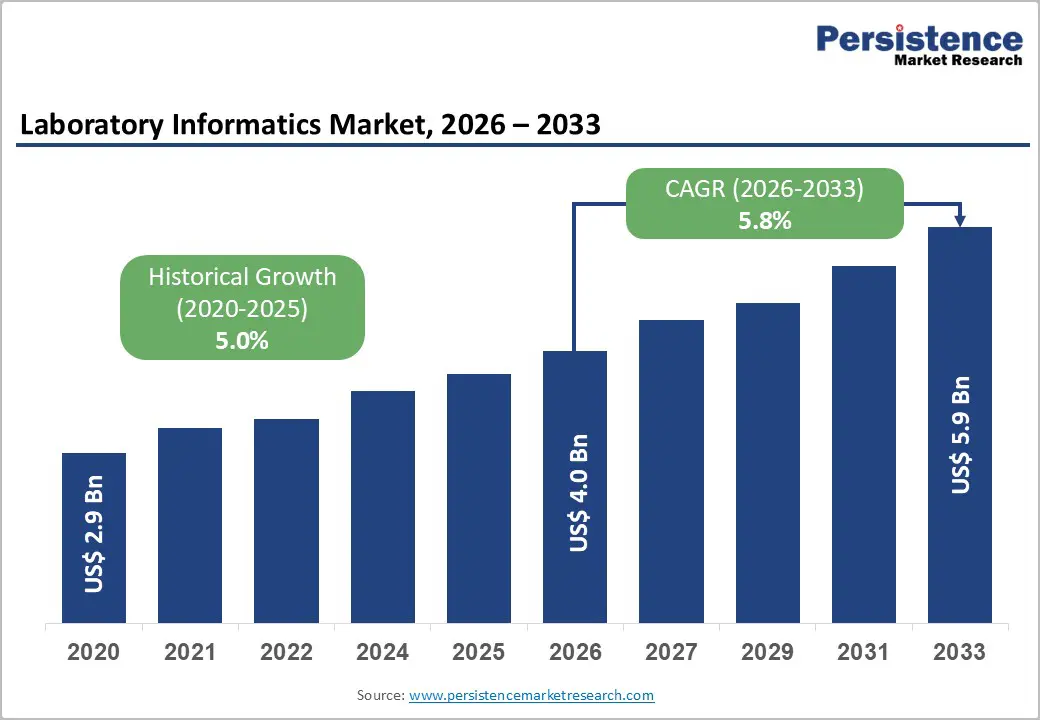
- Market Size (US$ Bn) and Y-o-Y Growth
- Absolute $ Opportunity
- Market Size (US$ Bn) Analysis and Forecast
- Historical Market Size (US$ Bn) Analysis, 2020-2025
- Market Size (US$ Bn) Analysis and Forecast, 2026–2033
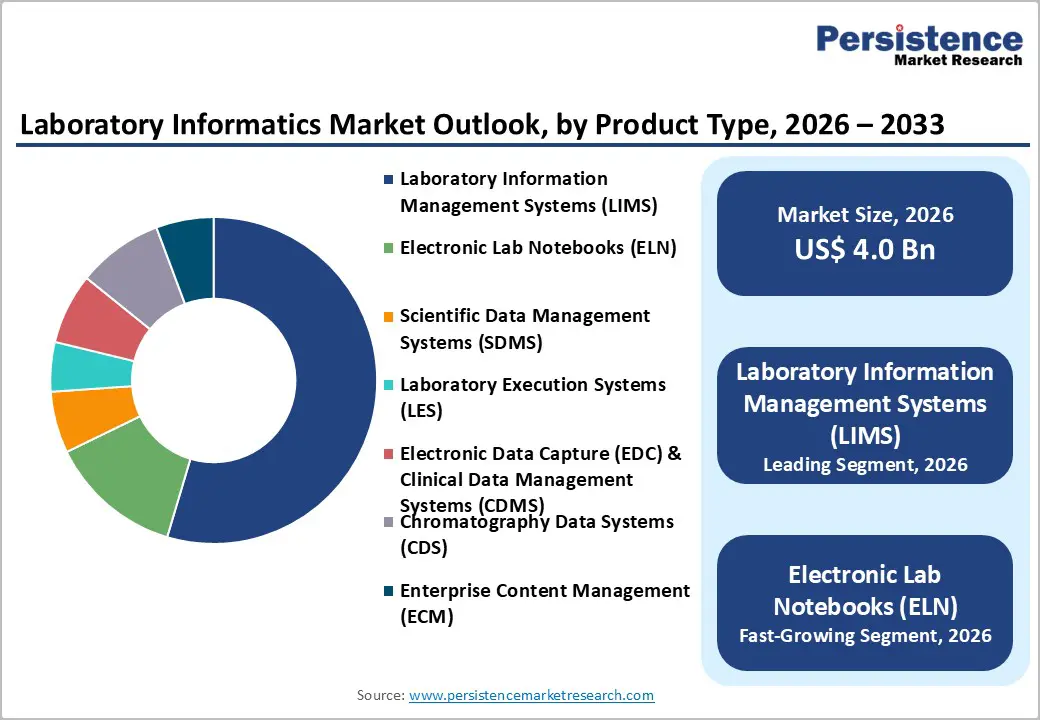
- Global Laboratory Informatics Market Outlook: Product Type
- Introduction / Key Findings
- Historical Market Size (US$ Bn) Analysis, By Product Type, 2020 – 2025
- Market Size (US$ Bn) Analysis and Forecast, By Product Type, 2026 – 2033
- Laboratory Information Management Systems (LIMS)
- Electronic Lab Notebooks (ELN)
- Scientific Data Management Systems (SDMS)
- Laboratory Execution Systems (LES)
- Electronic Data Capture (EDC) & Clinical Data Management Systems (CDMS)
- Chromatography Data Systems (CDS)
- Enterprise Content Management (ECM)
- Market Attractiveness Analysis: Product Type
- Global Laboratory Informatics Market Outlook: Deployment Mode
- Introduction / Key Findings
- Historical Market Size (US$ Bn) Analysis, By Deployment Mode, 2020 – 2025
- Market Size (US$ Bn) Analysis and Forecast, By Deployment Mode, 2026 – 2033
- On-premise
- Web-hosted
- Cloud-based
- Market Attractiveness Analysis: Deployment Mode
- Global Laboratory Informatics Market Outlook: Component
- Introduction / Key Findings
- Historical Market Size (US$ Bn) Analysis, By Component, 2020 – 2025
- Market Size (US$ Bn) Analysis and Forecast, By Component, 2026 – 2033
- Software
- Services
- Market Attractiveness Analysis: Component
- Global Laboratory Informatics Market Outlook: End User
- Introduction / Key Findings
- Historical Market Size (US$ Bn) Analysis, By End User, 2020 – 2025
- Market Size (US$ Bn) Analysis and Forecast, By End User, 2026 – 2033
- Life Sciences
- CROs
- Chemical Industry
- F&B and Agriculture
- Environmental Testing Labs
- Petrochemical Refineries & Oil and Gas Industry
- Others
- Market Attractiveness Analysis: End User
- Key Highlights
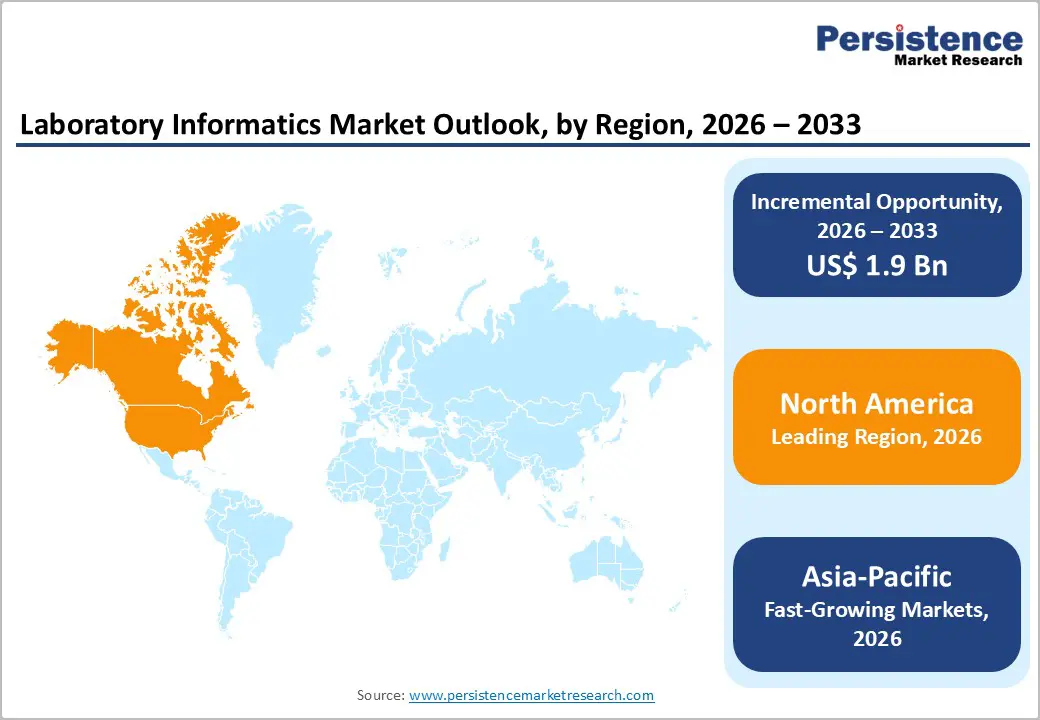
- Global Laboratory Informatics Market Outlook: Region
- Key Highlights
- Historical Market Size (US$ Bn) Analysis, By Region, 2020 – 2025
- Market Size (US$ Bn) Analysis and Forecast, By Region, 2026 – 2033
- North America
- Europe
- East Asia
- South Asia and Oceania
- Latin America
- Middle East & Africa
- Market Attractiveness Analysis: Region
- North America Laboratory Informatics Market Outlook:
- Key Highlights
- Historical Market Size (US$ Bn) Analysis, By Market, 2020 – 2025
- By Country
- By Product Type
- By Deployment Mode
- By Component
- By End User
- Market Size (US$ Bn) Analysis and Forecast, By Country, 2026 – 2033
- U.S.
- Canada
- Market Size (US$ Bn) Analysis and Forecast, By Product Type, 2026 – 2033
- Laboratory Information Management Systems (LIMS)
- Electronic Lab Notebooks (ELN)
- Scientific Data Management Systems (SDMS)
- Laboratory Execution Systems (LES)
- Electronic Data Capture (EDC) & Clinical Data Management Systems (CDMS)
- Chromatography Data Systems (CDS)
- Enterprise Content Management (ECM)
- Market Size (US$ Bn) Analysis and Forecast, By Deployment Mode, 2026 – 2033
- On-premise
- Web-hosted
- Cloud-based
- Market Size (US$ Bn) Analysis and Forecast, By Component, 2026 – 2033
- Software
- Services
- Market Size (US$ Bn) Analysis and Forecast, By End User, 2026 – 2033
- Life Sciences
- CROs
- Chemical Industry
- F&B and Agriculture
- Environmental Testing Labs
- Petrochemical Refineries & Oil and Gas Industry
- Others
- Market Attractiveness Analysis
- Europe Laboratory Informatics Market Outlook:
- Key Highlights
- Historical Market Size (US$ Bn) Analysis, By Market, 2020 – 2025
- By Country
- By Product Type
- By Deployment Mode
- By Component
- By End User
- Market Size (US$ Bn) Analysis and Forecast, By Country, 2026 – 2033
- Germany
- France
- U.K.
- Italy
- Spain
- Russia
- Rest of Europe
- Market Size (US$ Bn) Analysis and Forecast, By Product Type, 2026 – 2033
- Laboratory Information Management Systems (LIMS)
- Electronic Lab Notebooks (ELN)
- Scientific Data Management Systems (SDMS)
- Laboratory Execution Systems (LES)
- Electronic Data Capture (EDC) & Clinical Data Management Systems (CDMS)
- Chromatography Data Systems (CDS)
- Enterprise Content Management (ECM)
- Market Size (US$ Bn) Analysis and Forecast, By Deployment Mode, 2026 – 2033
- On-premise
- Web-hosted
- Cloud-based
- Market Size (US$ Bn) Analysis and Forecast, By Component, 2026 – 2033
- Software
- Services
- Market Size (US$ Bn) Analysis and Forecast, By End User, 2026 – 2033
- Life Sciences
- CROs
- Chemical Industry
- F&B and Agriculture
- Environmental Testing Labs
- Petrochemical Refineries & Oil and Gas Industry
- Others
- Market Attractiveness Analysis
- East Asia Laboratory Informatics Market Outlook:
- Key Highlights
- Historical Market Size (US$ Bn) Analysis, By Market, 2020 – 2025
- By Country
- By Product Type
- By Deployment Mode
- By Component
- By End User
- Market Size (US$ Bn) Analysis and Forecast, By Country, 2026 – 2033
- China
- Japan
- South Korea
- Market Size (US$ Bn) Analysis and Forecast, By Product Type, 2026 – 2033
- Laboratory Information Management Systems (LIMS)
- Electronic Lab Notebooks (ELN)
- Scientific Data Management Systems (SDMS)
- Laboratory Execution Systems (LES)
- Electronic Data Capture (EDC) & Clinical Data Management Systems (CDMS)
- Chromatography Data Systems (CDS)
- Enterprise Content Management (ECM)
- Market Size (US$ Bn) Analysis and Forecast, By Deployment Mode, 2026 – 2033
- On-premise
- Web-hosted
- Cloud-based
- Market Size (US$ Bn) Analysis and Forecast, By Component, 2026 – 2033
- Software
- Services
- Market Size (US$ Bn) Analysis and Forecast, By End User, 2026 – 2033
- Life Sciences
- CROs
- Chemical Industry
- F&B and Agriculture
- Environmental Testing Labs
- Petrochemical Refineries & Oil and Gas Industry
- Others
- Market Attractiveness Analysis
- South Asia & Oceania Laboratory Informatics Market Outlook:
- Key Highlights
- Historical Market Size (US$ Bn) Analysis, By Market, 2020 – 2025
- By Country
- By Product Type
- By Deployment Mode
- By Component
- By End User
- Market Size (US$ Bn) Analysis and Forecast, By Country, 2026 – 2033
- India
- Southeast Asia
- ANZ
- Rest of South Asia & Oceania
- Market Size (US$ Bn) Analysis and Forecast, By Product Type, 2026 – 2033
- Laboratory Information Management Systems (LIMS)
- Electronic Lab Notebooks (ELN)
- Scientific Data Management Systems (SDMS)
- Laboratory Execution Systems (LES)
- Electronic Data Capture (EDC) & Clinical Data Management Systems (CDMS)
- Chromatography Data Systems (CDS)
- Enterprise Content Management (ECM)
- Market Size (US$ Bn) Analysis and Forecast, By Deployment Mode, 2026 – 2033
- On-premise
- Web-hosted
- Cloud-based
- Market Size (US$ Bn) Analysis and Forecast, By Component, 2026 – 2033
- Software
- Services
- Market Size (US$ Bn) Analysis and Forecast, By End User, 2026 – 2033
- Life Sciences
- CROs
- Chemical Industry
- F&B and Agriculture
- Environmental Testing Labs
- Petrochemical Refineries & Oil and Gas Industry
- Others
- Market Attractiveness Analysis
- Latin America Laboratory Informatics Market Outlook:
- Key Highlights
- Historical Market Size (US$ Bn) Analysis, By Market, 2020 – 2025
- By Country
- By Product Type
- By Deployment Mode
- By Component
- By End User
- Market Size (US$ Bn) Analysis and Forecast, By Country, 2026 – 2033
- Brazil
- Mexico
- Rest of Latin America
- Market Size (US$ Bn) Analysis and Forecast, By Product Type, 2026 – 2033
- Laboratory Information Management Systems (LIMS)
- Electronic Lab Notebooks (ELN)
- Scientific Data Management Systems (SDMS)
- Laboratory Execution Systems (LES)
- Electronic Data Capture (EDC) & Clinical Data Management Systems (CDMS)
- Chromatography Data Systems (CDS)
- Enterprise Content Management (ECM)
- Market Size (US$ Bn) Analysis and Forecast, By Deployment Mode, 2026 – 2033
- On-premise
- Web-hosted
- Cloud-based
- Market Size (US$ Bn) Analysis and Forecast, By Component, 2026 – 2033
- Software
- Services
- Market Size (US$ Bn) Analysis and Forecast, By End User, 2026 – 2033
- Life Sciences
- CROs
- Chemical Industry
- F&B and Agriculture
- Environmental Testing Labs
- Petrochemical Refineries & Oil and Gas Industry
- Others
- Market Attractiveness Analysis
- Middle East & Africa Laboratory Informatics Market Outlook:
- Key Highlights
- Historical Market Size (US$ Bn) Analysis, By Market, 2020 – 2025
- By Country
- By Product Type
- By Deployment Mode
- By Component
- By End User
- Market Size (US$ Bn) Analysis and Forecast, By Country, 2026 – 2033
- GCC Countries
- Egypt
- South Africa
- Northern Africa
- Rest of Middle East & Africa
- Market Size (US$ Bn) Analysis and Forecast, By Product Type, 2026 – 2033
- Laboratory Information Management Systems (LIMS)
- Electronic Lab Notebooks (ELN)
- Scientific Data Management Systems (SDMS)
- Laboratory Execution Systems (LES)
- Electronic Data Capture (EDC) & Clinical Data Management Systems (CDMS)
- Chromatography Data Systems (CDS)
- Enterprise Content Management (ECM)
- Market Size (US$ Bn) Analysis and Forecast, By Deployment Mode, 2026 – 2033
- On-premise
- Web-hosted
- Cloud-based
- Market Size (US$ Bn) Analysis and Forecast, By Component, 2026 – 2033
- Software
- Services
- Market Size (US$ Bn) Analysis and Forecast, By End User, 2026 – 2033
- Life Sciences
- CROs
- Chemical Industry
- F&B and Agriculture
- Environmental Testing Labs
- Petrochemical Refineries & Oil and Gas Industry
- Others
- Market Attractiveness Analysis
- Competition Landscape
- Market Share Analysis, 2025
- Market Structure
- Competition Intensity Mapping By Market
- Competition Dashboard
- Company Profiles (Details – Overview, Financials, Strategy, Recent Developments)
- LabWare
- Overview
- Segments and Products
- Key Financials
- Market Developments
- Market Strategy
- Thermo Fisher Scientific, Inc.
- PerkinElmer, Inc.
- Abbott
- LabLynx, Inc.
- Agilent Technologies, Inc.
- Waters
- IDBS
- McKesson Corporation
- Others
- LabWare
- Appendix
- Research Methodology
- Research Assumptions
- Acronyms and Abbreviations

Loading page data
Please wait a moment


