


- Semiconductor Materials & Components
- Intelligent Power Modules Market
Intelligent Power Modules Market Size, Trends, Share, and Growth Forecast, 2026 - 2033
Intelligent Power Modules Market by Power Devices (IGBT, MOSFET), Voltage Rating (Up to 600V, 600 - 1200 V, Above 1200 V), Application (Automotive, Industrial, Rail & Transportation, Consumer Electronics, IT & Telecom, Renewable Energy, Others), and Regional Analysis for 2026 - 2033
Intelligent Power Modules Market Size and Trends Analysis
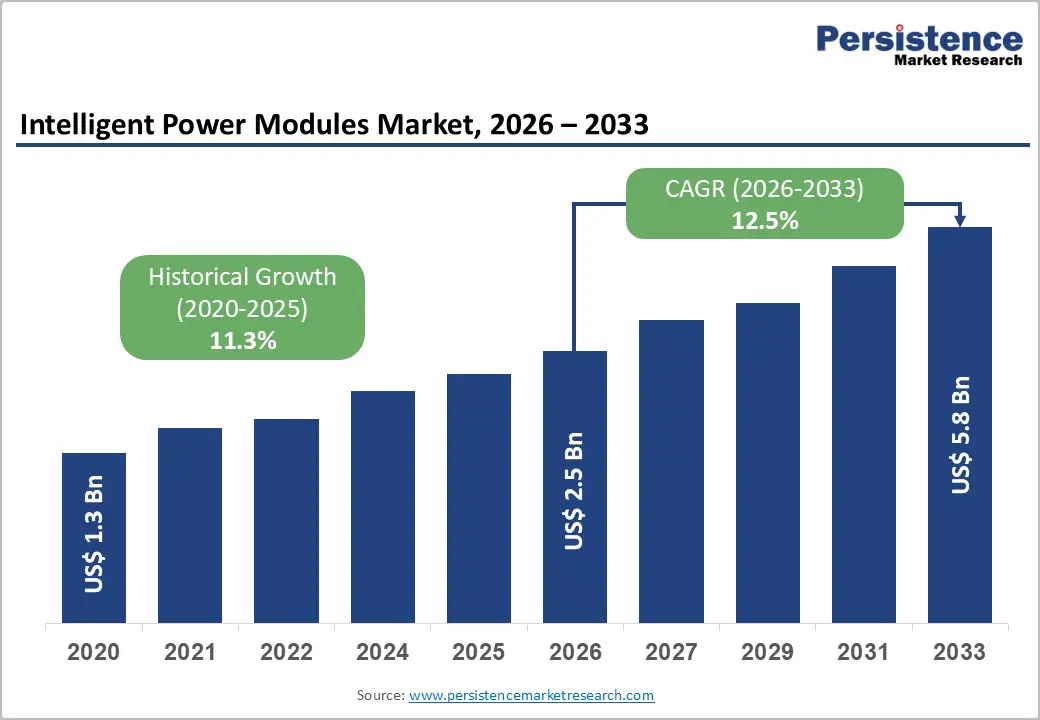
The global intelligent power modules Market size is projected to rise from US$2.4 Bn in 2026 to US$5.0 Bn by 2033. It is anticipated to witness a CAGR of 10.9% during the forecast period from 2026 to 2033.
Rising demand for high-performance systems that reduce energy loss and enhance operational efficiency is driving adoption. Integration of advanced semiconductors, wide bandgap materials like SiC and GaN, and built-in protection features that improve system reliability. The push for energy-efficient solutions and the modernization of power systems is further boosting market expansion. Growing interest in predictive maintenance and smart monitoring is creating significant opportunities for IPM implementation.
Key Industry Highlights:
- Leading Power Device: IGBT dominates with over 67% market share in 2026, valued at more than US$ 1.6 Bn, driven by high-voltage, high-current applications in EVs, industrial motor drives, and renewable inverters. MOSFETs are the fastest-growing segment, projected to exceed US$ 1.9 Bn, benefiting from high-frequency, medium-voltage applications like DC-DC converters, onboard chargers, and telecom power supplies.
- Leading Voltage Rating: Up to 600 V modules hold over 40% share in 2026, valued at ~US$ 973.0 Mn, due to their balance of cost, performance, and thermal efficiency. The above 1200 V is growing at a positive CAGR, driven by high-voltage conversion needs in industrial and energy applications. The 600–1200 V is expected to exceed US$ 2.0 Bn.
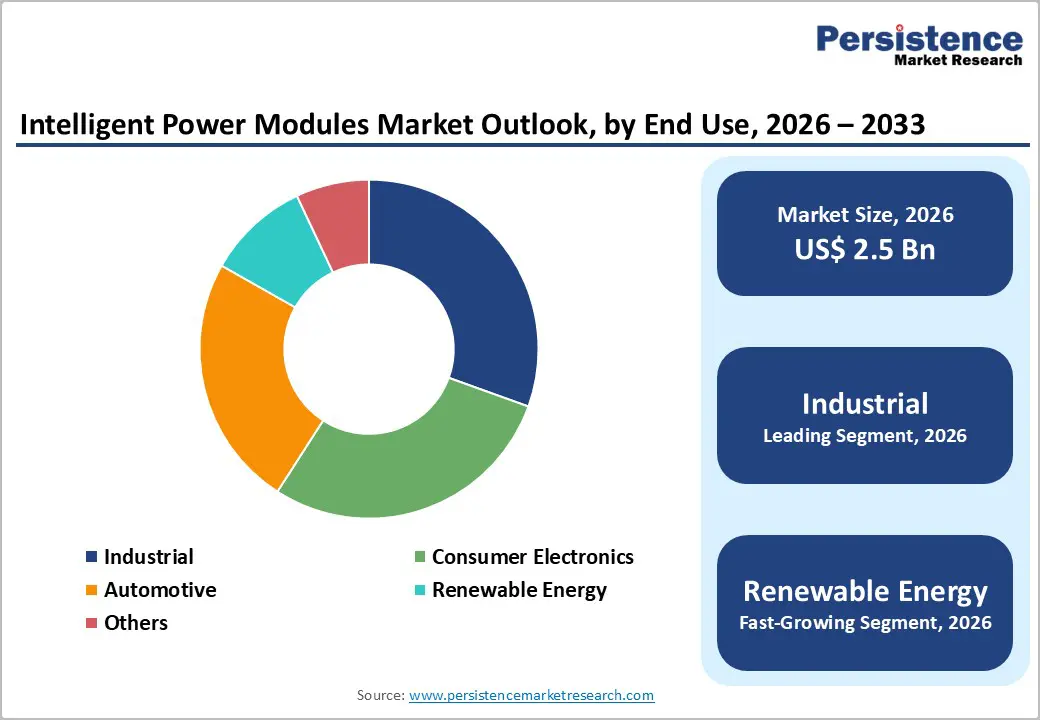
- Leading Application: Automotive holds over 30% market share in 2026, valued at ~US$ 729.7 Mn, supported by rising EV adoption, electrification, and integration with ADAS. Renewable energy is projected to grow at 15.9% CAGR, driven by solar, wind, and energy storage system deployments. Industrial applications are expected to exceed US$ 1.1 Bn by 2033, fueled by automation and robotics investments.
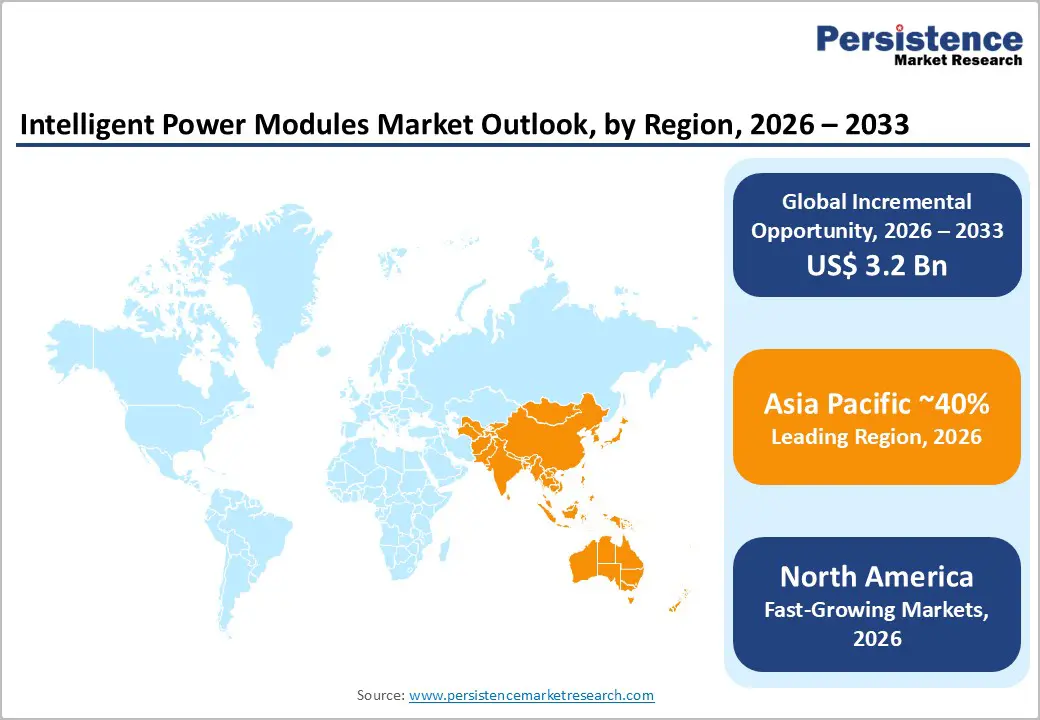
- Leading Region: Asia Pacific leads with over 38% market share in 2026, valued at ~US$ 924.3 Mn, with China contributing ~US$ 416.0 Mn. The region benefits from high EV sales, renewable installations, and electronics manufacturing.
- Fastest-Growing Region: North America holds a leading share, surpassing the value of ~ US$632.4 Mn with the U.S. alone exceeding US$ 474.3 Mn by 2026, driven by automotive electrification, industrial automation, and grid modernization. Europe accounts for ~22% share, reaching a value ~US$ 535.1 Mn, driven by government regulations, technological advancements, and investments in energy efficiency and electrification initiatives.
| Key Insights | Details |
|---|---|
|
Intelligent Power Modules Market Size (2026E) |
US$2.4 Bn |
|
Market Value Forecast (2033F) |
US$5.0 Bn |
|
Projected Growth (CAGR 2026 to 2033) |
10.9% |
|
Historical Market Growth (CAGR 2020 to 2025) |
7.1% |
Market Dynamics
Driver - Rapid electrification of transport and growth of EV power electronics
Global EV adoption is a primary demand catalyst for IPMs, particularly in traction inverters, onboard chargers, and DC-DC converters. The IEA’s Global EV Outlook indicates that electric car sales surpassed 17 million units in 2024 and were expected to reach about 20 million in 2025, raising EVs to nearly one in four cars sold globally. China continued to lead the transition, selling more than 11 million EVs in 2024, roughly comparable to total global EV sales just two years earlier. This surge directly increases demand for compact, highly efficient power modules based on IGBT and MOSFET devices for 600–1200 V architectures. As OEMs transition to 800 V platforms and higher switching frequencies, IPMs offering integrated gate drivers, protections, and thermal management become critical, supporting double-digit growth for the market through 2033.
Renewable energy expansion and grid modernization
The deployment of renewable power and grid infrastructure modernization is reinforcing IPM demand in solar inverters, wind converters, and energy storage interfaces. According to IRENA’s 2025 Renewable Capacity Statistics, global renewable power capacity grew to approximately 4.45 TW in 2024, with record additions of ~585 GW, led by ~452 GW of solar and ~113 GW of wind, and China contributed over 60 % of new installations. Renewables now account for nearly 46% of total installed capacity globally. These deployments rely on medium- and high-voltage IPMs 600–1200 V and >1200 V to enhance conversion efficiency, reliability, and grid compliance in solar inverters, wind converters, and energy storage interfaces. Investments in grid modernization in regions such as North America, where grid upgrades have exceeded, further enhance demand for intelligent, protection-rich power modules in HVDC, STATCOMs, and smart substations.
Restraint - High cost and supply chain constraints for advanced materials
Intelligent power module adoption faces challenges from the high cost of advanced power devices such as SiC and GaN, along with ongoing volatility in wafer and packaging material supply. Capacity constraints in power semiconductor fabs and limited substrate availability have resulted in elevated component prices and extended lead times, particularly for high-voltage and automotive-grade IPMs. These cost pressures hinder adoption in price-sensitive segments such as low-end appliances and cost-constrained industrial systems. Consequently, near-term market penetration is tempered, and margins remain under pressure for OEMs and Tier-1 suppliers.
Thermal management, reliability, and complex design
Higher power densities and switching frequencies increase thermal and reliability challenges for IPM-based systems. Managing junction temperature, lifetime under cyclic loads, and EMI compliance require sophisticated packaging, cooling design, and layout practices. Inadequate thermal design leads to field failures, warranty risk, or over-engineering (oversized modules and cooling) that raises total system cost. These constraints slow IPM adoption in very high-power segments or in environments with harsh operating conditions, particularly where engineering capabilities and power-electronics expertise are limited.
Opportunity - IoT-Enabled AI-Integrated Intelligent Power Modules for Predictive Maintenance and Performance Optimization
IoT-enabled intelligent power modules with embedded AI enable real-time thermal prediction, fault diagnostics, and adaptive performance optimization, addressing the rising demands for reliability and uptime in industrial and renewable energy systems. Customers increasingly value predictive maintenance and early fault warnings to minimize downtime and asset damage. IPMs integrating machine-learning-driven analytics justify 15–25% premium pricing by reducing lifecycle costs and extending system lifespan. This capability creates strong differentiation for manufacturers with advanced expertise in power electronics and software.
Microgrid and Telecommunications Infrastructure Modernization
Modernization of microgrid infrastructure is driving strong demand as distributed energy systems increasingly rely on advanced power conversion, protection, and control for solar inverters, energy storage, and islanded operations. Telecommunications infrastructure upgrades, including 5G rollout, data centers, and edge computing, are expanding the need for highly reliable power management in base stations, cooling systems, and backup power units. The convergence of renewable integration, grid resilience requirements, and always-on connectivity is pushing operators to adopt smarter, more integrated power solutions. As a result, IPM manufacturers benefit from rising volumes, higher value-added modules, and long-term replacement cycles across energy and telecom infrastructure projects.
Category-wise Analysis
Power Devices Insights
IGBT is likely to account for over 67% of the market in 2026, with segment value exceeding US$ 1.6 Bn due to their ability to efficiently handle high voltage and high current applications, making them ideal for industrial motor drives, renewable energy inverters, and electric vehicles. They provide fast switching, low conduction losses, and robust thermal performance, meeting the growing demand for energy-efficient and reliable power electronics. The need for compact, high-power density modules in automation and electrification sectors further drives IGBT adoption over alternative technologies.
MOSFETs are projected to grow at a significant rate, with revenues expected to exceed US$ 1.9 Bn in the forecast period. Their growth is driven by low to medium-voltage applications that require high switching frequencies and high efficiency, such as DC-DC converters, onboard chargers, consumer drives, and server and telecom power supplies. The shift toward compact form factors and high power density in these applications favors MOSFET-based modules, particularly those using SiC for 650–1200 V and GaN for high-frequency, lower-voltage ranges.
Voltage Rating Insights
The up to 600 V segment is likely to register over 40% share in 2026, with revenues exceeding US$ 973.0 Mn, as this voltage range meets the majority of operational needs, offering an optimal balance between performance, cost, and thermal efficiency. Their design ensures reliability, compactness, and ease of integration, making them highly suitable for a wide range of applications. The widespread compatibility with standard power electronics systems further drives their adoption.
The above 1200 V is projected to grow at the highest CAGR due to the increasing need for efficient high-voltage power conversion. These modules help reduce energy losses, improve reliability, and handle higher power levels effectively. The demand is further driven by the need for compact, integrated solutions that simplify system design while ensuring performance and durability. The 600–1200 V is expected to exceed US$ 2.0 Bn market value. These modules provide compact designs with enhanced thermal performance, meeting the need for energy-efficient and durable solutions.
Application Insights
Automotive is expected to hold over 30% share in 2026 and a value exceeding US$ 729.7 Mn driven by the rising demand for electric and hybrid vehicles, which require compact, high-efficiency power modules for motor drives and inverters. Increasing vehicle electrification and stricter emission norms are driving the need for reliable thermal management and fault-protection solutions. IPMs enable better energy efficiency, enhanced safety, and integration with advanced driver assistance systems (ADAS), making them critical for modern automotive powertrains. Growth in autonomous and connected vehicles further boosts the requirement for intelligent power management in automotive applications.
Renewable energy is expected to grow at a CAGR of 15.9% as solar, wind, and energy storage systems require highly efficient, reliable, and compact power conversion solutions. The increasing deployment of distributed energy systems and grid modernization further boosts the need for intelligent, integrated modules that optimize performance and reduce maintenance. As governments and industries push for decarbonization, the demand for IPMs in renewable energy applications will continue to rise sharply. Industrial segments are expected to exceed US$ 1.1 Bn by 2033, driven by investments in factory automation, robotics, material handling, and process industries.
Regional Insights
North America Intelligent Power Modules Market Trends
North America is a high-value, innovation-driven IPM market and is expected to hold over 26% share, reaching approximately US$ 632.4 Mn by 2026, with the U.S. alone surpassing US$ 474.3 Mn. The region benefits from strong automotive electrification, robust industrial automation, and large-scale renewable deployment. The U.S. is the dominant country, supported by a large EV ecosystem, extensive solar and wind resources, and ongoing grid modernization investments, underpinned by federal policies such as the Inflation Reduction Act and infrastructure programs that incentivize clean energy and domestic manufacturing. Regulatory frameworks emphasize efficiency, safety, and decarbonization, pushing utilities and OEMs to adopt advanced power electronics.
Asia Pacific Intelligent Power Modules Market Trends
Asia Pacific is the dominant region, holding over 38% share by 2026 and reaching around US$ 924.3 Mn, with China surpassing US$ 416.0 Mn and India expected to achieve at a CAGR of 19.5%. Asia accounts for nearly 50% of global renewable capacity and is a global manufacturing hub, supporting strong demand for IPMs in automotive, industrial, consumer, and energy applications. China leads in EV sales, renewable installations, and electronics manufacturing, generating high volume demand for IPM-based inverters, drives, and power supplies. Japan remains important through automotive, robotics, and appliance exports, while India and ASEAN countries offer high-growth potential driven by electrification and infrastructure build-out.
Europe Intelligent Power Modules Market Trends
Europe is projected to account for over 22% share by 2026, with value exceeding US$ 535.1 Mn. Germany, the U.K., France, and Spain drive demand through automotive electrification, industrial automation, and ambitious renewable targets. The EU’s Fit for 55 and Green Deal frameworks, along with stringent CO2 and efficiency regulations, reinforce IPM adoption in EVs, heat pumps, industrial drives, and renewable inverters. Germany’s strong automotive manufacturing base and industrial export orientation make it a core demand center, while Spain and other southern European markets benefit from rapid solar deployment. European manufacturers are active in high-efficiency solutions and are strong adopters of SiC and GaN devices in automotive and industrial applications.
Competitive Landscape
The IPM market is moderately consolidated, with a few global leaders holding a significant share while numerous regional players compete on cost and specialization. Companies are focusing on differentiating through high-efficiency, compact designs, and reliability for various applications. Strategic partnerships with system integrators and OEMs are leveraged to secure long-term supply agreements. Innovation in wide bandgap semiconductors and embedded diagnostic features allows companies to offer premium, value-added modules that strengthen their competitive positioning.
Key Industry Developments:
- In September 2025, Mitsubishi Electric developed a new Compact DIPIPM Intelligent Power Module series for packaged air conditioners and heat pump systems, featuring 600V ratings with 30A and 50A current options. By using reverse-conducting IGBTs, the modules reduce footprint by about 53% compared to previous Mini DIPIPM versions, enabling more compact and efficient inverter designs.
- In April 2025, Alpha and Omega Semiconductor (AOS) launched its Mega IPM7 series intelligent power modules, designed to deliver higher efficiency, power density, and reliability in a compact footprint. Optimized for BLDC motor drive applications, the new IPMs target home appliances and power tools, offering improved thermal monitoring and cost-effective inverter designs.
Companies Covered in Intelligent Power Modules Market
- STMicroelectronics
- Mitsubishi Electric Corporation
- Infineon Technologies
- Renesas Electronics Corporation
- Fuji Electric
- Semikron
- Texas Instruments
- ROHM Semiconductor
- ON Semiconductor
- NXP Semiconductors
- Sensitron Semiconductor
- Toshiba Corporation
- Others
Frequently Asked Questions
The global intelligent power modules market is projected to be valued at US$2.4 Bn in 2026.
The growing need for energy-efficient, compact, and reliable power management solutions that enhance performance and reduce operational losses is a key driver of the market.
The market is expected to witness a CAGR of 10.9% from 2026 to 2033.
Rising microgrids and telecom infrastructure modernization, where their compact design and embedded diagnostics enhance power reliability and system resilience, are creating strong growth opportunities.
STMicroelectronics, Mitsubishi Electric Corporation, Infineon Technologies, Renesas Electronics Corporation, Fuji Electric, Semikron are among the leading key players.


