


- Executive Summary
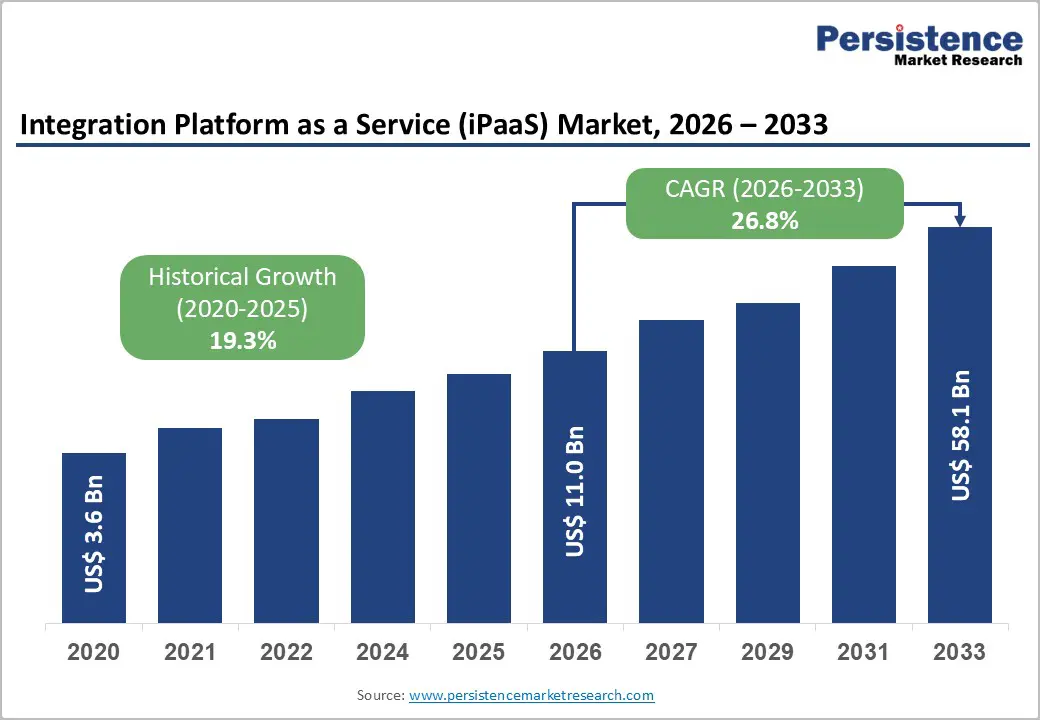
- Global Integration Platform as a Service (iPaaS) Market Snapshot, 2026 and 2033
- Market Opportunity Assessment, 2026 - 2033, US$ Mn
- Key Market Trends
- Future Market Projections
- Premium Market Insights
- Industry Developments and Key Market Events
- PMR Analysis and Recommendations
- Market Overview
- Market Scope and Definition
- Market Dynamics
- Drivers
- Restraints
- Opportunity
- Challenges
- Key Trends
- Product Lifecycle Analysis
- Global Parent Market Overview
- Integration Platform as a Service (iPaaS) Market: Value Chain
- List of Raw Deployment Mode Supplier
- List of Manufacturers
- List of Distributors
- List of End Use Industry Industries
- Profitability Analysis
- Forecast Factors - Relevance and Impact
- Covid-19 Impact Assessment
- PESTLE Analysis
- Porter Five Force’s Analysis
- Geopolitical Tensions: Market Impact
- Regulatory and Deployment Mode Landscape
- Macro-Economic Factors
- Global Sectorial Outlook
- Global GDP Growth Outlook
- Other Macro-economic Factors
- Price Trend Analysis, 2020 - 2033
- Key Highlights
- Key Factors Impacting Product Prices
- Prices By Service Type /Deployment Mode/Organization Size
- Regional Prices and Product Preferences
- Global Integration Platform as a Service (iPaaS) Market Outlook: Historical (2020 - 2025) and Forecast (2026 - 2033)
- Key Highlights
- Market Size and Y-o-Y Growth
- Absolute $ Opportunity
- Market Size (US$ Mn) Analysis and Forecast
- Historical Market Size Analysis, 2020-2025
- Current Market Size Forecast, 2020-2033
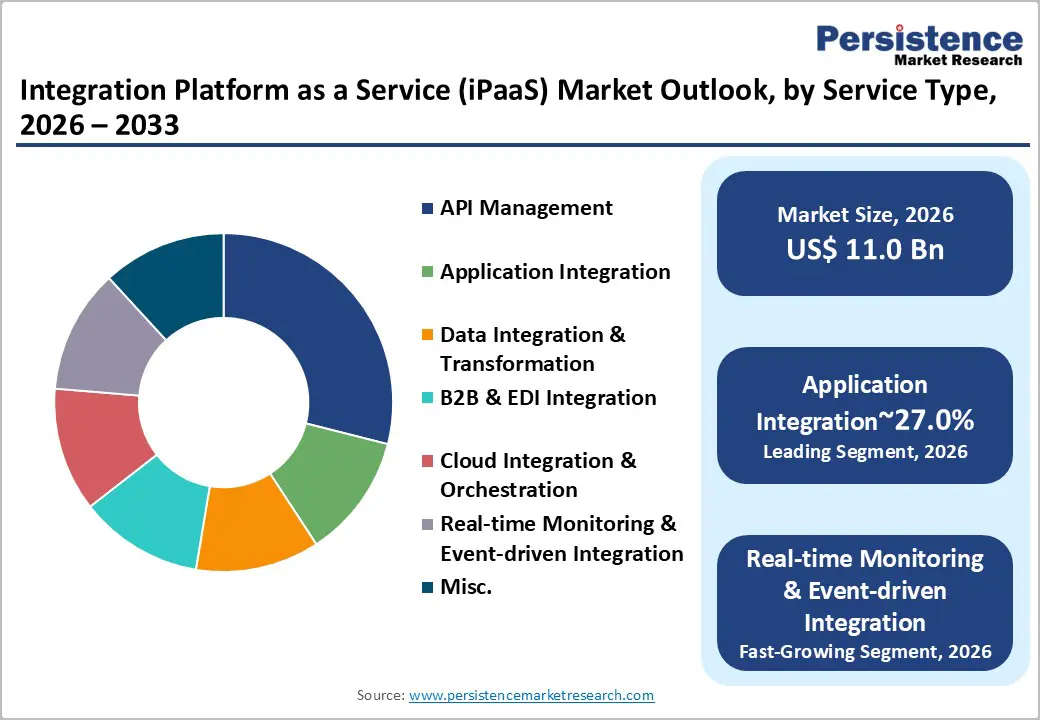
- Global Integration Platform as a Service (iPaaS) Market Outlook: Type
- Introduction / Key Findings
- Historical Market Size (US$ Mn) Analysis By Service Type , 2020 - 2025
- Current Market Size (US$ Mn) Forecast By Service Type , 2026 - 2033
- API Management
- Application Integration
- Data Integration & Transformation
- B2B & EDI Integration
- Cloud Integration & Orchestration
- Real-time Monitoring & Event-driven Integration
- Others
- Market Attractiveness Analysis: Service Type
- Global Integration Platform as a Service (iPaaS) Market Outlook: Deployment Mode
- Introduction / Key Findings
- Historical Market Size (US$ Mn) Analysis By Deployment Mode, 2020 - 2025
- Current Market Size (US$ Mn) Forecast By Deployment Mode, 2026 - 2033
- Public Cloud
- Private Cloud
- Hybrid iPaaS
- Market Attractiveness Analysis: Deployment Mode
- Global Integration Platform as a Service (iPaaS) Market Outlook Organization Size
- Introduction / Key Findings
- Historical Market Size (US$ Mn) Analysis By Organization Size, 2020 - 2025
- Current Market Size (US$ Mn) Forecast By Organization Size, 2026 - 2033
- Small & Medium Enterprises (SMEs)
- Large Enterprises
- Market Attractiveness Analysis: Organization Size
- Global Integration Platform as a Service (iPaaS) Market Outlook End Use Industry
- Introduction / Key Findings
- Historical Market Size (US$ Mn) Analysis By End Use Industry, 2020 - 2025
- Current Market Size (US$ Mn) Forecast By End Use Industry, 2026 - 2033
- Banking, Financial Services & Insurance (BFSI)
- Healthcare & Life Sciences
- Retail & E-commerce
- Manufacturing
- Telecommunications
- Government & Public Sector
- Transportation & Logistics
- Energy & Utilities
- IT & Software
- Misc.
- Market Attractiveness Analysis: End Use Industry
- Key Highlights
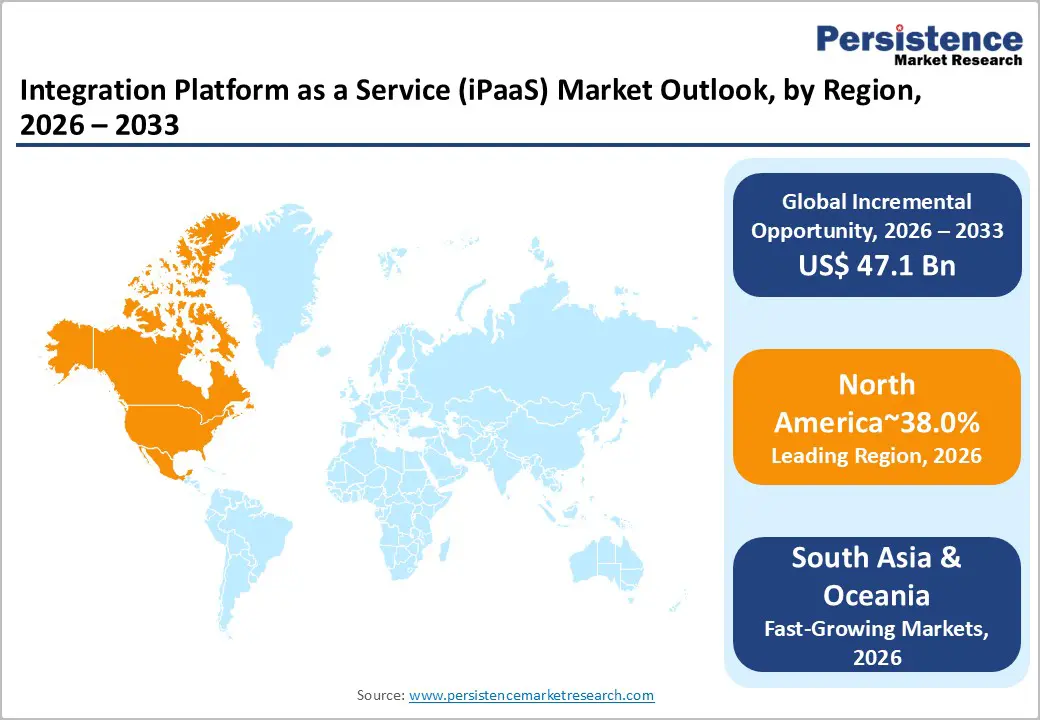
- Global Integration Platform as a Service (iPaaS) Market Outlook Region
- Key Highlights
- Historical Market Size (US$ Mn) Analysis By Region, 2020 - 2025
- Current Market Size (US$ Mn) Forecast By Region, 2026 - 2033
- North America
- Europe
- East Asia
- South Asia and Oceania
- Latin America
- Middle East & Africa
- Market Attractiveness Analysis: Region
- North America Integration Platform as a Service (iPaaS) Market Outlook: Historical (2020 - 2025) and Forecast (2026 - 2033)
- Key Highlights
- Pricing Analysis
- Historical Market Size (US$ Mn) Analysis By Market, 2020 - 2025
- By Country
- By Service Type
- By Deployment Mode
- By Organization Size
- By End Use Industry
- Current Market Size (US$ Mn) Forecast By Country, 2026 - 2033
- U.S.
- Canada
- Current Market Size (US$ Mn) Forecast By Service Type , 2026 - 2033
- API Management
- Application Integration
- Data Integration & Transformation
- B2B & EDI Integration
- Cloud Integration & Orchestration
- Real-time Monitoring & Event-driven Integration
- Others
- Current Market Size (US$ Mn) Forecast By Deployment Mode, 2026 - 2033
- Public Cloud
- Private Cloud
- Hybrid iPaaS
- Current Market Size (US$ Mn) Forecast By Organization Size, 2026 - 2033
- Small & Medium Enterprises (SMEs)
- Large Enterprises
- Current Market Size (US$ Mn) Forecast By End Use Industry, 2026 - 2033
- Banking, Financial Services & Insurance (BFSI)
- Healthcare & Life Sciences
- Retail & E-commerce
- Manufacturing
- Telecommunications
- Government & Public Sector
- Transportation & Logistics
- Energy & Utilities
- IT & Software
- Misc.
- Market Attractiveness Analysis
- Europe Integration Platform as a Service (iPaaS) Market Outlook: Historical (2020 - 2025) and Forecast (2026 - 2033)
- Key Highlights
- Pricing Analysis
- Historical Market Size (US$ Mn) Analysis By Market, 2020 - 2025
- By Country
- By Service Type
- By Deployment Mode
- By Organization Size
- By End Use Industry
- By Current Market Size (US$ Mn) Forecast By Country, 2026 - 2033
- Germany
- Italy
- France
- U.K.
- Spain
- Russia
- Türkiye
- Rest of Europe
- Current Market Size (US$ Mn) Forecast By Service Type , 2026 - 2033
- API Management
- Application Integration
- Data Integration & Transformation
- B2B & EDI Integration
- Cloud Integration & Orchestration
- Real-time Monitoring & Event-driven Integration
- Others
- Current Market Size (US$ Mn) Forecast By Deployment Mode, 2026 - 2033
- Public Cloud
- Private Cloud
- Hybrid iPaaS
- Current Market Size (US$ Mn) Forecast By Organization Size, 2026 - 2033
- Small & Medium Enterprises (SMEs)
- Large Enterprises
- Current Market Size (US$ Mn) Forecast By End Use Industry, 2026 - 2033
- Banking, Financial Services & Insurance (BFSI)
- Healthcare & Life Sciences
- Retail & E-commerce
- Manufacturing
- Telecommunications
- Government & Public Sector
- Transportation & Logistics
- Energy & Utilities
- IT & Software
- Misc.
- Market Attractiveness Analysis
- East Asia Integration Platform as a Service (iPaaS) Market Outlook: Historical (2020 - 2025) and Forecast (2026 - 2033)
- Key Highlights
- Pricing Analysis
- Historical Market Size (US$ Mn) Analysis By Market, 2020 - 2025
- By Country
- By Service Type
- By Deployment Mode
- By Organization Size
- By End Use Industry
- Current Market Size (US$ Mn) Forecast By Country, 2026 - 2033
- China
- Japan
- South Korea
- Current Market Size (US$ Mn) Forecast By Service Type , 2026 - 2033
- API Management
- Application Integration
- Data Integration & Transformation
- B2B & EDI Integration
- Cloud Integration & Orchestration
- Real-time Monitoring & Event-driven Integration
- Others
- Current Market Size (US$ Mn) Forecast By Deployment Mode, 2026 - 2033
- Public Cloud
- Private Cloud
- Hybrid iPaaS
- Current Market Size (US$ Mn) Forecast By Organization Size, 2026 - 2033
- Small & Medium Enterprises (SMEs)
- Large Enterprises
- Current Market Size (US$ Mn) Forecast By End Use Industry, 2026 - 2033
- Banking, Financial Services & Insurance (BFSI)
- Healthcare & Life Sciences
- Retail & E-commerce
- Manufacturing
- Telecommunications
- Government & Public Sector
- Transportation & Logistics
- Energy & Utilities
- IT & Software
- Misc.
- Market Attractiveness Analysis
- South Asia & Oceania Integration Platform as a Service (iPaaS) Market Outlook: Historical (2020 - 2025) and Forecast (2026 - 2033)
- Key Highlights
- Pricing Analysis
- Historical Market Size (US$ Mn) Analysis By Market, 2020 - 2025
- By Country
- By Service Type
- By Deployment Mode
- By Organization Size
- By End Use Industry
- Current Market Size (US$ Mn) Forecast By Country, 2026 - 2033
- India
- Southeast Asia
- ANZ
- Rest of South Asia & Oceania
- Current Market Size (US$ Mn) Forecast By Service Type , 2026 - 2033
- API Management
- Application Integration
- Data Integration & Transformation
- B2B & EDI Integration
- Cloud Integration & Orchestration
- Real-time Monitoring & Event-driven Integration
- Others
- Current Market Size (US$ Mn) Forecast By Deployment Mode, 2026 - 2033
- Public Cloud
- Private Cloud
- Hybrid iPaaS
- Current Market Size (US$ Mn) Forecast By Organization Size, 2026 - 2033
- Small & Medium Enterprises (SMEs)
- Large Enterprises
- Current Market Size (US$ Mn) Forecast By End Use Industry, 2026 - 2033
- Banking, Financial Services & Insurance (BFSI)
- Healthcare & Life Sciences
- Retail & E-commerce
- Manufacturing
- Telecommunications
- Government & Public Sector
- Transportation & Logistics
- Energy & Utilities
- IT & Software
- Misc.
- Market Attractiveness Analysis
- Latin America Integration Platform as a Service (iPaaS) Market Outlook: Historical (2020 - 2025) and Forecast (2026 - 2033)
- Key Highlights
- Pricing Analysis
- Historical Market Size (US$ Mn) Analysis By Market, 2020 - 2025
- By Country
- By Service Type
- By Deployment Mode
- By Organization Size
- By End Use Industry
- Current Market Size (US$ Mn) Forecast By Country, 2026 - 2033
- Brazil
- Mexico
- Rest of Latin America
- Current Market Size (US$ Mn) Forecast By Service Type , 2026 - 2033
- API Management
- Application Integration
- Data Integration & Transformation
- B2B & EDI Integration
- Cloud Integration & Orchestration
- Real-time Monitoring & Event-driven Integration
- Others
- Current Market Size (US$ Mn) Forecast By Deployment Mode, 2026 - 2033
- Public Cloud
- Private Cloud
- Hybrid iPaaS
- Current Market Size (US$ Mn) Forecast By Organization Size, 2026 - 2033
- Small & Medium Enterprises (SMEs)
- Large Enterprises
- Current Market Size (US$ Mn) Forecast By End Use Industry, 2026 - 2033
- Banking, Financial Services & Insurance (BFSI)
- Healthcare & Life Sciences
- Retail & E-commerce
- Manufacturing
- Telecommunications
- Government & Public Sector
- Transportation & Logistics
- Energy & Utilities
- IT & Software
- Misc.
- Market Attractiveness Analysis
- Middle East & Africa Integration Platform as a Service (iPaaS) Market Outlook: Historical (2020 - 2025) and Forecast (2026 - 2033)
- Key Highlights
- Pricing Analysis
- Historical Market Size (US$ Mn) Analysis By Market, 2020 - 2025
- By Country
- By Service Type
- By Deployment Mode
- By Organization Size
- By End Use Industry
- Current Market Size (US$ Mn) Forecast By Country, 2026 - 2033
- GCC Countries
- South Africa
- Northern Africa
- Rest of MEA
- Current Market Size (US$ Mn) Forecast By Service Type , 2026 - 2033
- API Management
- Application Integration
- Data Integration & Transformation
- B2B & EDI Integration
- Cloud Integration & Orchestration
- Real-time Monitoring & Event-driven Integration
- Others
- Current Market Size (US$ Mn) Forecast By Deployment Mode, 2026 - 2033
- Public Cloud
- Private Cloud
- Hybrid iPaaS
- Current Market Size (US$ Mn) Forecast By Organization Size, 2026 - 2033
- Small & Medium Enterprises (SMEs)
- Large Enterprises
- Current Market Size (US$ Mn) Forecast By End Use Industry, 2026 - 2033
- Banking, Financial Services & Insurance (BFSI)
- Healthcare & Life Sciences
- Retail & E-commerce
- Manufacturing
- Telecommunications
- Government & Public Sector
- Transportation & Logistics
- Energy & Utilities
- IT & Software
- Misc.
- Market Attractiveness Analysis
- Competition Landscape
- Market Share Analysis, 2025
- Market Structure
- Competition Intensity Mapping By Market
- Competition Dashboard
- Apparent Production Capacity
- Company Profiles (Details - Overview, Financials, Strategy, Recent Developments)
- Informatica Inc.
- Overview
- Segments and Products
- Key Financials
- Market Developments
- Market Strategy
- Boomi, Inc. (a subsidiary of Dell Technologies)
- SAP SE
- Oracle Corporation
- Salesforce, Inc. (MuleSoft is a subsidiary of Salesforce)
- International Business Machines Corporation
- Microsoft Corporation
- Workato, Inc.
- SnapLogic, Inc.
- TIBCO Software Inc.
- Software AG
- Jitterbit, Inc.
- Zapier, Inc.
- Talend, Inc.
- Celigo, Inc.
- Informatica Inc.
- Appendix
- Research Methodology
- Research Assumptions
- Acronyms and Abbreviations

Loading page data
Please wait a moment


