


- Executive Summary
- Global Integrated Facility Management Market Snapshot, 2026 and 2033
- Market Opportunity Assessment, 2026 - 2033, US$ Mn
- Key Market Trends
- Future Market Projections
- Premium Market Insights
- Industry Developments and Key Market Events
- PMR Analysis and Recommendations
- Market Overview
- Market Scope and Definition
- Market Dynamics
- Drivers
- Restraints
- Opportunity
- Challenges
- Key Trends
- Product Lifecycle Analysis
- Integrated Facility Management Market: Value Chain
- List of Raw Material Suppliers
- List of Manufacturers
- List of Distributors
- Profitability Analysis
- Forecast Factors - Relevance and Impact
- Covid-19 Impact Assessment
- PESTLE Analysis
- Porter Five Force’s Analysis
- Geopolitical Tensions: Market Impact
- Regulatory and Deployment ModelLandscape
- Macro-Economic Factors
- Global Sectorial Outlook
- Global GDP Growth Outlook
- Global Parent Market Overview
- Price Trend Analysis, 2019 - 2032
- Key Highlights
- Key Factors Impacting Product Prices
- Prices By Solution Type/Composition/Deployment Model
- Regional Prices and Product Preferences
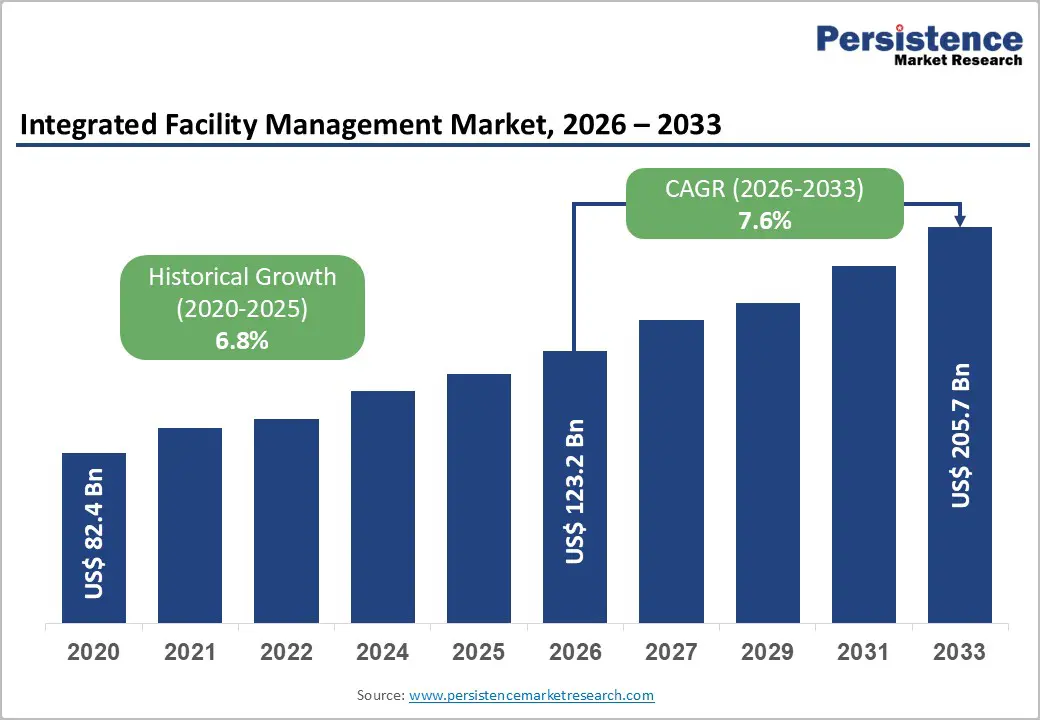
- Global Integrated Facility Management Market Outlook: Historical (2020 - 2025) and Forecast (2026 - 2033)
- Key Highlights
- Market Size and Y-o-Y Growth
- Absolute $ Opportunity
- Market Size (US$ Mn) Analysis and Forecast
- Historical Market Size Analysis, 2019-2025
- Current Market Size Forecast, 2025-2033
- Global Integrated Facility Management Market Outlook: Solution Type
- Introduction / Key Findings
- Historical Market Size (US$ Mn) Analysis By Solution Type, 2020 - 2025
- Current Market Size (US$ Mn) Forecast By Solution Type, 2026 - 2033
- Integrated Facility Management Platforms
- Serivces
- Market Attractiveness Analysis: Solution Type
- Global Integrated Facility Management Market Outlook: Deployment Model
- Introduction / Key Findings
- Historical Market Size (US$ Mn) Analysis By Deployment Model, 2020 - 2025
- Current Market Size (US$ Mn) Forecast By Deployment Model, 2026 - 2033
- In-House IFM
- Outsourced / Third-Party IFM
- Market Attractiveness Analysis: Deployment Model
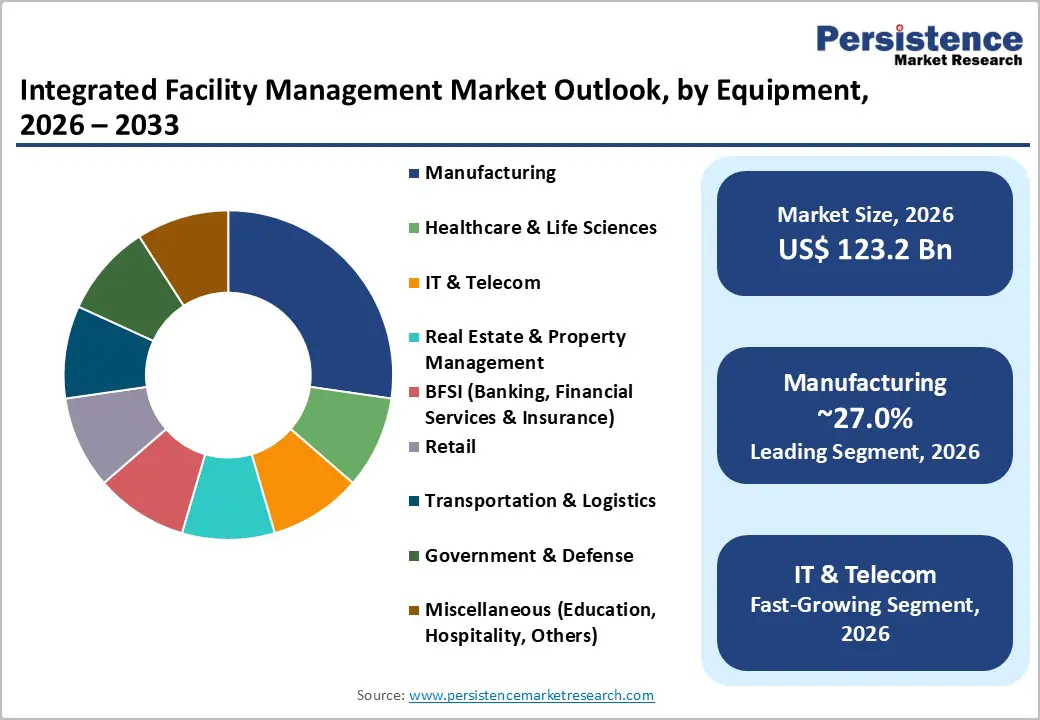
- Global Integrated Facility Management Market Outlook: End Use Industry
- Introduction / Key Findings
- Historical Market Size (US$ Mn) Analysis By End Use Industry, 2020 - 2025
- Current Market Size (US$ Mn) Forecast By End Use Industry, 2026 - 2033
- IT & Telecom
- BFSI (Banking, Financial Services & Insurance)
- Healthcare & Life Sciences
- Retail
- Manufacturing
- Transportation & Logistics
- Real Estate & Property Management
- Government & Defense
- Misc.
- Market Attractiveness Analysis: End Use Industry
- Key Highlights
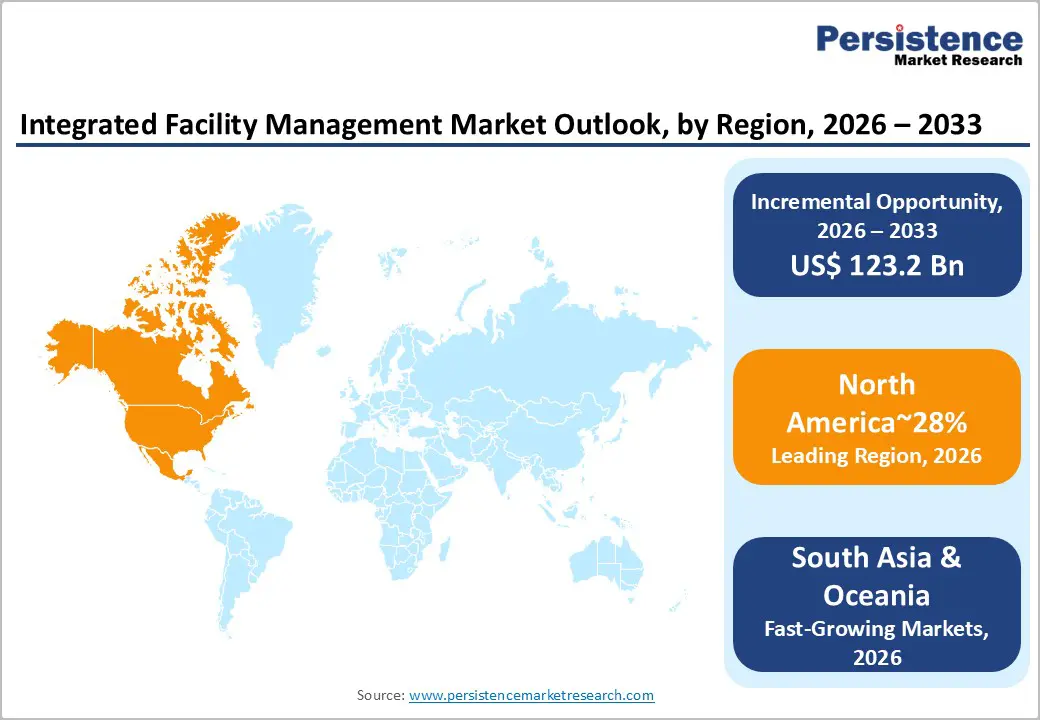
- Global Integrated Facility Management Market Outlook: Region
- Key Highlights
- Historical Market Size (US$ Mn) Analysis By Region, 2020 - 2025
- Current Market Size (US$ Mn) Forecast By Region, 2026 - 2033
- North America
- Europe
- East Asia
- South Asia and Oceania
- Latin America
- Middle East & Africa
- Market Attractiveness Analysis: Region
- North America Integrated Facility Management Market Outlook: Historical (2020 - 2025) and Forecast (2026 - 2033)
- Key Highlights
- Pricing Analysis
- Historical Market Size (US$ Mn) Analysis By Market, 2020 - 2025
- By Country
- By Solution Type
- By Deployment Model
- Current Market Size (US$ Mn) Forecast By Country, 2026 - 2033
- U.S.
- Canada
- Current Market Size (US$ Mn) Forecast By Solution Type, 2026 - 2033
- Equipment Type
- HVAC Systems
- Lighting Systems
- Renewable Energy Systems
- Energy Storage Systems
- Building Envelope Solutions
- Others
- Solutions and Services
- Software
- Designing Services
- Consulting Services
- Equipment Type
- Current Market Size (US$ Mn) Forecast By Deployment Model, 2026 - 2033
- Residential
- Commercial
- Industrial / Manufacturing
- Market Attractiveness Analysis
- Europe Integrated Facility Management Market Outlook: Historical (2020 - 2025) and Forecast (2026 - 2033)
- Key Highlights
- Pricing Analysis
- Historical Market Size (US$ Mn) Analysis By Market, 2020 - 2025
- By Country
- By Solution Type
- By Deployment Model
- By End Use Industry
- Current Market Size (US$ Mn) Forecast By Country, 2026 - 2033
- Germany
- France
- U.K.
- Italy
- Spain
- Russia
- Rest of Europe
- Current Market Size (US$ Mn) Forecast By Solution Type, 2026 - 2033
- Integrated Facility Management Platforms
- Services
- Current Market Size (US$ Mn) Forecast By Deployment Model, 2026 - 2033
- In-House IFM
- Outsourced / Third-Party IFM
- Current Market Size (US$ Mn) Forecast By Deployment Model, 2026 - 2033
- IT & Telecom
- BFSI (Banking, Financial Services & Insurance)
- Healthcare & Life Sciences
- Retail
- Manufacturing
- Transportation & Logistics
- Real Estate & Property Management
- Government & Defense
- Misc.
- Market Attractiveness Analysis
- East Asia Integrated Facility Management Market Outlook: Historical (2020 - 2025) and Forecast (2026 - 2033)
- Key Highlights
- Pricing Analysis
- Historical Market Size (US$ Mn) Analysis By Market, 2020 - 2025
- By Country
- By Solution Type
- By Deployment Model
- By End Use Industry
- Current Market Size (US$ Mn) Forecast By Country, 2026 - 2033
- China
- Japan
- South Korea
- Current Market Size (US$ Mn) Forecast By Solution Type, 2026 - 2033
- Integrated Facility Management Platforms
- Services
- Current Market Size (US$ Mn) Forecast By Deployment Model, 2026 - 2033
- In-House IFM
- Outsourced / Third-Party IFM
- Current Market Size (US$ Mn) Forecast By Deployment Model, 2026 - 2033
- IT & Telecom
- BFSI (Banking, Financial Services & Insurance)
- Healthcare & Life Sciences
- Retail
- Manufacturing
- Transportation & Logistics
- Real Estate & Property Management
- Government & Defense
- Misc.
- Market Attractiveness Analysis
- South Asia & Oceania Integrated Facility Management Market Outlook: Historical (2020 - 2025) and Forecast (2026 - 2033)
- Key Highlights
- Pricing Analysis
- Historical Market Size (US$ Mn) Analysis By Market, 2020 - 2025
- By Country
- By Solution Type
- By Deployment Model
- By End Use Industry
- Current Market Size (US$ Mn) Forecast By Country, 2026 - 2033
- India
- Southeast Asia
- ANZ
- Rest of South Asia & Oceania
- Current Market Size (US$ Mn) Forecast By Solution Type, 2026 - 2033
- Integrated Facility Management Platforms
- Services
- Current Market Size (US$ Mn) Forecast By Deployment Model, 2026 - 2033
- In-House IFM
- Outsourced / Third-Party IFM
- Current Market Size (US$ Mn) Forecast By Deployment Model, 2026 - 2033
- IT & Telecom
- BFSI (Banking, Financial Services & Insurance)
- Healthcare & Life Sciences
- Retail
- Manufacturing
- Transportation & Logistics
- Real Estate & Property Management
- Government & Defense
- Misc.
- Market Attractiveness Analysis
- Latin America Integrated Facility Management Market Outlook: Historical (2020 - 2025) and Forecast (2026 - 2033)
- Key Highlights
- Pricing Analysis
- Historical Market Size (US$ Mn) Analysis By Market, 2020 - 2025
- By Country
- By Solution Type
- By Deployment Model
- By End Use Indsutry
- Current Market Size (US$ Mn) Forecast By Country, 2026 - 2033
- Brazil
- Mexico
- Rest of Latin America
- Current Market Size (US$ Mn) Forecast By Solution Type, 2026 - 2033
- Integrated Facility Management Platforms
- Services
- Current Market Size (US$ Mn) Forecast By Deployment Model, 2026 - 2033
- In-House IFM
- Outsourced / Third-Party IFM
- Current Market Size (US$ Mn) Forecast By Deployment Model, 2026 - 2033
- IT & Telecom
- BFSI (Banking, Financial Services & Insurance)
- Healthcare & Life Sciences
- Retail
- Manufacturing
- Transportation & Logistics
- Real Estate & Property Management
- Government & Defense
- Misc.
- Market Attractiveness Analysis
- Middle East & Africa Integrated Facility Management Market Outlook: Historical (2020 - 2025) and Forecast (2026 - 2033)
- Key Highlights
- Pricing Analysis
- Historical Market Size (US$ Mn) Analysis By Market, 2020 - 2025
- By Country
- By Solution Type
- By Deployment Model
- By End Use Industry
- Current Market Size (US$ Mn) Forecast By Country, 2026 - 2033
- GCC
- South Africa
- Northern Africa
- Rest of Middle East & Africa
- Current Market Size (US$ Mn) Forecast By Solution Type, 2026 - 2033
- Integrated Facility Management Platforms
- Services
- Current Market Size (US$ Mn) Forecast By Deployment Model, 2026 - 2033
- In-House IFM
- Outsourced / Third-Party IFM
- Current Market Size (US$ Mn) Forecast By Deployment Model, 2026 - 2033
- IT & Telecom
- BFSI (Banking, Financial Services & Insurance)
- Healthcare & Life Sciences
- Retail
- Manufacturing
- Transportation & Logistics
- Real Estate & Property Management
- Government & Defense
- Misc.
- Market Attractiveness Analysis
- Competition Landscape
- Market Share Analysis, 2025
- Market Structure
- Competition Intensity Mapping By Market
- Competition Dashboard
- Apparent Production Capacity
- Company Profiles (Details - Overview, Financials, Strategy, Recent Developments)
- CBRE Group Inc
- Overview
- Segments and Products
- Key Financials
- Market Developments
- Market Strategy
- Jones Lang LaSalle IP Inc.
- Sodexo Inc.
- ISS Facility Service
- CBRE Group Inc
- EMCOR Facility Services
- Facilicom
- CBM Qatar LLC.
- Compass Group PLC
- Cushman and Wakefield
- AHI Facility Services Inc
- CBRE Group Inc
- Appendix
- Research Methodology
- Research Assumptions
- Acronyms and Abbreviations

Loading page data
Please wait a moment


