


- Executive Summary
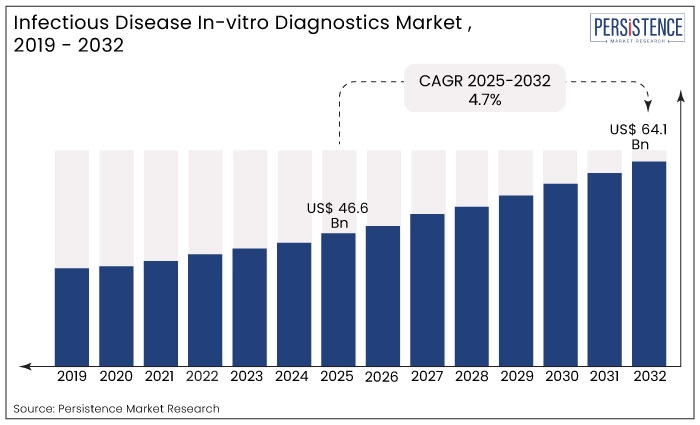
- Global Infectious Disease In-vitro Diagnostics Market Snapshot, 2025 and 2032
- Market Opportunity Assessment, 2025 – 2032, US$ Mn
- Key Market Trends
- Future Market Projections
- Premium Market Insights
- Industry Developments and Key Market Events
- PMR Analysis and Recommendations
- Market Overview
- Market Scope and Definition
- Market Dynamics
- Drivers
- Restraints
- Opportunity
- Challenges
- Key Trends
- Macro-Economic Factors
- Global Sectorial Outlook
- Global GDP Growth Outlook
- COVID-19 Impact Analysis
- Forecast Factors – Relevance and Impact
- Value Added Insights
- Regulatory Landscape
- Product Adoption Analysis
- Value Chain Analysis
- Key Deals and Mergers
- PESTLE Analysis
- Porter’s Five Force Analysis
- Global Infectious Disease In-vitro Diagnostics Market Outlook:
- Key Highlights
- Market Size (US$ Mn) and Y-o-Y Growth
- Absolute $ Opportunity
- Market Size (US$ Mn) Analysis and Forecast
- Historical Market Size (US$ Mn) Analysis, 2019-2024
- Current Market Size (US$ Mn) Analysis and Forecast, 2025–2032
- Global Infectious Disease In-vitro Diagnostics Market Outlook: Product Type
- Introduction / Key Findings
- Historical Market Size (US$ Mn) Analysis, By Product Type, 2019 – 2024
- Current Market Size (US$ Mn) Analysis and Forecast, By Product Type, 2025 – 2032
- Instruments
- Reagents
- Software and Services
- Market Attractiveness Analysis: Product Type
- Global Infectious Disease In-vitro Diagnostics Market Outlook: Technology
- Introduction / Key Findings
- Historical Market Size (US$ Mn) Analysis, By Technology, 2019 – 2024
- Current Market Size (US$ Mn) Analysis and Forecast, By Technology, 2025 – 2032
- Immunoassay
- Molecular Diagnostics
- Microbiology
- Others
- Market Attractiveness Analysis: Technology
- Global Infectious Disease In-vitro Diagnostics Market Outlook: Application
- Introduction / Key Findings
- Historical Market Size (US$ Mn) Analysis, By Application, 2019 – 2024
- Current Market Size (US$ Mn) Analysis and Forecast, By Application, 2025 – 2032
- MRSA
- Clostridium Difficile
- Respiratory Virus
- TB and Drug-resistant TB
- Gonorrhea
- HPV
- HIV
- Hepatitis C
- Hepatitis B
- COVID-19
- Others
- Market Attractiveness Analysis: Application
- Global Infectious Disease In-vitro Diagnostics Market Outlook: End User
- Introduction / Key Findings
- Historical Market Size (US$ Mn) Analysis, By End User, 2019 – 2024
- Current Market Size (US$ Mn) Analysis and Forecast, By End User, 2025 – 2032
- Point-of-care
- Central Laboratories
- Others
- Market Attractiveness Analysis: End User
- Key Highlights
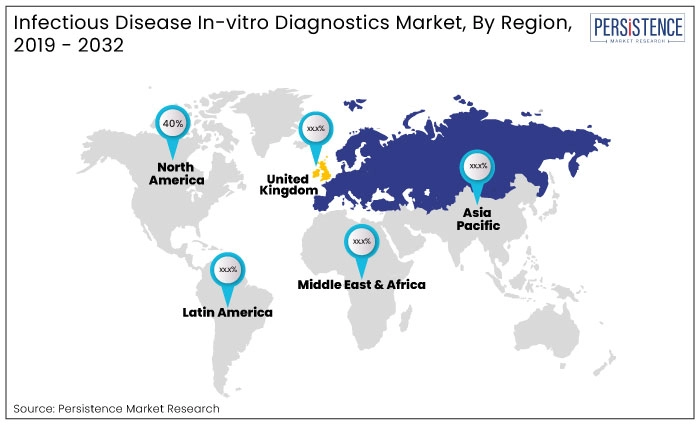
- Global Infectious Disease In-vitro Diagnostics Market Outlook: Region
- Key Highlights
- Historical Market Size (US$ Mn) Analysis, By Region, 2019 – 2024
- Current Market Size (US$ Mn) Analysis and Forecast, By Region, 2025 – 2032
- North America
- Europe
- East Asia
- South Asia and Oceania
- Latin America
- Middle East & Africa
- Market Attractiveness Analysis: Region
- North America Infectious Disease In-vitro Diagnostics Market Outlook:
- Key Highlights
- Historical Market Size (US$ Mn) Analysis, By Market, 2019 – 2024
- By Country
- By Product Type
- By Technology
- By Application
- By End User
- Current Market Size (US$ Mn) Analysis and Forecast, By Country, 2025 – 2032
- U.S.
- Canada
- Current Market Size (US$ Mn) Analysis and Forecast, By Product Type, 2025 – 2032
- Instruments
- Reagents
- Software and Services
- Current Market Size (US$ Mn) Analysis and Forecast, By Technology, 2025 – 2032
- Immunoassay
- Molecular Diagnostics
- Microbiology
- Others
- Current Market Size (US$ Mn) Analysis and Forecast, By Application, 2025 – 2032
- MRSA
- Clostridium Difficile
- Respiratory Virus
- TB and Drug-resistant TB
- Gonorrhea
- HPV
- HIV
- Hepatitis C
- Hepatitis B
- COVID-19
- Others
- Current Market Size (US$ Mn) Analysis and Forecast, By End User, 2025 – 2032
- Point-of-care
- Central Laboratories
- Others
- Market Attractiveness Analysis
- Europe Infectious Disease In-vitro Diagnostics Market Outlook:
- Key Highlights
- Historical Market Size (US$ Mn) Analysis, By Market, 2019 – 2024
- By Country
- By Product Type
- By Technology
- By Application
- By End User
- Current Market Size (US$ Mn) Analysis and Forecast, By Country, 2025 – 2032
- Germany
- France
- U.K.
- Italy
- Spain
- Russia
- Rest of Europe
- Current Market Size (US$ Mn) Analysis and Forecast, By Product Type, 2025 – 2032
- Instruments
- Reagents
- Software and Services
- Current Market Size (US$ Mn) Analysis and Forecast, By Technology, 2025 – 2032
- Immunoassay
- Molecular Diagnostics
- Microbiology
- Others
- Current Market Size (US$ Mn) Analysis and Forecast, By Application, 2025 – 2032
- MRSA
- Clostridium Difficile
- Respiratory Virus
- TB and Drug-resistant TB
- Gonorrhea
- HPV
- HIV
- Hepatitis C
- Hepatitis B
- COVID-19
- Others
- Current Market Size (US$ Mn) Analysis and Forecast, By End User, 2025 – 2032
- Point-of-care
- Central Laboratories
- Others
- Market Attractiveness Analysis
- East Asia Infectious Disease In-vitro Diagnostics Market Outlook:
- Key Highlights
- Historical Market Size (US$ Mn) Analysis, By Market, 2019 – 2024
- By Country
- By Product Type
- By Technology
- By Application
- By End User
- Current Market Size (US$ Mn) Analysis and Forecast, By Country, 2025 – 2032
- China
- Japan
- South Korea
- Current Market Size (US$ Mn) Analysis and Forecast, By Product Type, 2025 – 2032
- Instruments
- Reagents
- Software and Services
- Current Market Size (US$ Mn) Analysis and Forecast, By Technology, 2025 – 2032
- Immunoassay
- Molecular Diagnostics
- Microbiology
- Others
- Current Market Size (US$ Mn) Analysis and Forecast, By Application, 2025 – 2032
- MRSA
- Clostridium Difficile
- Respiratory Virus
- TB and Drug-resistant TB
- Gonorrhea
- HPV
- HIV
- Hepatitis C
- Hepatitis B
- COVID-19
- Others
- Current Market Size (US$ Mn) Analysis and Forecast, By End User, 2025 – 2032
- Point-of-care
- Central Laboratories
- Others
- Market Attractiveness Analysis
- South Asia & Oceania Infectious Disease In-vitro Diagnostics Market Outlook:
- Key Highlights
- Historical Market Size (US$ Mn) Analysis, By Market, 2019 – 2024
- By Country
- By Product Type
- By Technology
- By Application
- By End User
- Current Market Size (US$ Mn) Analysis and Forecast, By Country, 2025 – 2032
- India
- Southeast Asia
- ANZ
- Rest of South Asia & Oceania
- Current Market Size (US$ Mn) Analysis and Forecast, By Product Type, 2025 – 2032
- Instruments
- Reagents
- Software and Services
- Current Market Size (US$ Mn) Analysis and Forecast, By Technology, 2025 – 2032
- Immunoassay
- Molecular Diagnostics
- Microbiology
- Others
- Current Market Size (US$ Mn) Analysis and Forecast, By Application, 2025 – 2032
- MRSA
- Clostridium Difficile
- Respiratory Virus
- TB and Drug-resistant TB
- Gonorrhea
- HPV
- HIV
- Hepatitis C
- Hepatitis B
- COVID-19
- Others
- Current Market Size (US$ Mn) Analysis and Forecast, By End User, 2025 – 2032
- Point-of-care
- Central Laboratories
- Others
- Market Attractiveness Analysis
- Latin America Infectious Disease In-vitro Diagnostics Market Outlook:
- Key Highlights
- Historical Market Size (US$ Mn) Analysis, By Market, 2019 – 2024
- By Country
- By Product Type
- By Technology
- By Application
- By End User
- Current Market Size (US$ Mn) Analysis and Forecast, By Country, 2025 – 2032
- Brazil
- Mexico
- Rest of Latin America
- Current Market Size (US$ Mn) Analysis and Forecast, By Product Type, 2025 – 2032
- Instruments
- Reagents
- Software and Services
- Current Market Size (US$ Mn) Analysis and Forecast, By Technology, 2025 – 2032
- Immunoassay
- Molecular Diagnostics
- Microbiology
- Others
- Current Market Size (US$ Mn) Analysis and Forecast, By Application, 2025 – 2032
- MRSA
- Clostridium Difficile
- Respiratory Virus
- TB and Drug-resistant TB
- Gonorrhea
- HPV
- HIV
- Hepatitis C
- Hepatitis B
- COVID-19
- Others
- Current Market Size (US$ Mn) Analysis and Forecast, By End User, 2025 – 2032
- Point-of-care
- Central Laboratories
- Others
- Market Attractiveness Analysis
- Middle East & Africa Infectious Disease In-vitro Diagnostics Market Outlook:
- Key Highlights
- Historical Market Size (US$ Mn) Analysis, By Market, 2019 – 2024
- By Country
- By Product Type
- By Technology
- By Application
- By End User
- Current Market Size (US$ Mn) Analysis and Forecast, By Country, 2025 – 2032
- GCC Countries
- Egypt
- South Africa
- Northern Africa
- Rest of Middle East & Africa
- Current Market Size (US$ Mn) Analysis and Forecast, By Product Type, 2025 – 2032
- Instruments
- Reagents
- Software and Services
- Current Market Size (US$ Mn) Analysis and Forecast, By Technology, 2025 – 2032
- Immunoassay
- Molecular Diagnostics
- Microbiology
- Others
- Current Market Size (US$ Mn) Analysis and Forecast, By Application, 2025 – 2032
- MRSA
- Clostridium Difficile
- Respiratory Virus
- TB and Drug-resistant TB
- Gonorrhea
- HPV
- HIV
- Hepatitis C
- Hepatitis B
- COVID-19
- Others
- Current Market Size (US$ Mn) Analysis and Forecast, By End User, 2025 – 2032
- Point-of-care
- Central Laboratories
- Others
- Market Attractiveness Analysis
- Competition Landscape
- Market Share Analysis, 2024
- Market Structure
- Competition Intensity Mapping By Market
- Competition Dashboard
- Company Profiles (Details – Overview, Financials, Strategy, Recent Developments)
- QIAGEN
- Overview
- Segments and Products
- Key Financials
- Market Developments
- Market Strategy
- Becton, Dickinson and Company
- bioMérieux SA
- F. Hoffmann-La Roche, Ltd.
- Hologic, Inc. (Gen Probe)
- Abbott
- Quidel Corporation
- Siemens Healthineers AG
- Bio-Rad Laboratories, Inc.
- Danaher
- OraSure Technologies, Inc.
- Others
- QIAGEN
- Appendix
- Research Methodology
- Research Assumptions
- Acronyms and Abbreviations

Loading page data
Please wait a moment


