


- Executive Summary
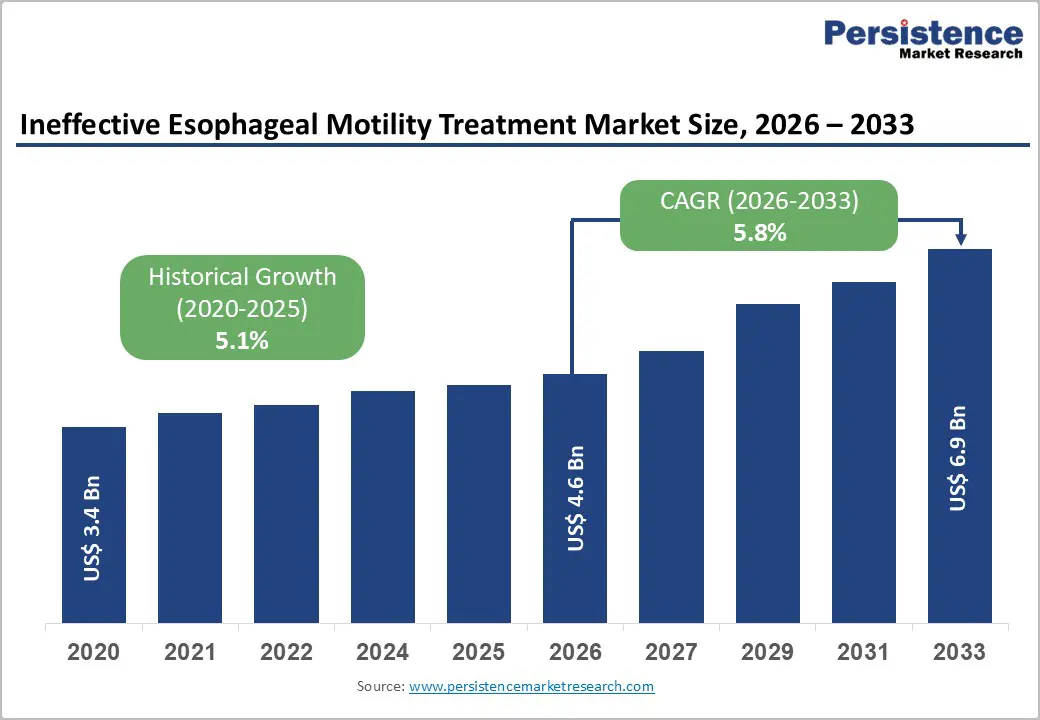
- Global Ineffective Esophageal Motility Treatment Market Snapshot 2026 and 2033
- Market Opportunity Assessment, 2026-2033, US$ Bn
- Key Market Trends
- Industry Developments and Key Market Events
- Demand Side and Supply Side Analysis
- PMR Analysis and Recommendations
- Market Overview
- Market Scope and Definitions
- Market Dynamics
- Driver
- Restraint
- Opportunities
- Trends
- Macro-Economic Factors
- Global GDP Outlook
- Global Healthcare Expenditure
- Forecast Factors – Relevance and Impact
- COVID-19 Impact Assessment
- Value Added Insights
- Value Chain analysis
- Key Market Players
- Disease Epidemiology
- Product Adoption Analysis
- Key Promotional Strategies by key players
- PESTLE Analysis
- Porter's Five Forces Analysis
- Regulatory and Technology Landscape
- Price Trend Analysis, 2025
- Region-wise Price Analysis
- Price by Segments
- Price Impact Factors
- Global Ineffective Esophageal Motility Treatment Market Outlook: Historical (2020 – 2025) and Forecast (2026 – 2033)
- Key Highlights
- Global Ineffective Esophageal Motility Treatment Market Outlook: Product
- Introduction/Key Findings
- Historical Market Size (US$ Bn) Analysis by Product, 2020-2025
- Current Market Size (US$ Bn) Forecast, by Product, 2026-2033
- Devices
- Reflux Management Systems
- Endoscopic Pain Modulators
- Endostaplers
- Radiofrequency (RF) Ablation Devices
- Myotomy
- Drugs
- H2 Receptor Antagonist
- Antacids
- Proton Pump Inhibitors
- Dopamine Antagonist
- Prokinetic Agents
- Calcium Channel Blockers
- Devices
- Market Attractiveness Analysis: Product
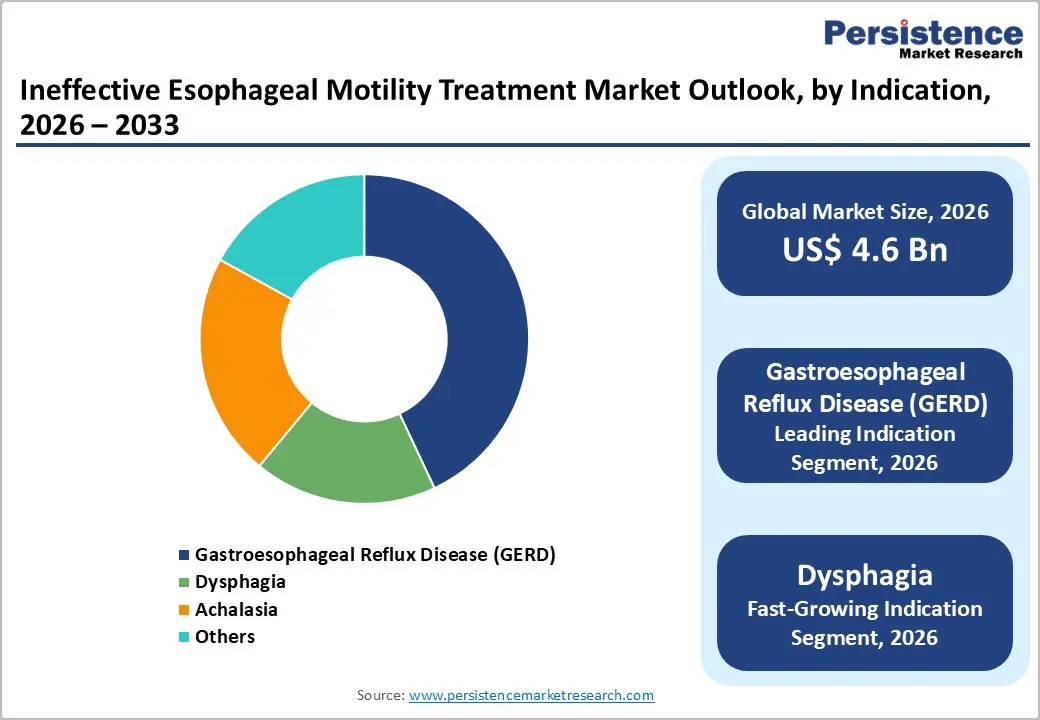
- Global Ineffective Esophageal Motility Treatment Market Outlook: Indication
- Introduction/Key Findings
- Historical Market Size (US$ Bn) Analysis by Indication, 2020-2025
- Current Market Size (US$ Bn) Forecast, by Indication, 2026-2033
- Gastroesophageal Reflux Disease (GERD)
- Dysphagia
- Achalasia
- Others
- Market Attractiveness Analysis: Indication
- Global Ineffective Esophageal Motility Treatment Market Outlook: End User
- Introduction/Key Findings
- Historical Market Size (US$ Bn) Analysis by End User, 2020-2025
- Current Market Size (US$ Bn) Forecast, by End User, 2026-2033
- Hospitals
- Specialty Clinics
- Ambulatory Surgical Centers
- Retail & Online Pharmacies
- Market Attractiveness Analysis: End User
- Global Ineffective Esophageal Motility Treatment Market Outlook: Region
- Key Highlights
- Historical Market Size (US$ Bn) Analysis by Region, 2020-2025
- Current Market Size (US$ Bn) Forecast, by Region, 2026-2033
- North America
- Europe
- East Asia
- South Asia & Oceania
- Latin America
- Middle East & Africa
- Market Attractiveness Analysis: Region
- North America Ineffective Esophageal Motility Treatment Market Outlook: Historical (2020 – 2025) and Forecast (2026 – 2033)
- Key Highlights
- North America Market Size (US$ Bn) Forecast, by Country, 2026-2033
- U.S.
- Canada
- North America Market Size (US$ Bn) Forecast, by Product, 2026-2033
- Devices
- Reflux Management Systems
- Endoscopic Pain Modulators
- Endostaplers
- Radiofrequency (RF) Ablation Devices
- Myotomy
- Drugs
- H2 Receptor Antagonist
- Antacids
- Proton Pump Inhibitors
- Dopamine Antagonist
- Prokinetic Agents
- Calcium Channel Blockers
- Devices
- North America Market Size (US$ Bn) Forecast, by Indication, 2026-2033
- Gastroesophageal Reflux Disease (GERD)
- Dysphagia
- Achalasia
- Others
- North America Market Size (US$ Bn) Forecast, by End User, 2026-2033
- Hospitals
- Specialty Clinics
- Ambulatory Surgical Centers
- Retail & Online Pharmacies
- Europe Ineffective Esophageal Motility Treatment Market Outlook: Historical (2020 – 2025) and Forecast (2026 – 2033)
- Key Highlights
- Europe Market Size (US$ Bn) Forecast, by Country, 2026-2033
- Germany
- Italy
- France
- U.K.
- Spain
- Russia
- Rest of Europe
- Europe Market Size (US$ Bn) Forecast, by Product, 2026-2033
- Devices
- Reflux Management Systems
- Endoscopic Pain Modulators
- Endostaplers
- Radiofrequency (RF) Ablation Devices
- Myotomy
- Drugs
- H2 Receptor Antagonist
- Antacids
- Proton Pump Inhibitors
- Dopamine Antagonist
- Prokinetic Agents
- Calcium Channel Blockers
- Devices
- Europe Market Size (US$ Bn) Forecast, by Indication, 2026-2033
- Gastroesophageal Reflux Disease (GERD)
- Dysphagia
- Achalasia
- Others
- Europe Market Size (US$ Bn) Forecast, by End User, 2026-2033
- Hospitals
- Specialty Clinics
- Ambulatory Surgical Centers
- Retail & Online Pharmacies
- East Asia Ineffective Esophageal Motility Treatment Market Outlook: Historical (2020 – 2025) and Forecast (2026 – 2033)
- Key Highlights
- East Asia Market Size (US$ Bn) Forecast, by Country, 2026-2033
- China
- Japan
- South Korea
- East Asia Market Size (US$ Bn) Forecast, by Product, 2026-2033
- Devices
- Reflux Management Systems
- Endoscopic Pain Modulators
- Endostaplers
- Radiofrequency (RF) Ablation Devices
- Myotomy
- Drugs
- H2 Receptor Antagonist
- Antacids
- Proton Pump Inhibitors
- Dopamine Antagonist
- Prokinetic Agents
- Calcium Channel Blockers
- Devices
- East Asia Market Size (US$ Bn) Forecast, by Indication, 2026-2033
- Gastroesophageal Reflux Disease (GERD)
- Dysphagia
- Achalasia
- Others
- East Asia Market Size (US$ Bn) Forecast, by End User, 2026-2033
- Hospitals
- Specialty Clinics
- Ambulatory Surgical Centers
- Retail & Online Pharmacies
- South Asia & Oceania Ineffective Esophageal Motility Treatment Market Outlook: Historical (2020 – 2025) and Forecast (2026 – 2033)
- Key Highlights
- South Asia & Oceania Market Size (US$ Bn) Forecast, by Country, 2026-2033
- India
- Southeast Asia
- ANZ
- Rest of SAO
- South Asia & Oceania Market Size (US$ Bn) Forecast, by Product, 2026-2033
- Devices
- Reflux Management Systems
- Endoscopic Pain Modulators
- Endostaplers
- Radiofrequency (RF) Ablation Devices
- Myotomy
- Drugs
- H2 Receptor Antagonist
- Antacids
- Proton Pump Inhibitors
- Dopamine Antagonist
- Prokinetic Agents
- Calcium Channel Blockers
- Devices
- South Asia & Oceania Market Size (US$ Bn) Forecast, by Indication, 2026-2033
- Gastroesophageal Reflux Disease (GERD)
- Dysphagia
- Achalasia
- Others
- South Asia & Oceania Market Size (US$ Bn) Forecast, by End User, 2026-2033
- Hospitals
- Specialty Clinics
- Ambulatory Surgical Centers
- Retail & Online Pharmacies
- Latin America Ineffective Esophageal Motility Treatment Market Outlook: Historical (2020 – 2025) and Forecast (2026 – 2033)
- Key Highlights
- Latin America Market Size (US$ Bn) Forecast, by Country, 2026-2033
- Brazil
- Mexico
- Rest of LATAM
- Latin America Market Size (US$ Bn) Forecast, by Product, 2026-2033
- Devices
- Reflux Management Systems
- Endoscopic Pain Modulators
- Endostaplers
- Radiofrequency (RF) Ablation Devices
- Myotomy
- Drugs
- H2 Receptor Antagonist
- Antacids
- Proton Pump Inhibitors
- Dopamine Antagonist
- Prokinetic Agents
- Calcium Channel Blockers
- Devices
- Latin America Market Size (US$ Bn) Forecast, by Indication, 2026-2033
- Gastroesophageal Reflux Disease (GERD)
- Dysphagia
- Achalasia
- Others
- Latin America Market Size (US$ Bn) Forecast, by End User, 2026-2033
- Hospitals
- Specialty Clinics
- Ambulatory Surgical Centers
- Retail & Online Pharmacies
- Middle East & Africa Ineffective Esophageal Motility Treatment Market Outlook: Historical (2020 – 2025) and Forecast (2026 – 2033)
- Key Highlights
- Middle East & Africa Market Size (US$ Bn) Forecast, by Country, 2026-2033
- GCC Countries
- South Africa
- Northern Africa
- Rest of MEA
- Middle East & Africa Market Size (US$ Bn) Forecast, by Product, 2026-2033
- Devices
- Reflux Management Systems
- Endoscopic Pain Modulators
- Endostaplers
- Radiofrequency (RF) Ablation Devices
- Myotomy
- Drugs
- H2 Receptor Antagonist
- Antacids
- Proton Pump Inhibitors
- Dopamine Antagonist
- Prokinetic Agents
- Calcium Channel Blockers
- Devices
- Middle East & Africa Market Size (US$ Bn) Forecast, by Indication, 2026-2033
- Gastroesophageal Reflux Disease (GERD)
- Dysphagia
- Achalasia
- Others
- Middle East & Africa Market Size (US$ Bn) Forecast, by End User, 2026-2033
- Hospitals
- Specialty Clinics
- Ambulatory Surgical Centers
- Retail & Online Pharmacies
- Competition Landscape
- Market Share Analysis, 2025
- Market Structure
- Competition Intensity Mapping
- Competition Dashboard
- Company Profiles
- Johnson & Johnson
- Company Overview
- Product Portfolio/Offerings
- Key Financials
- SWOT Analysis
- Company Strategy and Key Developments
- Mylan Pharmaceutical
- MediGus Ltd
- Torax Medical
- Medtronic Plc
- AstraZeneca Plc
- Teva Pharmaceutical Industries Ltd
- Takeda Pharmaceutical Company Limited
- Glaxosmithkline Plc.
- Bayer Ag
- Pfixer Inc
- Bausch Health Companies Inc.
- Laborie
- Mederi Therapeutics, Inc.
- Becton, Dickinson and Company.
- Johnson & Johnson
- Appendix
- Research Methodology
- Research Assumptions
- Acronyms and Abbreviations

Loading page data
Please wait a moment


