

- Executive Summary
- Global Industrial Wax Market Snapshot 2026 and 2033
- Market Opportunity Assessment, 2026-2033, US$ Bn
- Key Market Trends
- Industry Developments and Key Market Events
- Demand Side and Supply Side Analysis
- PMR Analysis and Recommendations
- Market Overview
- Market Scope and Definitions
- Value Chain Analysis
- Macro-Economic Factors
- Global GDP Outlook
- Global Prison Growth Outlook
- Global Crime Rates by Country
- Global Prison Population by Country
- Global Private Prison Market Growth Outlook
- Other Macro-economic Factors
- Forecast Factors – Relevance and Impact
- COVID-19 Impact Assessment
- PESTLE Analysis
- Porter's Five Forces Analysis
- Geopolitical Tensions: Market Impact
- Regulatory and Technology Landscape
- Market Dynamics
- Drivers
- Restraints
- Opportunities
- Trends
- Price Trend Analysis, 2020 – 2033
- Region-wise Price Analysis
- Price by Segments
- Price Impact Factors
- Global Industrial Wax Market Outlook: Historical (2020 – 2025) and Forecast (2026 – 2033)
- Key Highlights
- Global Industrial Wax Market Outlook: Source
- Introduction/Key Findings
- Historical Market Size (US$ Bn) and Volume (Tons) Analysis by Source, 2020-2025
- Current Market Size (US$ Bn) and Volume (Tons) Forecast, by Source, 2026-2033
- Fossil-based Waxes
- Synthetic Waxes
- Bio-based Waxes
- Market Attractiveness Analysis: Source
- Global Industrial Wax Market Outlook: Application
- Introduction/Key Findings
- Historical Market Size (US$ Bn) and Volume (Tons) Analysis by Application, 2020-2025
- Current Market Size (US$ Bn) and Volume (Tons) Forecast, by Application, 2026-2033
- Candles
- Packaging
- Coatings & Polishes
- Hot-melt Adhesives
- Tires & Rubber
- Cosmetics & Personal Care
- Food & Beverages
- Others (e.g., agriculture, inks)
- Market Attractiveness Analysis: Application
- Global Industrial Wax Market Outlook: End-User Industry
- Introduction/Key Findings
- Historical Market Size (US$ Bn) and Volume (Tons) Analysis by End-User Industry, 2020-2025
- Current Market Size (US$ Bn) and Volume (Tons) Forecast, by End-User Industry, 2026-2033
- Packaging & Paper
- Cosmetics & Personal Care
- Rubber & Tire
- Food & Pharma
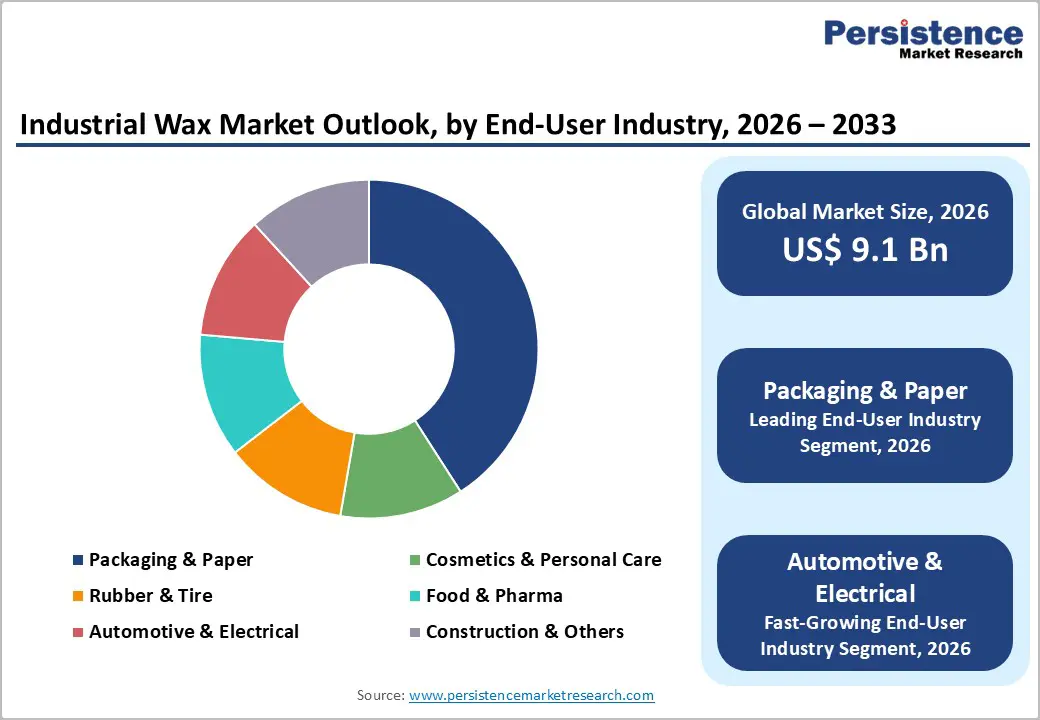
- Automotive & Electrical
- Construction & Others
- Market Attractiveness Analysis: End-User Industry
- Global Industrial Wax Market Outlook: Region
- Key Highlights
- Historical Market Size (US$ Bn) and Volume (Tons) Analysis by Region, 2020-2025
- Current Market Size (US$ Bn) and Volume (Tons) Forecast, by Region, 2026-2033
- North America
- Europe
- East Asia
- South Asia & Oceania
- Latin America
- Middle East & Africa
- Market Attractiveness Analysis: Region
- North America Industrial Wax Market Outlook: Historical (2020 – 2025) and Forecast (2026 – 2033)
- Key Highlights
- Pricing Analysis
- North America Market Size (US$ Bn) and Volume (Tons) Forecast, by Country, 2026-2033
- U.S.
- Canada
- North America Market Size (US$ Bn) and Volume (Tons) Forecast, by Source, 2026-2033
- Fossil-based Waxes
- Synthetic Waxes
- Bio-based Waxes
- North America Market Size (US$ Bn) and Volume (Tons) Forecast, by Application, 2026-2033
- Candles
- Packaging
- Coatings & Polishes
- Hot-melt Adhesives
- Tires & Rubber
- Cosmetics & Personal Care
- Food & Beverages
- Others (e.g., agriculture, inks)
- North America Market Size (US$ Bn) and Volume (Tons) Forecast, by End-User Industry, 2026-2033
- Packaging & Paper
- Cosmetics & Personal Care
- Rubber & Tire
- Food & Pharma
- Automotive & Electrical
- Construction & Others
- Europe Industrial Wax Market Outlook: Historical (2020 – 2025) and Forecast (2026 – 2033)
- Key Highlights
- Pricing Analysis
- Europe Market Size (US$ Bn) and Volume (Tons) Forecast, by Country, 2026-2033
- Germany
- Italy
- France
- U.K.
- Spain
- Russia
- Rest of Europe
- Europe Market Size (US$ Bn) and Volume (Tons) Forecast, by Source, 2026-2033
- Fossil-based Waxes
- Synthetic Waxes
- Bio-based Waxes
- Europe Market Size (US$ Bn) and Volume (Tons) Forecast, by Application, 2026-2033
- Candles
- Packaging
- Coatings & Polishes
- Hot-melt Adhesives
- Tires & Rubber
- Cosmetics & Personal Care
- Food & Beverages
- Others (e.g., agriculture, inks)
- Europe Market Size (US$ Bn) and Volume (Tons) Forecast, by End-User Industry, 2026-2033
- Packaging & Paper
- Cosmetics & Personal Care
- Rubber & Tire
- Food & Pharma
- Automotive & Electrical
- Construction & Others
- East Asia Industrial Wax Market Outlook: Historical (2020 – 2025) and Forecast (2026 – 2033)
- Key Highlights
- Pricing Analysis
- East Asia Market Size (US$ Bn) and Volume (Tons) Forecast, by Country, 2026-2033
- China
- Japan
- South Korea
- East Asia Market Size (US$ Bn) and Volume (Tons) Forecast, by Source, 2026-2033
- Fossil-based Waxes
- Synthetic Waxes
- Bio-based Waxes
- East Asia Market Size (US$ Bn) and Volume (Tons) Forecast, by Application, 2026-2033
- Candles
- Packaging
- Coatings & Polishes
- Hot-melt Adhesives
- Tires & Rubber
- Cosmetics & Personal Care
- Food & Beverages
- Others (e.g., agriculture, inks)
- East Asia Market Size (US$ Bn) and Volume (Tons) Forecast, by End-User Industry, 2026-2033
- Packaging & Paper
- Cosmetics & Personal Care
- Rubber & Tire
- Food & Pharma
- Automotive & Electrical
- Construction & Others
- South Asia & Oceania Industrial Wax Market Outlook: Historical (2020 – 2025) and Forecast (2026 – 2033)
- Key Highlights
- Pricing Analysis
- South Asia & Oceania Market Size (US$ Bn) and Volume (Tons) Forecast, by Country, 2026-2033
- India
- Southeast Asia
- ANZ
- Rest of SAO
- South Asia & Oceania Market Size (US$ Bn) and Volume (Tons) Forecast, by Source, 2026-2033
- Fossil-based Waxes
- Synthetic Waxes
- Bio-based Waxes
- South Asia & Oceania Market Size (US$ Bn) and Volume (Tons) Forecast, by Application, 2026-2033
- Candles
- Packaging
- Coatings & Polishes
- Hot-melt Adhesives
- Tires & Rubber
- Cosmetics & Personal Care
- Food & Beverages
- Others (e.g., agriculture, inks)
- South Asia & Oceania Market Size (US$ Bn) and Volume (Tons) Forecast, by End-User Industry, 2026-2033
- Packaging & Paper
- Cosmetics & Personal Care
- Rubber & Tire
- Food & Pharma
- Automotive & Electrical
- Construction & Others
- Latin America Industrial Wax Market Outlook: Historical (2020 – 2025) and Forecast (2026 – 2033)
- Key Highlights
- Pricing Analysis
- Latin America Market Size (US$ Bn) and Volume (Tons) Forecast, by Country, 2026-2033
- Brazil
- Mexico
- Rest of LATAM
- Latin America Market Size (US$ Bn) and Volume (Tons) Forecast, by Source, 2026-2033
- Fossil-based Waxes
- Synthetic Waxes
- Bio-based Waxes
- Latin America Market Size (US$ Bn) and Volume (Tons) Forecast, by Application, 2026-2033
- Candles
- Packaging
- Coatings & Polishes
- Hot-melt Adhesives
- Tires & Rubber
- Cosmetics & Personal Care
- Food & Beverages
- Others (e.g., agriculture, inks)
- Latin America Market Size (US$ Bn) and Volume (Tons) Forecast, by End-User Industry, 2026-2033
- Packaging & Paper
- Cosmetics & Personal Care
- Rubber & Tire
- Food & Pharma
- Automotive & Electrical
- Construction & Others
- Middle East & Africa Industrial Wax Market Outlook: Historical (2020 – 2025) and Forecast (2026 – 2033)
- Key Highlights
- Pricing Analysis
- Middle East & Africa Market Size (US$ Bn) and Volume (Tons) Forecast, by Country, 2026-2033
- GCC Countries
- South Africa
- Northern Africa
- Rest of MEA
- Middle East & Africa Market Size (US$ Bn) and Volume (Tons) Forecast, by Source, 2026-2033
- Fossil-based Waxes
- Synthetic Waxes
- Bio-based Waxes
- Middle East & Africa Market Size (US$ Bn) and Volume (Tons) Forecast, by Application, 2026-2033
- Candles
- Packaging
- Coatings & Polishes
- Hot-melt Adhesives
- Tires & Rubber
- Cosmetics & Personal Care
- Food & Beverages
- Others (e.g., agriculture, inks)
- Middle East & Africa Market Size (US$ Bn) and Volume (Tons) Forecast, by End-User Industry, 2026-2033
- Packaging & Paper
- Cosmetics & Personal Care
- Rubber & Tire
- Food & Pharma
- Automotive & Electrical
- Construction & Others
- Competition Landscape
- Market Share Analysis, 2025
- Market Structure
- Competition Intensity Mapping
- Competition Dashboard
- Company Profiles
- Sasol
- Company Overview
- Product Portfolio/Offerings
- Key Financials
- SWOT Analysis
- Company Strategy and Key Developments
- The Blayson Group Ltd
- Indian Oil Corporation Ltd
- Calumet Specialty Products Partners, L.P.
- Sonneborn LLC
- The International Group, Inc.
- Koster Keunen
- Kerax Limited
- Iberceras Specialties S.L.U.
- H & R South Africa (Pty) Ltd
- Cirebelle Fine Chemicals (Pty) Limited
- Matchem – Specialty Waxes & Inspired Blends
- The Darent Wax Company Ltd.
- Royal Dutch Shell plc.
- Asian Oil Company
- Asian Oil Company
- ExxonMobil Corporation
- China National Petroleum Corporation
- Sinopec Corporation
- BASF SE
- Honeywell International Inc.
- Clariant AG
- CEPSA
- Nippon Seiro Co., Ltd.
- MOL Group
- HollyFrontier Refining & Marketing LLC
- Sasol
- Appendix
- Research Methodology
- Research Assumptions
- Acronyms and Abbreviations


- Specialty & Fine Chemicals
- Industrial Wax Market
Industrial Wax Market Size, Share, and Growth Forecast 2026 - 2033
Industrial Wax Market by Source (Fossil-based Waxes, Synthetic Waxes, Bio-based Waxes), Application (Candles, Packaging, Coatings & Polishes, Hot-melt Adhesives, Tires & Rubber, Cosmetics & Personal Care, Food & Beverages, Others), Industry (Packaging & Paper, Cosmetics & Personal Care, Rubber & Tire, Food & Pharma, Automotive & Electrical, Construction & Others), Pricing Model, and Regional Analysis, 2026 - 2033
Industrial Wax Market Size and Trend Analysis
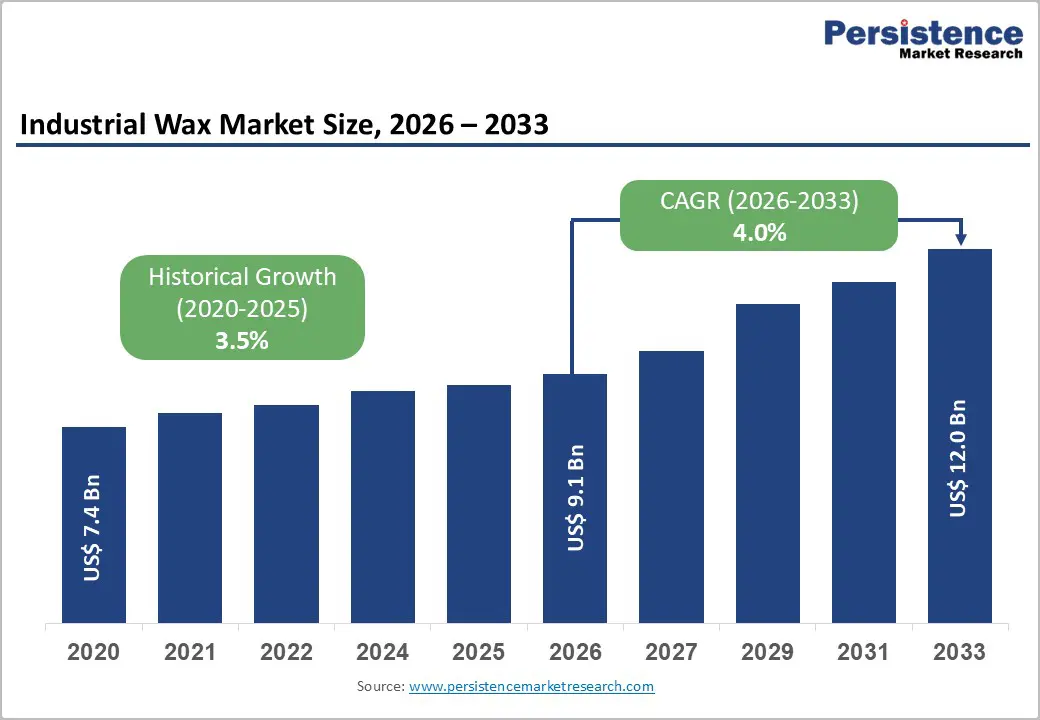
The global industrial wax market size is expected to be valued at US$ 9.1 billion in 2026 and projected to reach US$ 12.0 billion by 2033, growing at a CAGR of 4.0% between 2026 and 2033.
The market expansion is fundamentally driven by surging demand from packaging industries requiring moisture-resistant coatings, with global packaged food consumption rising substantially alongside e-commerce growth. Additionally, the automotive sector’s increasing utilization of protective waxes in tire manufacturing, coupled with the cosmetics industry’s sustained adoption of natural wax formulations in premium personal care products, reinforces steady market momentum across diverse industrial applications.
Key Industry Highlights
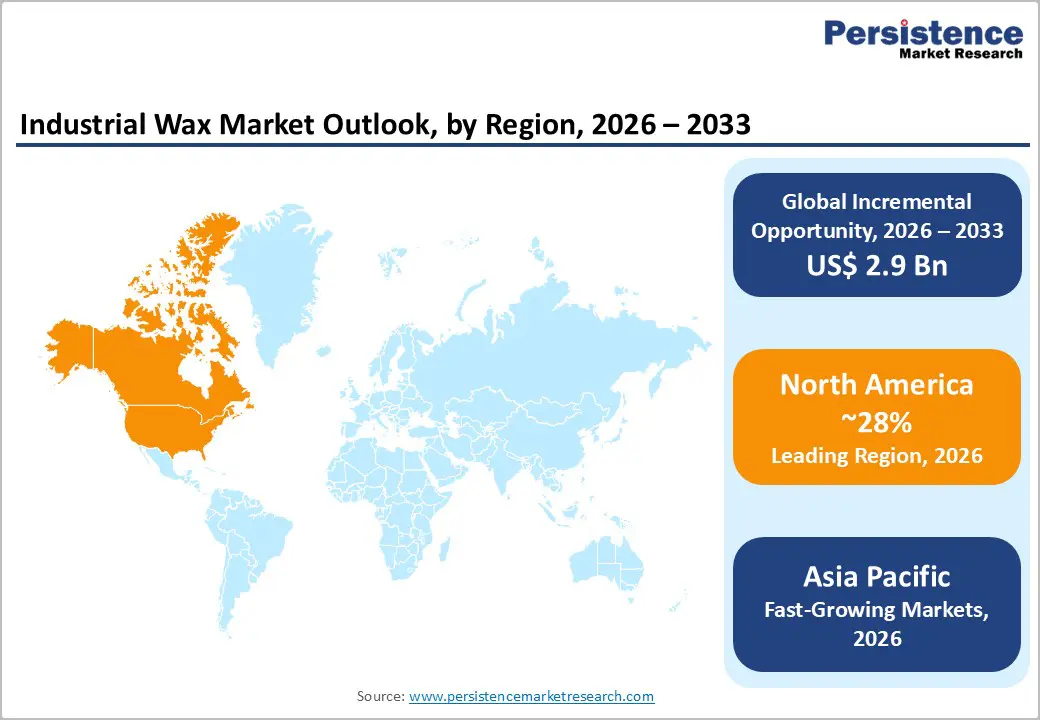
- Regional Leadership: North America leads the global Industrial Wax market with approximately 28% revenue share in 2025, driven by the United States accounting for 71.7% of regional demand, robust candle manufacturing traditions, stringent FDA food-grade wax regulations under 21 CFR, and ongoing innovation in sustainable food-contact coating formulations.
- Fastest Growing Market: Asia Pacific represents the fastest-growing regional market projected to expand at 4.9% CAGR through 2034, propelled by China’s dominance with 56.9% of East Asia market, massive tire production of 856 million casings in 2022, and export value of ¥131.418 billion driving industrial wax consumption.
- Dominant Source: Fossil-based waxes dominate the source segment with approximately 58% market share in 2025, supported by paraffin and mineral waxes’ cost competitiveness, widespread availability through petroleum refining processes, and well-established supply chains serving candles, packaging, cosmetics, and coating applications globally.
- Fast-growing Source: Bio-based Waxes emerge as the fastest-growing source segment driven by stringent environmental regulations, 30-40% lower carbon footprints, and accelerating adoption across sustainable packaging and natural cosmetics formulations.
- Key Opportunity: Packaging applications present substantial growth opportunities fueled by explosive e-commerce growth requiring protective shipping materials, FDA restrictions on PFAS in food packaging accelerating wax-based substitutions, and sustainable packaging mandates.
| Key Insights | Details |
|---|---|
|
Industrial Wax Market Size (2026E) |
US$ 9.1 billion |
|
Market Value Forecast (2033F) |
US$ 12.0 billion |
|
Projected Growth CAGR (2026-2033) |
4.0% |
|
Historical Market Growth (2020-2025) |
3.5% |
Market Dynamics
Drivers - Rapid Expansion of E-Commerce and Sustainable Packaging Driving Wax-Coated Solutions
The explosive growth of global e-commerce has fundamentally transformed packaging requirements, creating substantial demand for wax-coated corrugated boxes and protective packaging materials. According to industry data, over 300 million tons of plastic waste are produced annually, prompting significant regulatory pressure and consumer preference shifts toward biodegradable packaging alternatives. Wax-coated packaging provides critical moisture resistance, prevents grease penetration, and offers cost-effective protection for food products during storage and transportation. The U.S. Food and Drug Administration (FDA) recognizes food-grade wax paper as safe for direct food contact under 21 CFR 184.1978, enabling widespread adoption across commercial kitchens and food processing facilities.
Furthermore, packaging converters report up to 35% fewer shipment failures when formulations include Fischer-Tropsch wax additives, particularly valuable for humid climate zones and cold-chain logistics. The global market for biodegradable wax paper is anticipated to grow by 7% annually through 2033, driven specifically by demand for sustainable materials that align with circular economy principles and corporate environmental commitments.
Growing Tire Production and Anti-Ozonant Requirements in the Rubber Industry
The global tire industry represents a critical demand driver for protective wax formulations essential in preventing ozone-induced cracking and extending product lifespan. Global tire sales are about 2.5 billion units sold annually, with the three major markets of Europe, North America, and China collectively selling 1.5 billion units, accounting for 65% of total volume. Rubber protecting wax, composed of paraffin wax, microcrystalline wax, and specialized additives, forms steadily tenacious protective layers on vulcanized rubber surfaces, efficiently preventing cracking caused by atmospheric ozone exposure.
The recommended applicable temperature range of 0-45°C for medium-temperature protective waxes ensures long-term protection across diverse climatic conditions. The global market for rubber protecting wax is projected to grow at a CAGR of 3.5% through 2033. Chinese tire companies, comprising 34 of the top 75 global tire manufacturers with combined sales of approximately US$ 34.5 billion, drive substantial regional demand for specialized anti-ozonant wax formulations.
Restraints - Volatility in Crude Oil Prices Impacting Fossil-Based Wax Production Costs
The industrial wax market faces significant cost pressures stemming from crude oil price volatility, as fossil-based waxes derived from petroleum refining processes constitute the dominant raw material source. Paraffin and mineral waxes retained 58% market share in 2024, creating substantial exposure to fluctuating petroleum feedstock costs. The average price of packaging wax increased by 8% in 2024 due to rising petroleum costs and supply chain disruptions, directly impacting manufacturer margins and end-user pricing. Crude oil serves as the crucial raw material for paraffin wax production through refinery processes, with price fluctuations transmitting through the value chain to affect packaging, candle, and coating applications.
Additionally, 5% increases in oil prices contribute directly to higher production costs, compressing profit margins for wax producers unable to pass costs to price-sensitive customers. This economic pressure particularly affects small and medium-sized manufacturers operating in competitive markets with limited pricing power, potentially constraining market growth during periods of sustained petroleum price elevation.
Increasing Regulatory Scrutiny and Shift Toward Bio-Based Alternatives
The industrial wax market confronts mounting regulatory pressures and evolving consumer preferences favoring bio-based and sustainable alternatives over traditional petroleum-derived products. In February 2024, the U.S. Food and Drug Administration (FDA) restricted manufacturers from selling grease-proofing substances containing per- and polyfluoroalkyl substances (PFAS) for use in food packaging, exemplifying tightening regulatory frameworks affecting conventional wax formulations. The European Union’s stringent environmental regulations, including REACH and the EU Green Deal mandate reduced reliance on petroleum-based materials, accelerating substitution with plant-derived alternatives.
Bio-based waxes, while offering environmental advantages, typically command premium pricing with production costs exceeding paraffin alternatives, creating market adoption barriers among cost-conscious industrial buyers. Supply chain limitations for certain plant-derived waxes, combined with yield and availability concerns affected by agricultural output variability, further constrain reliable bio-wax sourcing. The vegan cosmetics trend, substituting beeswax with candelilla, sunflower-seed wax, and palm-derived polyglycerol esters, reflects a broader market transformation that challenges conventional wax suppliers to reformulate products and invest in alternative sourcing strategies.
Opportunities - Bio-Based and Sustainable Wax Innovation Addressing Environmental Regulations
The accelerating global transition toward sustainable materials presents transformative opportunities for bio-based industrial wax manufacturers capable of delivering performance-competitive alternatives to petroleum-derived products. The bio-based industrial wax market was valued at US$ 500 million in 2024 and is projected to reach US$ 1 billion by 2033, growing at a robust CAGR, substantially outpacing conventional wax segment growth rates.
European manufacturers lead sustainability-driven demand, supported by strict environmental regulations such as REACH and the EU Green Deal, with Germany, France, and United Kingdom deploying bio-based materials extensively across cosmetics and packaging applications. In October 2023, Emulco NV introduced its AquaVeg bio-emulsion for wood panels suitable for eco-building, combining water-based bio-emulsion with formaldehyde-free bio-based binders to produce zero-emission panel boards.
Additionally, in April 2022, Shamrock Technologies announced the expansion of sustainable bio-based wax additives portfolio. The carbon footprint reduction potential of bio-waxes, estimated at 30-40% lower than conventional variants, strengthens their appeal in corporate sustainability strategies. The natural beauty products sector utilizing bio-waxes was worth more than half of the cosmetics industry, indicating rising trends expected to substantially increase bio-wax demand across premium personal care formulations.
Synthetic Wax Technological Advancements for High-Performance Applications
Synthetic wax represents the fastest-growing segment within the industrial wax market, driven by superior performance characteristics including enhanced heat resistance, water resistance, and longevity compared to natural alternatives. Synthetic waxes offer consistent quality, customizable properties including adjustable melting points and hardness levels, making them suitable for high-performance applications across coatings, adhesives, cosmetics, packaging, and rubber processing industries.
In August 2024, Sasol Chemicals launched SASOLWAX LC100, an industrial wax grade offering 35% lower cradle-to-gate Product Carbon Footprint (PCF) compared to conventional alternatives while maintaining performance quality in packaging adhesives applications. Furthermore, in February 2025, Sasol Chemicals expanded its micronized wax portfolio with SASOLWAX LC Spray 30 G and LC Spray 30 G-EF, featuring 32% lower Product Carbon Footprint compared to existing market-leading products.
In June 2024, Shell officially launched GTL Microcrystalline Wax, a premium synthetic wax derived from natural gas through the Fischer-Tropsch process in Hamburg, Germany. Asia-Pacific markets, particularly China and India, demonstrate accelerating synthetic wax adoption driven by expanding manufacturing capabilities, cost-competitive production advantages, and growing demand from automotive, electronics, and industrial coating sectors requiring specialized performance attributes unattainable with conventional petroleum or bio-based alternatives.
Category-wise Analysis
Source Insights
Fossil-based waxes remain the dominant source segment in the industrial wax market, accounting for nearly 58% share in 2025 due to their cost efficiency, large-scale availability, and mature supply infrastructure. Paraffin wax, derived from crude oil refining, anchors this dominance as it delivers consistent quality, chemical stability, water repellency, and reliable melting behavior required across packaging, candles, coatings, and rubber processing. Long-established refining capacities and decades of process optimization enable stable supply and predictable pricing, reducing procurement risks for industrial users. In Asia Pacific, especially China, access to high-paraffin crude grades further strengthens regional production advantages. Compatibility with existing processing equipment and standardized performance specifications continues to reinforce fossil-based wax preference despite emerging alternatives.
Application Insights
Packaging represents the largest application segment in the industrial wax market, contributing around 33% share in 2025, driven by the need for moisture resistance, grease barriers, and surface protection. Wax coatings are widely applied in food packaging, corrugated boxes, and specialty paper to enhance durability and shelf life while maintaining cost efficiency. Compliance with food-contact safety regulations supports adoption in bakery, produce, and pharmaceutical packaging. Growth in e-commerce logistics is further increasing demand for wax-modified adhesives and coatings that improve carton sealing strength and label adhesion under variable climatic conditions. Performance reliability, especially in humid and cold-chain environments, positions packaging as a structurally resilient demand segment with steady long-term consumption.
Industry Insights
The packaging & paper industry constitutes the leading end-user segment, holding approximately 35% market share in 2025, owing to extensive use of waxes for moisture barriers, grease resistance, and surface finishing. Rising global consumption of packaged food and the rapid expansion of e-commerce logistics continue to drive demand for wax-coated paperboard and cartons. Additionally, increasing regulatory pressure to reduce plastic usage is accelerating interest in wax-treated paper-based alternatives that offer functional protection with improved biodegradability. Industrial waxes enable enhanced durability without significantly increasing material costs, making them attractive for high-volume packaging applications. As sustainability considerations intensify, this end-user segment remains central to industrial wax demand evolution.
Regional Insights
North America Industrial Wax Market Trends and Insights
North America maintains market leadership with approximately 28% revenue share in North America remains a leading regional market, accounting for nearly 28% of global industrial wax revenue in 2025, supported by diversified end-use demand and a well-established production ecosystem. The United States dominates regional consumption, driven by strong requirements from packaging, candles, cosmetics, and food-contact applications. Regulatory oversight plays a decisive role in shaping demand patterns, particularly FDA compliance standards governing food-grade waxes and adhesive formulations.
Recent restrictions on PFAS-based grease-proofing materials have accelerated the shift toward wax-based barrier solutions in food packaging. Candle consumption continues to provide a stable baseline demand, supported by premium scented and decorative products with consistent year-round usage. Innovation remains a key competitive lever, with major refiners expanding refined and specialty wax portfolios to meet evolving performance and sustainability needs.
Europe Industrial Wax Market Trends and Insights
Europe represents the second-largest regional market with approximately 26% share in 2025, characterized by strong sustainability mandates and high-value end-use applications. The region demonstrates accelerated adoption of bio-based and synthetic waxes, supported by regulatory frameworks such as REACH and the EU Green Deal, which prioritize lower carbon footprints and reduced reliance on petroleum-derived materials. Germany, the UK, France, and Spain remain core consumption hubs due to established candle manufacturing traditions, advanced cosmetics industries, and specialty packaging demand.
Germany leads regional innovation efforts, investing heavily in cleaner-burning waxes and hybrid formulations that balance performance with environmental compliance. Demand in Europe is increasingly quality-driven, favoring refined waxes with consistent performance, low emissions, and traceable sourcing. Cultural candle usage and premium personal care applications ensure stable baseline consumption, while regulatory pressure continues to reshape product formulation strategies across the regional supply chain.
Asia Pacific Industrial Wax Market Trends and Insights
Asia Pacific is the fastest-growing regional market, projected to expand at nearly 4.9% CAGR through 2034, driven by industrial scale, rising consumer demand, and manufacturing cost advantages. China anchors regional growth, supported by large-scale production in packaging, rubber, tire manufacturing, and export-oriented industries, all of which consume significant volumes of industrial wax. The region benefits from ready access to petroleum feedstocks and agricultural raw materials, enabling both fossil-based and bio-wax production at competitive costs.
Japan follows with a mature market emphasizing high-quality formulations for industrial and specialty applications, while South Korea exhibits strong growth momentum due to expanding cosmetics demand, particularly for natural wax ingredients. India is emerging as a high-potential market, supported by growth in FMCG, packaging, automotive, and organized manufacturing. Collectively, scale efficiencies, rising domestic consumption, and export competitiveness underpin the Asia Pacific’s leadership in future wax demand growth.
Competitive Landscape
The industrial wax market is characterized by moderate fragmentation, with competition spread across large integrated producers, regional refiners, and a growing group of sustainability-focused specialists. Market structure is shaped by vertical integration, long-term access to feedstocks, and established refining and distribution infrastructure, which together create entry barriers for new participants. Competitive differentiation increasingly revolves around consistency of product quality, formulation flexibility, and the ability to meet evolving regulatory and sustainability requirements.
Suppliers are prioritizing low-carbon and bio-based wax solutions, supported by investments in cleaner production processes and alternative feedstock sourcing. Strategic expansion into high-growth regions, particularly in Asia and emerging manufacturing hubs, remains a key growth lever. In parallel, companies are strengthening technical collaboration with end users to deliver application-specific wax blends that enhance performance and cost efficiency. Digitalization of operations, including advanced process control and quality optimization, is gaining traction, enabling suppliers to improve yields, reduce emissions, and support premium positioning across specialized end-use segments.
Key Developments:
- August 2024: Sasol Chemicals introduced SASOLWAX LC100, an industrial wax grade with 35% lower carbon footprint, further enhancing its sustainable product portfolio for packaging adhesives sector while maintaining performance quality standards.
- February 2025: Sasol Chemicals expanded its micronized wax portfolio with SASOLWAX LC Spray 30 G and LC Spray 30 G-EF, offering 32% lower Product Carbon Footprint compared to existing market-leading products.
- April 2025: Clariant launched Ceridust 1310, a bio-based wax solution designed to reduce reliance on volatile carnauba wax supply chains for printing ink formulators, offering consistent quality and stable production planning.
- June 2025: Shell soft-launched GTL SaraCare, a new product line for personal care and cosmetics market at in-cosmetics Asia event in Bangkok, Thailand, demonstrating strategic expansion into premium applications.
Companies Covered in Industrial Wax Market
- Sasol
- The Blayson Group Ltd
- Indian Oil Corporation Ltd
- Calumet Specialty Products Partners, L.P.
- Sonneborn LLC
- The International Group, Inc.
- Koster Keunen
- Kerax Limited
- Iberceras Specialties S.L.U.
- H & R South Africa (Pty) Ltd
- Cirebelle Fine Chemicals (Pty) Limited
- Matchem – Specialty Waxes & Inspired Blends
- The Darent Wax Company Ltd.
- Royal Dutch Shell plc.
- Asian Oil Company
- ExxonMobil Corporation
- China National Petroleum Corporation
- Sinopec Corporation
- BASF SE
- Honeywell International Inc.
- Clariant AG
- CEPSA
- Nippon Seiro Co., Ltd.
- MOL Group
- HollyFrontier Refining & Marketing LLC
Frequently Asked Questions
The global Industrial Wax market is expected to reach about US$ 9.1 billion in 2026 and grow to US$ 12.0 billion by 2033 at a CAGR of 4.0%.
Demand is driven by e-commerce packaging needs, high global tire production, regulatory substitution of PFAS in food packaging, and rising use of natural waxes in cosmetics.
North America leads the market with around 28% share, supported by strong U.S. demand, candle manufacturing, and stringent food-grade compliance requirements.
Bio-based waxes offer the biggest opportunity due to faster growth, lower carbon footprints, and alignment with sustainability and regulatory mandates.
Leading market players include Sasol, ExxonMobil Corporation, Shell, China National Petroleum Corporation, Sonneborn LLC, The International Group Inc., Koster Keunen, BASF SE, and Honeywell International Inc.


