

- Executive Summary
- Global In-memory Computing Market Snapshot, 2025 and 2032
- Market Opportunity Assessment, 2025 - 2032, US$ Bn
- Key Market Trends
- Future Market Projections
- Premium Market Insights
- Industry Developments and Key Market Events
- PMR Analysis and Recommendations
- Market Overview
- Market Scope and Definition
- Market Dynamics
- Drivers
- Restraints
- Opportunity
- Key Trends
- COVID-19 Impact Analysis
- Forecast Factors - Relevance and Impact
- Value Added Insights
- Component Adoption Analysis
- Regulatory Landscape
- List of Suppliers
- Porter’s Five Forces Analysis
- PESTLE Analysis
- Promotional Strategies, By Key Players
- Global In-memory Computing Market Outlook
- Key Highlights
- Market Size (US$ Bn) and Y-o-Y Growth
- Absolute $ Opportunity
- Market Size (US$ Bn) Analysis and Forecast
- Historical Market Size (US$ Bn) Analysis, 2019-2023
- Current Market Size (US$ Bn) Analysis and Forecast, 2025 - 2032
- Global In-memory Computing Market Outlook: Component
- Introduction / Key Findings
- Historical Market Size (US$ Bn) Analysis, By Component, 2019 - 2024
- Current Market Size (US$ Bn) Analysis and Forecast, By Component, 2025 - 2032
- Solution
- In-memory Database (IMED)
- In-memory Data Grid (IMDG)
- Services
- Professional Services
- Managed Services
- Solution
- Market Attractiveness Analysis: Component
- Global In-memory Computing Market Outlook: Application
- Introduction / Key Findings
- Historical Market Size (US$ Bn), By Application, 2019 - 2024
- Current Market Size (US$ Bn) Analysis and Forecast, By Application, 2025 - 2032
- Risk Management and Fraud Detection
- Sentiment Analysis
- Geospatial/GIS Processing
- Sales and Marketing Optimization
- Predictive Analysis
- Supply Chain Management
- Image Processing
- Route Optimization
- Market Attractiveness Analysis: Application
- Global In-memory Computing Market Outlook: Deployment
- Introduction / Key Findings
- Historical Market Size (US$ Bn), By Deployment, 2019 - 2024
- Current Market Size (US$ Bn) Analysis and Forecast, By Deployment, 2025 - 2032
- On-premise
- Cloud
- Market Attractiveness Analysis: Deployment
- Global In-memory Computing Market Outlook: Vertical
- Introduction / Key Findings
- Historical Market Size (US$ Bn), By Vertical, 2019 - 2024
- Current Market Size (US$ Bn) Analysis and Forecast, By Vertical, 2025 - 2032
- BFSI
- IT and Telecom
- Manufacturing
- Healthcare and Lifestyle
- Education
- Retail and E-commerce
- Transportation and Logistics
- Government and Defense
- Energy and Utilities
- Media and Entertainment
- Market Attractiveness Analysis: Vertical
- Key Highlights
- Global In-memory Computing Market Outlook: Region
- Key Highlights
- Historical Market Size (US$ Bn) Analysis, By Region, 2019 - 2024
- Current Market Size (US$ Bn) Analysis and Forecast, By Region, 2025 - 2032
- North America
- Europe
- East Asia
- South Asia and Oceania
- Latin America
- Middle East & Africa
- Market Attractiveness Analysis: Region
- North America In-memory Computing Market Outlook
- Key Highlights
- Historical Market Size (US$ Bn) Analysis, By Market, 2019 - 2024
- By Country
- By Component
- By Application
- By Deployment
- By Vertical
- Current Market Size (US$ Bn) Analysis and Forecast, By Country, 2025 - 2032
- U.S.
- Canada
- Current Market Size (US$ Bn) Analysis and Forecast, By Component, 2025 - 2032
- Solution
- In-memory Database (IMED)
- In-memory Data Grid (IMDG)
- Services
- Professional Services
- Managed Services
- Solution
- Current Market Size (US$ Bn) Analysis and Forecast, By Application, 2025 - 2032
- Risk Management and Fraud Detection
- Sentiment Analysis
- Geospatial/GIS Processing
- Sales and Marketing Optimization
- Predictive Analysis
- Supply Chain Management
- Image Processing
- Route Optimization
- Current Market Size (US$ Bn) Analysis and Forecast, By Deployment, 2025 - 2032
- On-premise
- Cloud
- Current Market Size (US$ Bn) Analysis and Forecast, By Vertical, 2025 - 2032
- BFSI
- IT and Telecom
- Manufacturing
- Healthcare and Lifestyle
- Education
- Retail and E-commerce
- Transportation and Logistics
- Government and Defense
- Energy and Utilities
- Media and Entertainment
- Market Attractiveness Analysis
- Europe In-memory Computing Market Outlook
- Key Highlights
- Historical Market Size (US$ Bn) Analysis, By Market, 2019 - 2024
- By Country
- By Component
- By Application
- By Deployment
- By Vertical
- Current Market Size (US$ Bn) Analysis and Forecast, By Country, 2025 - 2032
- Germany
- France
- U.K.
- Italy
- Spain
- Russia
- Türkiye
- Rest of Europe
- Current Market Size (US$ Bn) Analysis and Forecast, By Component, 2025 - 2032
- Solution
- In-memory Database (IMED)
- In-memory Data Grid (IMDG)
- Services
- Professional Services
- Managed Services
- Solution
- Current Market Size (US$ Bn) Analysis and Forecast, By Application, 2025 - 2032
- Risk Management and Fraud Detection
- Sentiment Analysis
- Geospatial/GIS Processing
- Sales and Marketing Optimization
- Predictive Analysis
- Supply Chain Management
- Image Processing
- Route Optimization
- Current Market Size (US$ Bn) Analysis and Forecast, By Deployment, 2025 - 2032
- On-premise
- Cloud
- Current Market Size (US$ Bn) Analysis and Forecast, By Vertical, 2025 - 2032
- BFSI
- IT and Telecom
- Manufacturing
- Healthcare and Lifestyle
- Education
- Retail and E-commerce
- Transportation and Logistics
- Government and Defense
- Energy and Utilities
- Media and Entertainment
- Market Attractiveness Analysis
- East Asia In-memory Computing Market Outlook
- Key Highlights
- Historical Market Size (US$ Bn) Analysis, By Market, 2019 - 2024
- By Country
- By Component
- By Application
- By Deployment
- By Vertical
- Current Market Size (US$ Bn) Analysis and Forecast, By Country, 2025 - 2032
- China
- Japan
- South Korea
- Current Market Size (US$ Bn) Analysis and Forecast, By Component, 2025 - 2032
- Solution
- In-memory Database (IMED)
- In-memory Data Grid (IMDG)
- Services
- Professional Services
- Managed Services
- Solution
- Current Market Size (US$ Bn) Analysis and Forecast, By Application, 2025 - 2032
- Risk Management and Fraud Detection
- Sentiment Analysis
- Geospatial/GIS Processing
- Sales and Marketing Optimization
- Predictive Analysis
- Supply Chain Management
- Image Processing
- Route Optimization
- Current Market Size (US$ Bn) Analysis and Forecast, By Deployment, 2025 - 2032
- On-premise
- Cloud
- Current Market Size (US$ Bn) Analysis and Forecast, By Vertical, 2025 - 2032
- BFSI
- IT and Telecom
- Manufacturing
- Healthcare and Lifestyle
- Education
- Retail and E-commerce
- Transportation and Logistics
- Government and Defense
- Energy and Utilities
- Media and Entertainment
- Market Attractiveness Analysis
- South Asia & Oceania In-memory Computing Market Outlook
- Key Highlights
- Historical Market Size (US$ Bn) Analysis, By Market, 2019 - 2024
- By Country
- By Component
- By Application
- By Deployment
- By Vertical
- Current Market Size (US$ Bn) Analysis and Forecast, By Country, 2025 - 2032
- India
- Southeast Asia
- ANZ
- Rest of South Asia & Oceania
- Current Market Size (US$ Bn) Analysis and Forecast, By Component, 2025 - 2032
- Solution
- In-memory Database (IMED)
- In-memory Data Grid (IMDG)
- Services
- Professional Services
- Managed Services
- Solution
- Current Market Size (US$ Bn) Analysis and Forecast, By Application, 2025 - 2032
- Risk Management and Fraud Detection
- Sentiment Analysis
- Geospatial/GIS Processing
- Sales and Marketing Optimization
- Predictive Analysis
- Supply Chain Management
- Image Processing
- Route Optimization
- Current Market Size (US$ Bn) Analysis and Forecast, By Deployment, 2025 - 2032
- On-premise
- Cloud
- Current Market Size (US$ Bn) Analysis and Forecast, By Vertical, 2025 - 2032
- BFSI
- IT and Telecom
- Manufacturing
- Healthcare and Lifestyle
- Education
- Retail and E-commerce
- Transportation and Logistics
- Government and Defense
- Energy and Utilities
- Media and Entertainment
- Market Attractiveness Analysis
- Latin America In-memory Computing Market Outlook
- Key Highlights
- Historical Market Size (US$ Bn) Analysis, By Market, 2019 - 2024
- By Country
- By Component
- By Application
- By Deployment
- By Vertical
- Current Market Size (US$ Bn) Analysis and Forecast, By Country, 2025 - 2032
- Brazil
- Mexico
- Rest of Latin America
- Current Market Size (US$ Bn) Analysis and Forecast, By Component, 2025 - 2032
- Solution
- In-memory Database (IMED)
- In-memory Data Grid (IMDG)
- Services
- Professional Services
- Managed Services
- Solution
- Current Market Size (US$ Bn) Analysis and Forecast, By Application, 2025 - 2032
- Risk Management and Fraud Detection
- Sentiment Analysis
- Geospatial/GIS Processing
- Sales and Marketing Optimization
- Predictive Analysis
- Supply Chain Management
- Image Processing
- Route Optimization
- Current Market Size (US$ Bn) Analysis and Forecast, By Deployment, 2025 - 2032
- On-premise
- Cloud
- Current Market Size (US$ Bn) Analysis and Forecast, By Vertical, 2025 - 2032
- BFSI
- IT and Telecom
- Manufacturing
- Healthcare and Lifestyle
- Education
- Retail and E-commerce
- Transportation and Logistics
- Government and Defense
- Energy and Utilities
- Media and Entertainment
- Market Attractiveness Analysis
- Middle East & Africa In-memory Computing Market Outlook
- Key Highlights
- Historical Market Size (US$ Bn) Analysis, By Market, 2019 - 2024
- By Country
- By Component
- By Application
- By Deployment
- By Vertical
- Current Market Size (US$ Bn) Analysis and Forecast, By Country, 2025 - 2032
- GCC Countries
- Egypt
- South Africa
- Northern Africa
- Rest of Middle East & Africa
- Current Market Size (US$ Bn) Analysis and Forecast, By Component, 2025 - 2032
- Solution
- In-memory Database (IMED)
- In-memory Data Grid (IMDG)
- Services
- Professional Services
- Managed Services
- Solution
- Current Market Size (US$ Bn) Analysis and Forecast, By Application, 2025 - 2032
- Risk Management and Fraud Detection
- Sentiment Analysis
- Geospatial/GIS Processing
- Sales and Marketing Optimization
- Predictive Analysis
- Supply Chain Management
- Image Processing
- Route Optimization
- Current Market Size (US$ Bn) Analysis and Forecast, By Deployment, 2025 - 2032
- On-premise
- Cloud
- Current Market Size (US$ Bn) Analysis and Forecast, By Vertical, 2025 - 2032
- BFSI
- IT and Telecom
- Manufacturing
- Healthcare and Lifestyle
- Education
- Retail and E-commerce
- Transportation and Logistics
- Government and Defense
- Energy and Utilities
- Media and Entertainment
- Market Attractiveness Analysis
- Competition Landscape
- Market Share Analysis, 2024
- Market Structure
- Competition Intensity Mapping By Market
- Competition Dashboard
- Company Profiles (Details - Overview, Financials, Strategy, Recent Developments)
- IBM
- Overview
- Segments and Components
- Key Financials
- Market Developments
- Market Strategy
- SAP SE
- Oracle Corporation
- SAS Institute
- Microsoft Corporation
- TIBCO Software Inc.
- Altibase
- GigaSpaces Technologies Inc.
- Software AG
- Intel Corporation
- Salesforce Inc.
- Workday, Inc.
- Fujitsu Limited
- QLIK
- IBM
- Appendix
- Research Methodology
- Research Assumptions
- Acronyms and Abbreviations


- Technology
- In-memory Computing Market
In-memory Computing Market Size, Share, and Growth Forecast, 2025 - 2032
In-memory Computing Market by Component (Solution, Service), by Application (Risk Management and Fraud Detection, Sentiment Analysis, Predictive Analysis), by Deployment (On-premise, Cloud), by Vertical, and Regional Analysis for 2025 - 2032
In-memory Computing Market Size and Trends
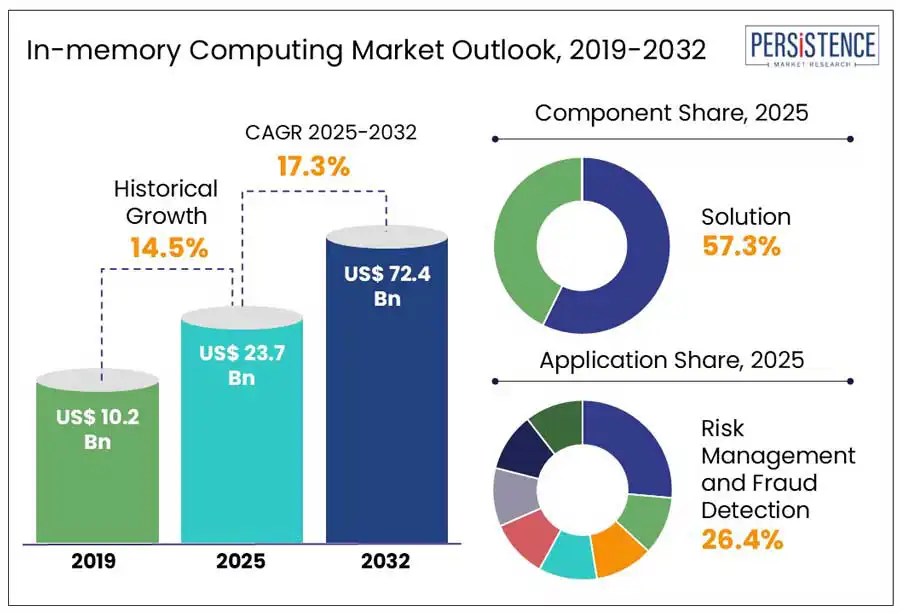
The global in-memory computing market size is projected to rise from US$ 23.7 Bn in 2025 to US$ 72.4 Bn by 2032. It is anticipated to witness a CAGR of 17.3% during the forecast period from 2025 to 2032. The rising transactional and analytical requirements across a wide range of industries worldwide is poised to propel the market. Increasing use of mobile banking and the internet often creates a surging requirement for large data processing, which is anticipated to boost the market. Demand for In-Memory Computing (IMC) is also expected to rise with the implementation of various government initiatives such as the Unique Identification Card (UID), aiming to promote digitization at the national level.
Key Industry Highlights
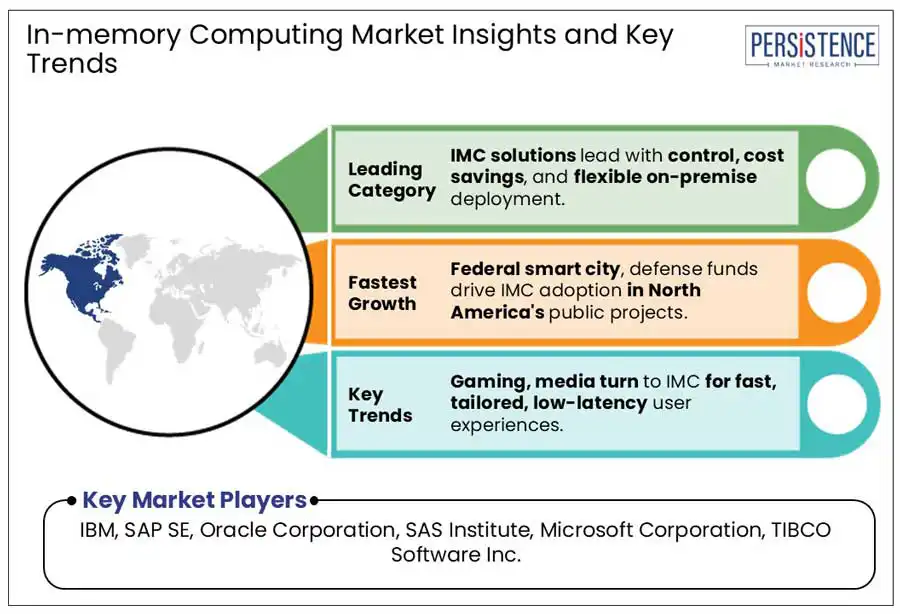
- North America is estimated to generate 27.3% share in 2025, backed by adoption of real-time analytics among various companies to initiate digital transformation.
- IMC solutions are predicted to hold 57.3% share in 2025 with their ability to provide high speed, which makes these suitable for handling big data workloads.
- Risk management and fraud detection is projected to account for 26.4% share in 2025 due to rise of cyberattacks that require proactive threat mitigation.
- Boom of e-commerce and digital payment platforms is poised to spur IMC deployment for real-time transaction handling.
- Adoption of in-memory graph databases is rising for real-time fraud detection and social network analysis.
|
Global Market Attribute |
Key Insights |
|
In-memory Computing Market Size (2025E) |
US$ 23.7 Bn |
|
Market Value Forecast (2032F) |
US$ 72.4 Bn |
|
Projected Growth (CAGR 2025 to 2032) |
17.3% |
|
Historical Market Growth (CAGR 2019 to 2024) |
14.5% |
Market Dynamics
Driver - Hyper-personalization and Predictive Analytics Features to Spur Demand
The global market is projected to surge through 2032 with the ability of IMC to spur digitization initiatives by enabling predictive analytics and hyper-personalization. IMC supports hyper-personalization by allowing systems to process contextual information, transactional history, and behavioral data in real time. Streaming services such as Spotify and Netflix, for example, utilize in-memory data grids to evaluate listening or viewing behavior to adjust recommendations accordingly.
IMC also enhances predictive analytics models by offering computational speed required to utilize machine learning algorithms in real time. Cerner Corporation, a pioneer in healthcare IT, for instance, has been using IMC to provide real-time insights into patient care with the integration of monitoring data, lab results, and Electronic Health Records (EHRs). It enables clinicians to make more informed and faster decisions.
Restraint - Budget Constraints and Data Risks to Challenge IMC Implementation
Even though IMC has several benefits, it has a few limitations that are anticipated to hamper demand in the foreseeable future. Compared to conventional storage options such as Solid-State Drives (SSDs) and Hard Disk Drives (HDDs), implementation of large-scale IMC solutions requires significant investments in supporting technologies, memory capacities, and high-performance servers. To configure in-memory platforms including SAP HANA, for example, the requirement of skilled personnel and purpose-built hardware is a must. Hence, companies with limited IT budgets often find it difficult to implement IMC.
Data recovery and persistence is another challenge in the market. There is a high risk of data loss in case of a system crash or power failure as IMC solutions store data in volatile memory. New technologies such as hybrid architecture and persistent memory often combine non-volatile storage with RAM. However, these are still at the nascent stage and require more research work to function well. It is expected to make IMC solutions less reliable in settings where regulatory compliance and data durability are important.
Opportunity - Surge in Algorithmic Trading Opens New Doors for IMC Providers
The financial services industry is predicted to create lucrative avenues for IMC solution providers. It is attributed to rising demand for instant decision-making, real-time transaction processing, and speedy analytics. Algorithmic trading will likely be a significant application of IMC in this industry with increasing requirement for machine-based buying and selling decisions in real time.
Renowned companies such as Goldman Sachs and JPMorgan Chase have already implemented IMC frameworks to improve market simulations and trading engines. During market fluctuations, IMC enables the operation of real-time risk models. As per a recent study, more than 80% of equity trades in the U.S. are now algorithmic. This showcases the importance of real-time data processing with IMC.
In-memory Computing Market Key Trends
Retail Sector to Adopt In-memory Computing for Real-time Business Decisions
Increasing integration of IMC into the retail sector is a key trend in the market. IMC solutions are enabling retailers to analyze sales performance, customer behavior, and inventory levels in real time, constantly influencing business decisions. Inditex, the parent company of Zara, for instance, utilizes real-time analytics to modify product placements and store inventory twice a week on the basis of customer feedback and live sales.
Supply chain optimization is another important area that IMC solutions are rapidly transforming. Real-time insight into inventory across various locations can help retailers reduce overstocking and stockouts, which frequently result in revenue loss. For instance, Walmart tracks product flow across more than 4,700 locations using real-time analytics backed by in-memory technologies. It helps enhance the company’s supply chain in response to real-time demand.
Category-wise Analysis
Component Insights
By component, the market is bifurcated into solution and service. Among these, the solution segment is expected to dominate by accounting for an in-memory computing market share of nearly 57.3% in 2025. This is primarily due to increasing demand for ready-to-deploy, full-fledged platforms for integration into enterprise IT systems.
Companies are estimated to mainly prefer IMC solutions that blend pre-configured analytics tools, software-defined architecture, and hardware-accelerated memory. These solutions are projected to enable companies to customize, scale, and deploy in-memory capabilities without relying on third-party service providers.
IMC services, on the other hand, are envisioned to see average growth through 2032 as companies adopting these depend on external consultants or managed services for maintenance and deployment. According to a survey, in 2022, more than 62% of companies preferred solution-based models over services for latency-critical, sensitive applications owing to improved customization and efficiency.
Application Insights
Based on application, the market is segregated into risk management and fraud detection, sentiment analysis, geospatial/GIS processing, sales and marketing optimization, predictive analysis, supply chain management, image processing, and route optimization. Out of these, risk management and fraud detection is projected to generate around 26.4% share in 2025, says Persistence Market Research.
Growth is attributed to the ability of IMC to evaluate and process large volumes of datasets in real time. This characteristic likely spurs the adoption among digital payment platforms, insurance companies, and financial institutions who require instant detection of fraud and risks. Transactional data is also analyzed with IMC, allowing for immediate response and detection.
Route optimization is also predicted to be a rapidly growing segment through 2032 due to increasing demand for new systems that can keep up with vast datasets generated by delivery schedules, GPS devices, weather updates, and traffic feeds. IMC can help instantly analyze these inputs, enabling logistics and transportation companies to alter routes on the go.
Regional Insights
North America In-memory Computing Market Trends
North America is anticipated to hold a 27.3% share in 2025. It is attributed to increasing investments in real-time analytics and a well-developed enterprise IT landscape. The U.S. in-memory computing market is expected to generate a lion’s share in 2025 as demand for instant insights and data analytics is increasing across various industries.
Healthcare facilities such as Kaiser Permanente and Mayo Clinic in the U.S. are adopting IMC solutions to maintain vast patient datasets for real-time operational forecasting and diagnostics. The defense and government sectors are also showing a keen interest in IMC platforms for initiating strategically essential applications requiring immediate data analysis and zero latency.
Asia Pacific In-memory Computing Market Trends
Rapid digital transformation across several industries is predicted to create new opportunities in Asia Pacific. China and India are likely to remain at the forefront of growth. In China, IMC platforms are showcasing steady adoption across key companies such as Tencent and Alibaba. They are using these platforms to support large-scale real-time analytics engines for transaction processing, fraud detection, and personalized advertising.
In India, retail, telecom, and banking sectors are exhibiting high adoption of IMC solutions. Banks in the country are constantly integrating these solutions to enhance customer personalization and evaluate real-time credit scoring. Increasing use of Unified Payments Interface (UPI), with more than 100 Bn transactions in 2023 alone, is another key factor estimated to propel demand for secure, ultra-fast data processing infrastructure.
Europe In-memory Computing Market Trends
The U.K. is poised to be a hotspot for IMC platform developers and service providers in Europe through 2032. The country’s media and entertainment industry is a recent adopter of IMC solutions to initiate personalized content recommendations. Local streaming services such as ITVX and BBC iPlayer are using IMC to provide personalized viewing suggestions based on regional preferences, device, time of day, and recent user behavior.
In Germany, use of IMC platforms is anticipated to rise in the field of education. The country is planning to boost its digital education scenario, especially under the DigitalPakt Schule initiative with an allocation of €5 Bn. IMC will likely become a key component for the management of vast digital content. Increasing demand for streamlined backend processes such as resource allocation, fee management, student records, and admissions is also likely to create opportunities.
Competitive Landscape
The global in-memory computing market is highly competitive with the presence of various well-established companies. They are focusing on developing new solutions and services by integrating innovative technologies.
A few companies are embracing strategies such as collaborations, partnerships, and mergers and acquisitions to gain a competitive advantage. The market will likely see the entry of several start-ups focusing on gaining funds to accelerate product development.
Key Industry Developments
- In February 2025, EnCharge AI, a start-up focusing on the development of analog in-memory-computing AI chips, bagged over US$ 100 Mn in Series B funding. The fund will help the company commercialize its first client computing-based AI accelerator products in 2025.
- In January 2025, Vertical Compute raised €20 Mn to commercialize in-memory computing chiplet technology produced at Imec in Belgium. The chiplet will be based on spin MRAM technology. It can lower power consumption by 80% and boost the execution of large language models for AI by 100%.
- In September 2024, TetraMem, Inc. integrated energy-efficient in-memory computing with Andes RISC-V vector processor. The company used multi-level RRAM (memristor) technology to provide various benefits over conventional single level cell memory technologies.
Companies Covered in In-memory Computing Market
- IBM
- SAP SE
- Oracle Corporation
- SAS Institute
- Microsoft Corporation
- TIBCO Software Inc.
- Altibase
- GigaSpaces Technologies Inc.
- Software AG
- Intel Corporation
- Salesforce Inc.
- Workday, Inc.
- Fujitsu Limited
- QLIK
Frequently Asked Questions
The global market is projected to be valued at US$ 23.7 Bn in 2025.
Increasing demand for real-time transaction processing across banks and the requirement for supply chain optimization in logistics firms are the key market drivers.
The market is poised to witness a CAGR of 17.3% from 2025 to 2032.
Adoption of IMC platforms in the retail sector and rising demand for personalized content recommendations among streaming service providers are the key market opportunities.
IBM, SAP SE, and Oracle Corporation are a few key players.


