

- Executive Summary
- Global Humanized Liver Mice Model Market Snapshot 2026 and 2033
- Market Opportunity Assessment, 2026-2033, US$ Mn
- Key Market Trends
- Industry Developments and Key Market Events
- Demand Side and Supply-Side Analysis
- PMR Analysis and Recommendations
- Market Overview
- Market Scope and Definitions
- Market Dynamics
- Driver
- Restraint
- Opportunities
- Trends
- Macro-Economic Factors
- Global GDP Outlook
- Global Prison Growth Outlook
- Global Prison Population by Country
- Global Private Prison Market Growth Outlook
- Forecast Factors – Relevance and Impact
- COVID-19 Impact Assessment
- Value Added Insights
- Value Chain analysis
- Key Market Players
- Product Adoption Analysis
- Key Promotional Strategies by key players
- PESTLE Analysis
- Porter's Five Forces Analysis
- Regulatory and Technology Landscape
- Global Humanized Liver Mice Model Market Outlook: Historical (2020 – 2025) and Forecast (2026 – 2033)
- Key Highlights
- Global Humanized Liver Mice Model Market Outlook: Model Type
- Introduction/Key Findings
- Historical Market Size (US$ Mn) Analysis by Model Type, 2020-2025
- Current Market Size (US$ Mn) Forecast, by Model Type, 2026-2033
- Genetic
- Cell Based
- Market Attractiveness Analysis: Model Type
- Global Humanized Liver Mice Model Market Outlook: Application
- Introduction/Key Findings
- Historical Market Size (US$ Mn) Analysis by Application, 2020-2025
- Current Market Size (US$ Mn) Forecast, by Application, 2026-2033
- Oncology
- Immunology
- Neuroscience
- Market Attractiveness Analysis: Application
- Global Humanized Liver Mice Model Market Outlook: End User
- Introduction/Key Findings
- Historical Market Size (US$ Mn) Analysis by End User, 2020-2025
- Current Market Size (US$ Mn) Forecast, by End User, 2026-2033
- Research Institutes
- Biotech Companies
- Hospitals
- Market Attractiveness Analysis: End User
- Global Humanized Liver Mice Model Market Outlook: Region
- Key Highlights
- Historical Market Size (US$ Mn) Analysis by Region, 2020-2025
- Current Market Size (US$ Mn) Forecast by Region, 2026-2033
- North America
- Europe
- East Asia
- South Asia & Oceania
- Latin America
- Middle East & Africa
- Market Attractiveness Analysis: Region
- North America Humanized Liver Mice Model Market Outlook: Historical (2020 – 2025) and Forecast (2026 – 2033)
- Key Highlights
- North America Market Size (US$ Mn) Forecast, by Country, 2026-2033
- U.S.
- Canada
- North America Market Size (US$ Mn) Forecast, by Model Type, 2026-2033
- Genetic
- Cell Based
- North America Market Size (US$ Mn) Forecast, by Application, 2026-2033
- Oncology
- Immunology
- Neuroscience
- North America Market Size (US$ Mn) Forecast, by End User, 2026-2033
- Research Institutes
- Biotech Companies
- Hospitals
- Europe Humanized Liver Mice Model Market Outlook: Historical (2020 – 2025) and Forecast (2026 – 2033)
- Key Highlights
- Europe Market Size (US$ Mn) Forecast, by Country, 2026-2033
- Germany
- Italy
- France
- U.K.
- Spain
- Russia
- Rest of Europe
- Europe Market Size (US$ Mn) Forecast, by Model Type, 2026-2033
- Genetic
- Cell Based
- Europe Market Size (US$ Mn) Forecast, by Application, 2026-2033
- Oncology
- Immunology
- Neuroscience
- Europe Market Size (US$ Mn) Forecast, by End User, 2026-2033
- Research Institutes
- Biotech Companies
- Hospitals
- East Asia Humanized Liver Mice Model Market Outlook: Historical (2020 – 2025) and Forecast (2026 – 2033)
- Key Highlights
- East Asia Market Size (US$ Mn) Forecast, by Country, 2026-2033
- China
- Japan
- South Korea
- East Asia Market Size (US$ Mn) Forecast, by Model Type, 2026-2033
- Genetic
- Cell Based
- East Asia Market Size (US$ Mn) Forecast, by Application, 2026-2033
- Oncology
- Immunology
- Neuroscience
- East Asia Market Size (US$ Mn) Forecast, by End User, 2026-2033
- Research Institutes
- Biotech Companies
- Hospitals
- South Asia & Oceania Humanized Liver Mice Model Market Outlook: Historical (2020 – 2025) and Forecast (2026 – 2033)
- Key Highlights
- South Asia & Oceania Market Size (US$ Mn) Forecast, by Country, 2026-2033
- India
- Southeast Asia
- ANZ
- Rest of SAO
- South Asia & Oceania Market Size (US$ Mn) Forecast, by Model Type, 2026-2033
- Genetic
- Cell Based
- South Asia & Oceania Market Size (US$ Mn) Forecast, by Application, 2026-2033
- Oncology
- Immunology
- Neuroscience
- South Asia & Oceania Market Size (US$ Mn) Forecast, by End User, 2026-2033
- Research Institutes
- Biotech Companies
- Hospitals
- Latin America Humanized Liver Mice Model Market Outlook: Historical (2020 – 2025) and Forecast (2026 – 2033)
- Key Highlights
- Latin America Market Size (US$ Mn) Forecast, by Country, 2026-2033
- Brazil
- Mexico
- Rest of LATAM
- Latin America Market Size (US$ Mn) Forecast, by Model Type, 2026-2033
- Genetic
- Cell Based
- Latin America Market Size (US$ Mn) Forecast, by Application, 2026-2033
- Oncology
- Immunology
- Neuroscience
- Latin America Market Size (US$ Mn) Forecast, by End User, 2026-2033
- Research Institutes
- Biotech Companies
- Hospitals
- Middle East & Africa Humanized Liver Mice Model Market Outlook: Historical (2020 – 2025) and Forecast (2026 – 2033)
- Key Highlights
- Middle East & Africa Market Size (US$ Mn) Forecast, by Country, 2026-2033
- GCC Countries
- South Africa
- Northern Africa
- Rest of MEA
- Middle East & Africa Market Size (US$ Mn) Forecast, by Model Type, 2026-2033
- Genetic
- Cell Based
- Middle East & Africa Market Size (US$ Mn) Forecast, by Application, 2026-2033
- Oncology
- Immunology
- Neuroscience
- Middle East & Africa Market Size (US$ Mn) Forecast, by End User, 2026-2033
- Research Institutes
- Biotech Companies
- Hospitals
- Competition Landscape
- Market Share Analysis, 2025
- Market Structure
- Competition Intensity Mapping
- Competition Dashboard
- Company Profiles
- Ingenious Targeting Laboratory
- Company Overview
- Product Portfolio/Offerings
- Key Financials
- SWOT Analysis
- Company Strategy and Key Developments
- Axenis S.A.S
- Trans Genic Inc.
- Horizon Discovery Group PLC
- HuMurine Technologies
- Champions Oncology Inc.
- Genoway S.A.
- Crown Bioscience Inc.
- Taconic Biosciences Inc.
- The Jackson Laboratory
- Vitalstar Biotechnology Co. Ltd.
- Others
- Ingenious Targeting Laboratory
- Appendix
- Research Methodology
- Research Assumptions
- Acronyms and Abbreviations


- Biotechnology
- Humanized Liver Mice Model Market
Humanized Liver Mice Model Market Size, Share, and Growth Forecast 2026 - 2033
Humanized Liver Mice Model Market by Model Type (Genetic, Cell Based), by Application (Oncology, Immunology, Neuroscience), by End User (Research Institutes, Biotech Companies, Hospitals), by Regional Analysis, 2026-2033
Humanized Liver Mice Model Market Size and Trend Analysis
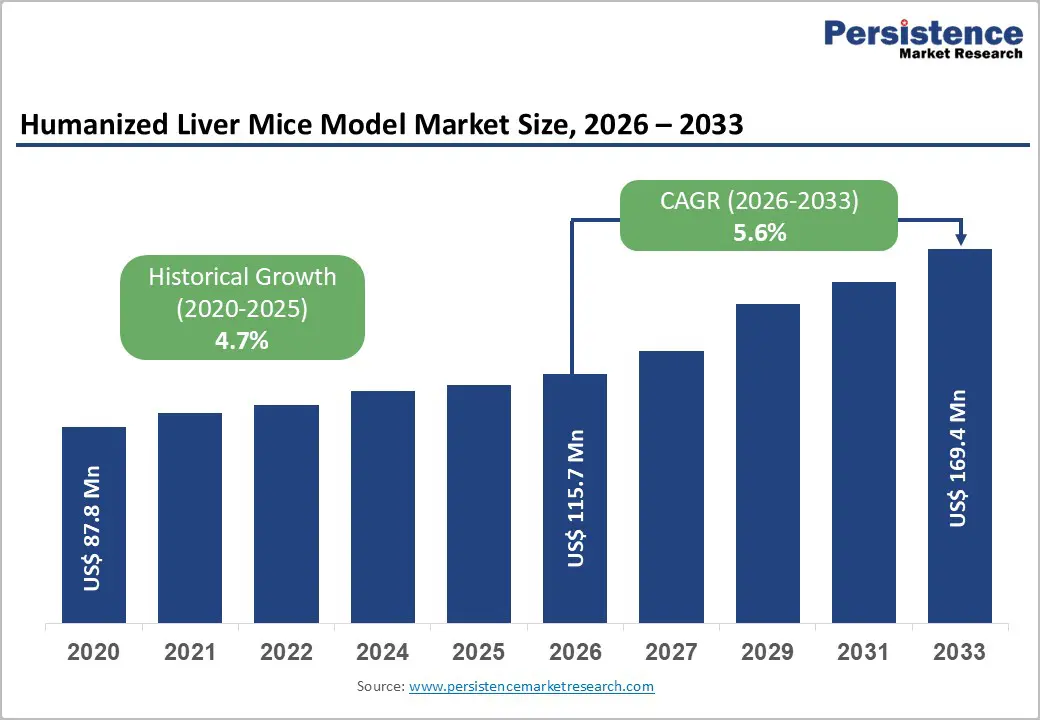
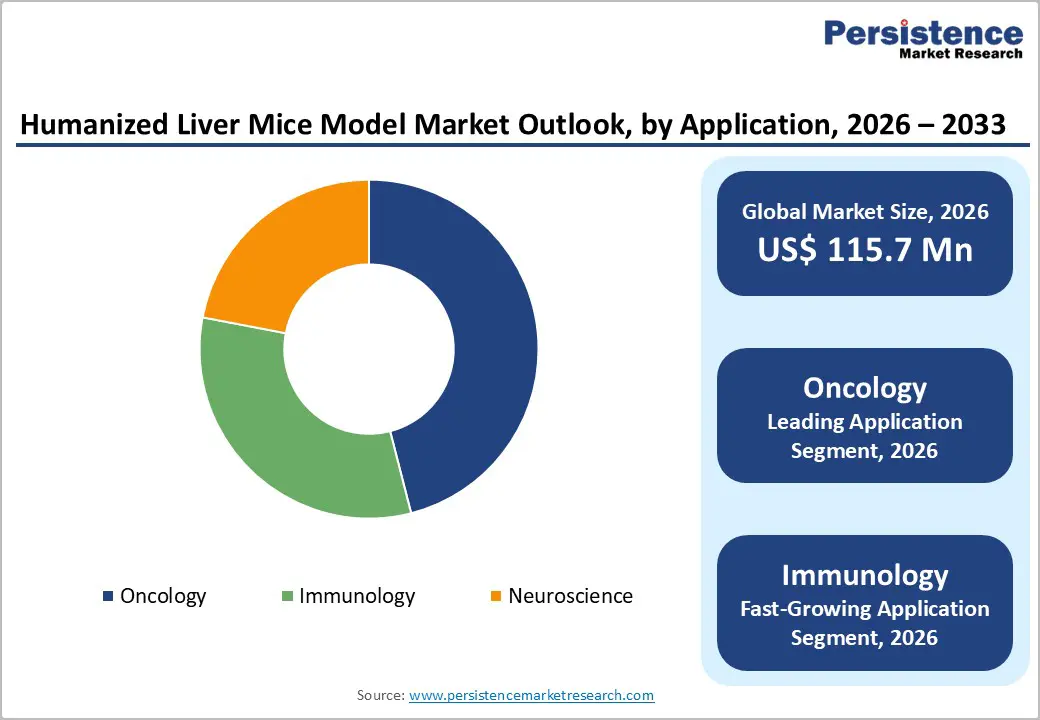
The global Humanized Liver Mice Model Market size is expected to be valued at US$ 115.7 million in 2026 and projected to reach US$ 169.4 million by 2033, growing at a CAGR of 5.6% between 2026 and 2033.
The humanized liver mice model market is gaining momentum due to the surging demand for human-relevant preclinical testing. These models help bridge interspecies gaps in drug metabolism and toxicity studies, offering high translational accuracy. With 70–90% human hepatocyte chimerism, they closely replicate human liver structure and function, enabling more reliable evaluation of pharmacokinetics and safety profiles during early-stage drug development.
Additionally, the rising global burden of liver diseases such as hepatitis, liver cirrhosis, and hepatocellular carcinoma is accelerating research activity. Increasing FDA approvals for liver-related therapies further stimulate pharmaceutical R&D investments, strengthening the adoption of humanized liver mice models across preclinical research pipelines.
Key Market highlights
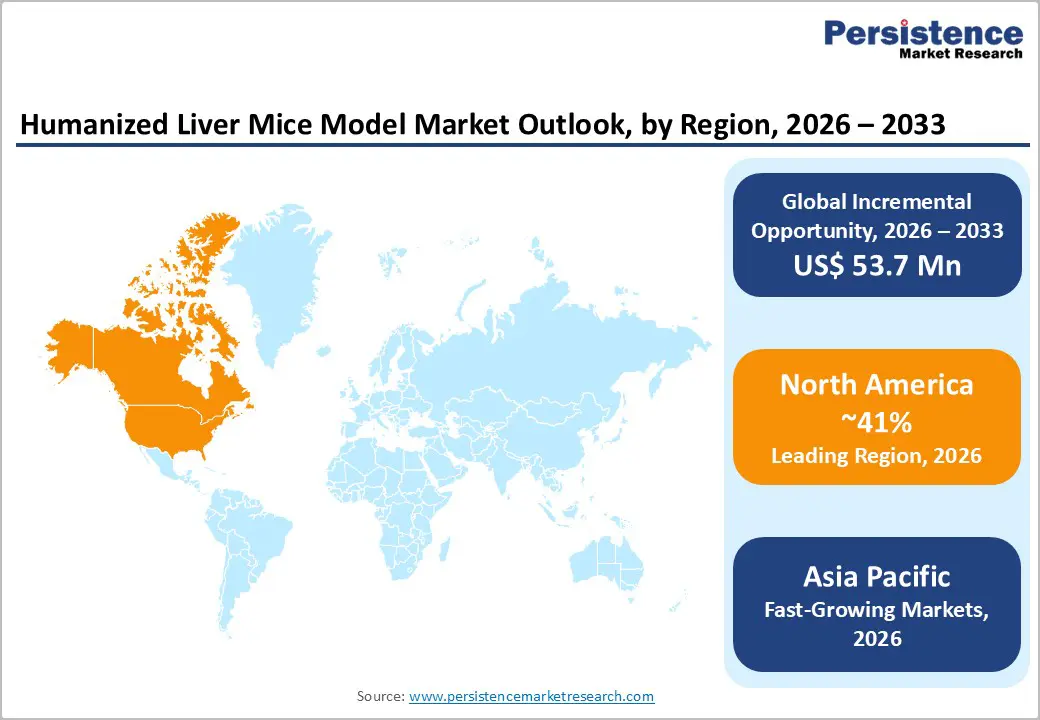
- North America remains the largest market, supported by strong biomedical research funding, advanced infrastructure, and high adoption in drug development studies.
- Asia Pacific is projected to be the fastest-growing region, driven by rising liver disease burden, expanding research facilities, and increasing pharmaceutical investments.
- Genetic humanized liver mice models hold the largest share due to superior physiological relevance, consistency, and widespread use in preclinical drug testing.
- CRISPR-based humanized models represent the fastest-growing segment, fuelled by demand for precision modelling, faster development timelines, and improved translational outcomes.
| Key Insights | Details |
|---|---|
| Humanized Liver Mice Model Market Size (2026E) | US$ 115.7 Mn |
| Market Value Forecast (2033F) | US$ 169.4 Mn |
| Projected Growth (CAGR 2026 to 2033) | 5.6% |
| Historical Market Growth (CAGR 2020 to 2025) | 4.7% |
Market Dynamics
Driver: Advancements in Research Technologies and Rising Liver Disease Burden
Technological advancements are a major driver of growth in the humanized liver mice model market, enabling the development of highly sophisticated and reliable preclinical models. Modern models such as PPARα- and AFC8-based mice more closely replicate human liver physiology, offering improved stability, functional consistency, and predictive accuracy. The transition from basic immunodeficient mice implanted with human hepatocytes to advanced chimeric models that naturally replace murine liver tissue with human cells has significantly enhanced translational research outcomes. These innovations allow researchers to conduct more precise studies on drug metabolism, toxicity, and liver-specific disease mechanisms, increasing confidence in preclinical data and accelerating drug development pipelines.
In parallel, the rising global prevalence of liver diseases is intensifying demand for humanized liver mice models. Conditions such as hepatitis B, hepatitis C, liver cirrhosis, and hepatocellular carcinoma continue to pose major public health challenges, particularly in Asia and Africa. Humanized liver mice models play a critical role in understanding disease progression and evaluating novel therapeutics in a biologically relevant environment. As pharmaceutical companies and research institutions increase investments in liver disease research and antiviral drug development, the need for robust preclinical models is expected to drive sustained market growth.
Restraint: High Model Costs and Stringent Regulatory Requirements
The high cost associated with humanized liver mice models remains a significant restraint on market growth. These models require complex genetic engineering, human cell engraftment, and specialized animal care, resulting in substantially higher costs compared to conventional laboratory mice. While standard immunodeficient mice may cost between USD 140 and USD 500, advanced chimeric humanized liver mice models can range from USD 2,500 to USD 3,500 per animal. Additional expenses related to specialized housing, skilled personnel, and temperature-controlled shipping further increase the financial burden, limiting adoption among smaller research organizations and academic institutions with constrained budgets.
Stringent regulatory and ethical requirements further restrict market expansion. The use of animal models is governed by strict regulatory frameworks emphasizing humane treatment and ethical justification, such as the 3Rs principle replacement, reduction, and refinement. Compliance with these regulations requires extensive documentation, ethical approvals, and ongoing monitoring, which can delay study initiation and raise operational costs. Lengthy approval timelines and regulatory complexity can discourage researchers and slow innovation. Together, high costs and regulatory hurdles reduce accessibility and scalability, acting as key constraints on the broader adoption of humanized liver mice models.
Opportunity: Genetic Editing Innovations and Expansion into Emerging Markets
The integration of advanced genetic editing technologies, particularly CRISPR-Cas9, presents a significant opportunity for the humanized liver mice model market. CRISPR-based tools enable precise genome editing, allowing researchers to create models with specific human gene expressions and liver functions that closely mimic human physiology. This precision improves model reliability and relevance for studying complex liver diseases and drug responses. Additionally, CRISPR technology reduces development timelines and costs associated with generating customized humanized models, making them more accessible to a wider research community. As genetic engineering tools continue to evolve, they are expected to enhance model performance and expand application areas in toxicology, virology, and personalized medicine.
Another major opportunity lies in expansion across emerging markets, particularly in Asia Pacific and Latin America. These regions are witnessing increased investments in healthcare infrastructure, biomedical research, and pharmaceutical manufacturing. High prevalence of hepatitis B and C further amplifies the need for advanced preclinical liver models. By establishing regional facilities, forming partnerships with local research institutions, and supporting government-led research initiatives, companies can tap into new revenue streams and strengthen their global footprint. This geographic expansion is expected to unlock long-term growth opportunities for the humanized liver mice model market.
Category-wise Insights
Model Type Analysis
Genetic humanized mouse models dominate the model type segmentation due to their critical role in accelerating drug discovery and preclinical research. These models are engineered to express human genes or develop functional human liver tissue, enabling accurate evaluation of human-specific drug metabolism, toxicity, and disease pathways. Pharmaceutical and biotechnology companies extensively rely on genetic humanized models to generate reliable translational data before advancing candidates into clinical trials. Their ability to reduce late-stage drug failures and regulatory confidence has positioned them as the leading revenue-generating segment. Additionally, academic and contract research institutions increasingly adopt these models for experimental analysis, reinforcing their widespread use. Continuous improvements in genetic engineering techniques further enhance model stability and reproducibility, strengthening the dominance of genetic humanized mouse models in the market.
Application Analysis
Oncology represents the leading application segment in the humanized mice model market, driven by the growing global burden of cancer and the demand for advanced preclinical research tools. Humanized mouse models are extensively used to study tumor biology, cancer progression, and tumor–host interactions in a human-relevant environment. These models enable precise evaluation of anticancer drugs, immunotherapies, and targeted treatments, improving the predictive accuracy of preclinical studies. By closely replicating the complexity of human tumors, they help researchers assess treatment efficacy and safety more effectively. As cancer remains a major global health challenge, continued investment in oncology research sustains strong demand for humanized mouse models, reinforcing the segment’s leadership and long-term growth potential.
Regional Insights
North America Humanized Liver Mice Model Market Trends and Insights
The humanized liver mice model market in North America is projected to witness substantial growth, supported by the increasing demand for personalized and precision medicine. Pharmaceutical and biotechnology companies in the region are actively adopting humanized mouse models for preclinical studies to better predict human-specific drug metabolism, toxicity, and therapeutic response. Continuous advancements in genetic engineering and genome-editing technologies, such as CRISPR-based tools, have improved the accuracy, stability, and relevance of these models. Academic research institutes and contract research organizations increasingly rely on humanized liver mice to study complex liver diseases and evaluate novel drug candidates. Moreover, North America benefits from a robust healthcare ecosystem, strong regulatory frameworks, and significant investments in biomedical research and development. Government funding, private sector investments, and collaborations between industry and academia further strengthen the research environment. These factors collectively support sustained market growth and position North America as a key revenue-generating region for humanized liver mice models.
Asia Pacific Humanized Liver Mice Model Market Trends and Insights
Asia Pacific is emerging as a high-growth region in the humanized liver mice model market, driven by expanding pharmaceutical research, rising prevalence of liver diseases, and increasing focus on translational medicine. Countries such as China, Japan, South Korea, and India are investing heavily in biotechnology infrastructure and preclinical research capabilities. The high burden of hepatitis B and C across the region is accelerating demand for advanced liver disease models to support drug discovery and validation. Governments and private organizations are promoting research collaborations and funding initiatives to strengthen life sciences research. Additionally, the growing presence of contract research organizations and academic institutes is improving access to advanced animal models. Cost-effective research environments and increasing adoption of genetic engineering technologies further support market expansion. As regulatory frameworks mature and research standards align with global practices, Asia Pacific is expected to witness strong adoption of humanized liver mice models over the forecast period.
Competitive Landscape
Market Structure Analysis
The competitive landscape of the humanized liver mice model market is shaped by the presence of several prominent players emphasizing innovation and continuous expansion of their product offerings. Leading companies are making substantial investments in research and development to deliver highly reliable and functionally efficient humanized models.
Strategic collaborations, mergers, and acquisitions are commonly pursued to strengthen technological capabilities and broaden market reach. Competition is further intensified by rapid advancements in genetic engineering tools, particularly CRISPR-Cas9, which enable the development of more advanced and physiologically relevant models. Moreover, the growing demand for preclinical drug testing and the increasing global burden of liver diseases continue to fuel competitive dynamics across the market.?
Key Market Developments
- January 2022: Taconic Biosciences, Inc. (US) launched the huNOG-EXL EA (early access) humanized immune system (HIS) mouse model.
- October 2021: The Jackson Laboratory (US) acquired the Research Models & Services (RMS) business of Charles River Laboratories Japan, Inc., making it a wholly owned subsidiary.
Companies Covered in Humanized Liver Mice Model Market
- Ingenious Targeting Laboratory
- Axenis S.A.S
- Trans Genic Inc.
- Horizon Discovery Group PLC
- HuMurine Technologies
- Champions Oncology Inc.
- Genoway S.A.
- Crown Bioscience Inc.
- Taconic Biosciences Inc.
- The Jackson Laboratory
- Vitalstar Biotechnology Co. Ltd.
- Others
Frequently Asked Questions
The global humanized liver mice model market is expected to reach US$ 115.7 million in 2026.
Rising drug development activity, increasing liver disease prevalence, need for predictive preclinical models, and advancements in genetic engineering technologies.
North America leads with 41% share in 2025.
Growing adoption in personalized medicine, gene therapy research, and toxicity testing creates strong opportunities for specialized humanized liver mouse models.
Leaders include Ingenious Targeting Laboratory, Axenis S.A.S, Trans Genic Inc., Horizon Discovery Group PLC, and HuMurine Technologies.


