


- Executive Summary
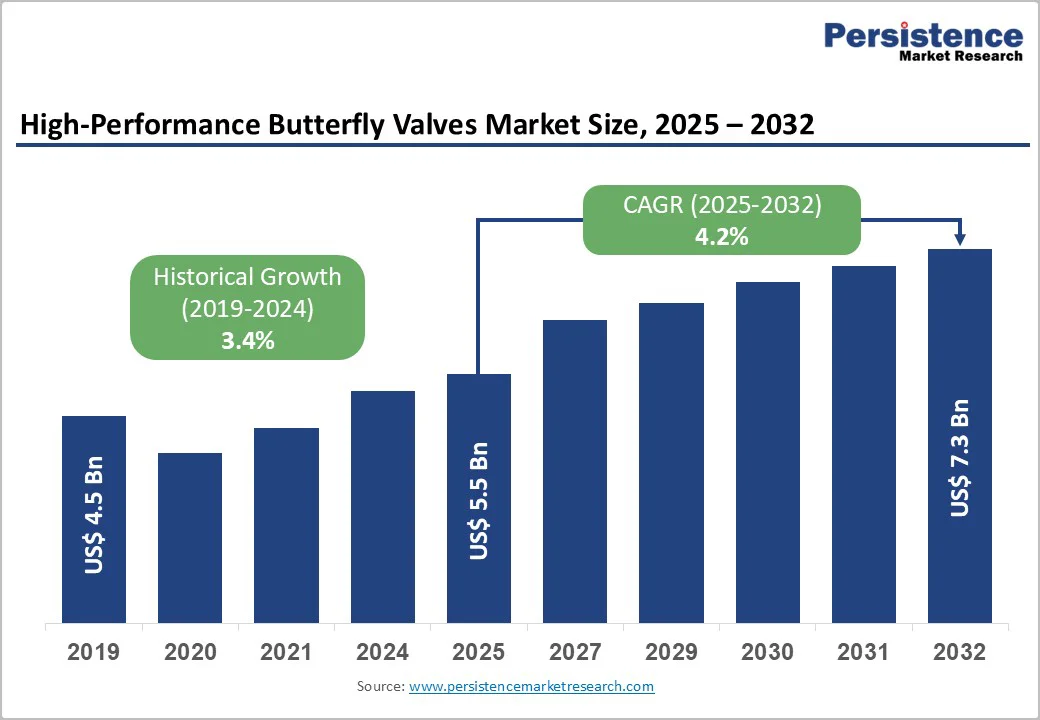
- Global High-Performance Butterfly Valve Market Snapshot 2024 and 2032
- Market Opportunity Assessment, 2024 - 2032, US$ Mn
- Key Market Trends
- Industry Developments and Key Market Events
- Demand Side and Supply Side Analysis
- PMR Analysis and Recommendations
- Market Overview
- Market Scope and Definitions
- Value Chain Analysis
- Macro-Economic Factors
- Global GDP Outlook
- Global Chemicals Industry Overview
- Global Oil & Gas Industry Overview
- Global Industrial Valves Market Overview
- Forecast Factors - Relevance and Impact
- COVID-19 Impact Assessment
- PESTLE Analysis
- Porter's Five Forces Analysis
- Geopolitical Tensions: Market Impact
- Regulatory and Technology Landscape
- Market Dynamics
- Drivers
- Restraints
- Opportunities
- Trends
- Price Trend Analysis, 2019 - 2032
- Region-wise Price Analysis
- Price by Segments
- Price Impact Factors
- Global High-Performance Butterfly Valve Market Outlook:
- Key Highlights
- Global High-Performance Butterfly Valve Market Outlook: Product Type
- Introduction/Key Findings
- Historical Market Size (US$ Mn) and Volume (Units) Analysis by Product Type, 2019-2023
- Current Market Size (US$ Mn) and Volume (Units) Analysis and Forecast, by Product Type, 2024-2032
- Double Offset Butterfly Valve
- Triple Offset Butterfly Valve
- Market Attractiveness Analysis: Product Type
- Global High-Performance Butterfly Valve Market Outlook: Seat Type
- Introduction/Key Findings
- Historical Market Size (US$ Mn) and Volume (Units) Analysis by Seat Type, 2019-2023
- Current Market Size (US$ Mn) and Volume (Units) Analysis and Forecast, by Seat Type, 2024-2032
- Soft Seat
- Metal Seat
- Market Attractiveness Analysis: Seat Type
- Global High-Performance Butterfly Valve Market Outlook: Valve Size
- Introduction/Key Findings
- Historical Market Size (US$ Mn) and Volume (Units) Analysis by Valve Size, 2019-2023
- Current Market Size (US$ Mn) and Volume (Units) Analysis and Forecast, by Valve Size, 2024-2032
- Small (Up to 10 inches)
- Medium (10-25 inches)
- Large (Above 25 inches)
- Market Attractiveness Analysis: Valve Size
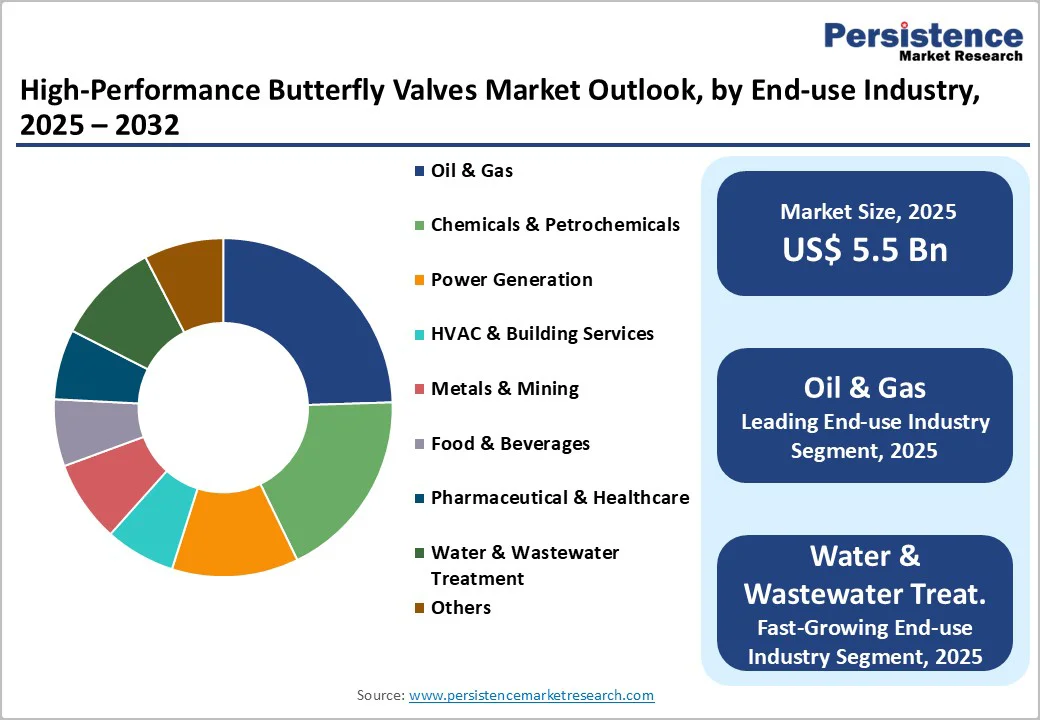
- Global High-Performance Butterfly Valve Market Outlook: End-use Industry
- Introduction/Key Findings
- Historical Market Size (US$ Mn) and Volume (Units) Analysis by End-use Industry, 2019-2023
- Current Market Size (US$ Mn) and Volume (Units) Analysis and Forecast, by End-use Industry, 2024-2032
- Oil & Gas
- Chemicals & Petrochemicals
- Power Generation
- HVAC & Building Services
- Metals & Mining
- Food & Beverages
- Pharmaceutical & Healthcare
- Water & Wastewater Treatment
- Others
- Market Attractiveness Analysis: End-use Industry
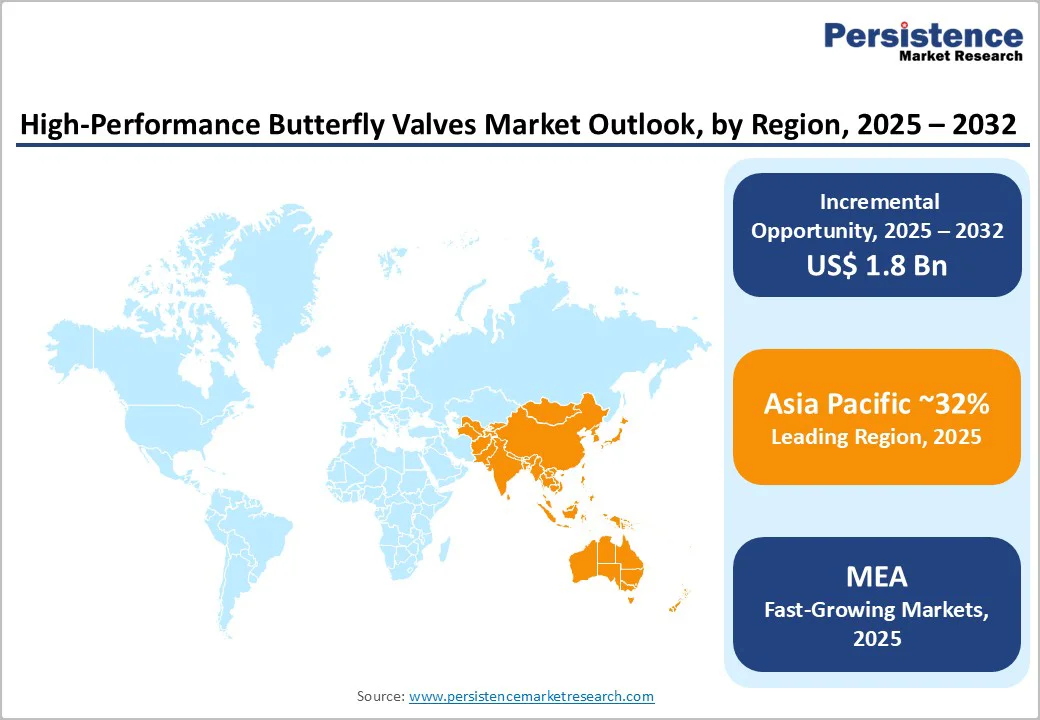
- Global High-Performance Butterfly Valve Market Outlook: Region
- Key Highlights
- Historical Market Size (US$ Mn) and Volume (Units) Analysis by Region, 2019-2023
- Current Market Size (US$ Mn) and Volume (Units) Analysis and Forecast, by Region, 2024-2032
- North America
- Europe
- East Asia
- South Asia & Oceania
- Latin America
- Middle East & Africa
- Market Attractiveness Analysis: Region
- North America High-Performance Butterfly Valve Market Outlook:
- Key Highlights
- Pricing Analysis
- North America Market Size (US$ Mn) and Volume (Units) Analysis and Forecast, by Country, 2024-2032
- U.S.
- Canada
- North America Market Size (US$ Mn) and Volume (Units) Analysis and Forecast, by Product Type, 2024-2032
- Double Offset Butterfly Valve
- Triple Offset Butterfly Valve
- North America Market Size (US$ Mn) and Volume (Units) Analysis and Forecast, by Seat Type, 2024-2032
- Soft Seat
- Metal Seat
- North America Market Size (US$ Mn) and Volume (Units) Analysis and Forecast, by Valve Size, 2024-2032
- Small (Up to 10 inches)
- Medium (10-25 inches)
- Large (Above 25 inches)
- North America Market Size (US$ Mn) and Volume (Units) Analysis and Forecast, by End-use Industry, 2024-2032
- Oil & Gas
- Chemicals & Petrochemicals
- Power Generation
- HVAC & Building Services
- Metals & Mining
- Food & Beverages
- Pharmaceutical & Healthcare
- Water & Wastewater Treatment
- Others
- Europe High-Performance Butterfly Valve Market Outlook:
- Key Highlights
- Pricing Analysis
- Europe Market Size (US$ Mn) and Volume (Units) Analysis and Forecast, by Country, 2024-2032
- Germany
- Italy
- France
- U.K.
- Spain
- Russia
- Rest of Europe
- Europe Market Size (US$ Mn) and Volume (Units) Analysis and Forecast, by Product Type, 2024-2032
- Double Offset Butterfly Valve
- Triple Offset Butterfly Valve
- Europe Market Size (US$ Mn) and Volume (Units) Analysis and Forecast, by Seat Type, 2024-2032
- Soft Seat
- Metal Seat
- Europe Market Size (US$ Mn) and Volume (Units) Analysis and Forecast, by Valve Size, 2024-2032
- Small (Up to 10 inches)
- Medium (10-25 inches)
- Large (Above 25 inches)
- Europe Market Size (US$ Mn) and Volume (Units) Analysis and Forecast, by End-use Industry, 2024-2032
- Oil & Gas
- Chemicals & Petrochemicals
- Power Generation
- HVAC & Building Services
- Metals & Mining
- Food & Beverages
- Pharmaceutical & Healthcare
- Water & Wastewater Treatment
- Others
- East Asia High-Performance Butterfly Valve Market Outlook:
- Key Highlights
- Pricing Analysis
- East Asia Market Size (US$ Mn) and Volume (Units) Analysis and Forecast, by Country, 2024-2032
- China
- Japan
- South Korea
- East Asia Market Size (US$ Mn) and Volume (Units) Analysis and Forecast, by Product Type, 2024-2032
- Double Offset Butterfly Valve
- Triple Offset Butterfly Valve
- East Asia Market Size (US$ Mn) and Volume (Units) Analysis and Forecast, by Seat Type, 2024-2032
- Soft Seat
- Metal Seat
- East Asia Market Size (US$ Mn) and Volume (Units) Analysis and Forecast, by Valve Size, 2024-2032
- Small (Up to 10 inches)
- Medium (10-25 inches)
- Large (Above 25 inches)
- East Asia Market Size (US$ Mn) and Volume (Units) Analysis and Forecast, by End-use Industry, 2024-2032
- Oil & Gas
- Chemicals & Petrochemicals
- Power Generation
- HVAC & Building Services
- Metals & Mining
- Food & Beverages
- Pharmaceutical & Healthcare
- Water & Wastewater Treatment
- Others
- South Asia & Oceania High-Performance Butterfly Valve Market Outlook:
- Key Highlights
- Pricing Analysis
- South Asia & Oceania Market Size (US$ Mn) and Volume (Units) Analysis and Forecast, by Country, 2024-2032
- India
- Southeast Asia
- ANZ
- Rest of SAO
- South Asia & Oceania Market Size (US$ Mn) and Volume (Units) Analysis and Forecast, by Product Type, 2024-2032
- Double Offset Butterfly Valve
- Triple Offset Butterfly Valve
- South Asia & Oceania Market Size (US$ Mn) and Volume (Units) Analysis and Forecast, by Seat Type, 2024-2032
- Soft Seat
- Metal Seat
- South Asia & Oceania Market Size (US$ Mn) and Volume (Units) Analysis and Forecast, by Valve Size, 2024-2032
- Small (Up to 10 inches)
- Medium (10-25 inches)
- Large (Above 25 inches)
- South Asia & Oceania Market Size (US$ Mn) and Volume (Units) Analysis and Forecast, by End-use Industry, 2024-2032
- Oil & Gas
- Chemicals & Petrochemicals
- Power Generation
- HVAC & Building Services
- Metals & Mining
- Food & Beverages
- Pharmaceutical & Healthcare
- Water & Wastewater Treatment
- Others
- Latin America High-Performance Butterfly Valve Market Outlook:
- Key Highlights
- Pricing Analysis
- Latin America Market Size (US$ Mn) and Volume (Units) Analysis and Forecast, by Country, 2024-2032
- Brazil
- Mexico
- Rest of LATAM
- Latin America Market Size (US$ Mn) and Volume (Units) Analysis and Forecast, by Product Type, 2024-2032
- Double Offset Butterfly Valve
- Triple Offset Butterfly Valve
- Latin America Market Size (US$ Mn) and Volume (Units) Analysis and Forecast, by Seat Type, 2024-2032
- Soft Seat
- Metal Seat
- Latin America Market Size (US$ Mn) and Volume (Units) Analysis and Forecast, by Valve Size, 2024-2032
- Small (Up to 10 inches)
- Medium (10-25 inches)
- Large (Above 25 inches)
- Latin America Market Size (US$ Mn) and Volume (Units) Analysis and Forecast, by End-use Industry, 2024-2032
- Oil & Gas
- Chemicals & Petrochemicals
- Power Generation
- HVAC & Building Services
- Metals & Mining
- Food & Beverages
- Pharmaceutical & Healthcare
- Water & Wastewater Treatment
- Others
- Middle East & Africa High-Performance Butterfly Valve Market Outlook:
- Key Highlights
- Pricing Analysis
- Middle East & Africa Market Size (US$ Mn) and Volume (Units) Analysis and Forecast, by Country, 2024-2032
- GCC Countries
- South Africa
- Northern Africa
- Rest of MEA
- Middle East & Africa Market Size (US$ Mn) and Volume (Units) Analysis and Forecast, by Product Type, 2024-2032
- Double Offset Butterfly Valve
- Triple Offset Butterfly Valve
- Middle East & Africa Market Size (US$ Mn) and Volume (Units) Analysis and Forecast, by Seat Type, 2024-2032
- Soft Seat
- Metal Seat
- Middle East & Africa Market Size (US$ Mn) and Volume (Units) Analysis and Forecast, by Valve Size, 2024-2032
- Small (Up to 10 inches)
- Medium (10-25 inches)
- Large (Above 25 inches)
- Middle East & Africa Market Size (US$ Mn) and Volume (Units) Analysis and Forecast, by End-use Industry, 2024-2032
- Oil & Gas
- Chemicals & Petrochemicals
- Power Generation
- HVAC & Building Services
- Metals & Mining
- Food & Beverages
- Pharmaceutical & Healthcare
- Water & Wastewater Treatment
- Others
- Competition Landscape
- Market Share Analysis, 2024
- Market Structure
- Competition Intensity Mapping
- Competition Dashboard
- Company Profiles
- Emerson Electric Co.
- Company Overview
- Product Portfolio/Offerings
- Key Financials
- SWOT Analysis
- Company Strategy and Key Developments
- Flowserve Corporation
- AVK Holding A/S
- Alfa Laval AB
- Crane Co.
- L&T Valves Limited
- Curtiss-Wright Corporation
- NIBCO Inc.
- Valmet Oyj
- Bray International, Inc.
- KSB SE & Co. KGaA
- Georg Fischer AG (GF Piping Systems)
- Belimo Holding AG
- Parker-Hannifin Corporation
- SAMSON AG
- Emerson Electric Co.
- Appendix
- Research Methodology
- Research Assumptions
- Acronyms and Abbreviations

Loading page data
Please wait a moment


