


- Executive Summary
- Global Heart Health Supplements Market Snapshot, 2025 and 2032
- Market Opportunity Assessment, 2025 - 2032, US$ Bn
- Key Market Trends
- Future Market Projections
- Premium Market Insights
- Distribution Channel Developments and Key Market Events
- PMR Analysis and Recommendations
- Market Overview
- Market Scope and Definition
- Market Dynamics
- Drivers
- Restraints
- Opportunity
- Key Trends
- Macro-economic Factors
- Aging Population and Increasing Cardiovascular Disease Incidence
- Regulatory Policies and Quality Standards in Supplements
- COVID-19 Impact Analysis
- Forecast Factors - Relevance and Impact
- Value Added Insights
- Product Type Demand Analysis
- Regulatory Landscape
- Value Chain Analysis
- PESTLE Analysis
- Porter’s Five Force Analysis
- Global Heart Health Supplements Market Outlook
- Key Highlights
- Market Volume (Units) Projections
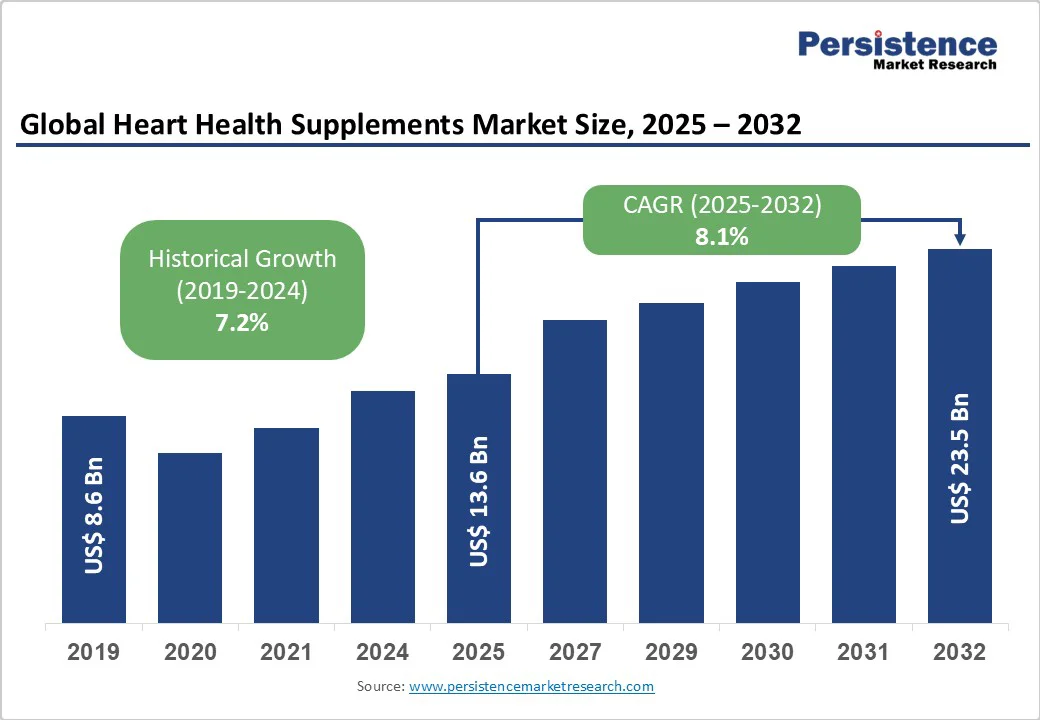
- Market Size (US$ Bn) and Y-o-Y Growth
- Absolute $ Opportunity
- Market Size (US$ Bn) and Volume (Units) Analysis and Forecast
- Historical Market Size (US$ Bn) Analysis, 2019-2024
- Market Size (US$ Bn) Analysis and Forecast, 2025 - 2032
- Global Heart Health Supplements Market Outlook: Product Type
- Introduction / Key Findings
- Historical Market Size (US$ Bn) and Volume (Units) Analysis, By Product Type, 2019 - 2024
- Market Size (US$ Bn) and Volume (Units) Analysis and Forecast, By Product Type, 2025 - 2032
- Natural Supplements
- Synthetic Supplements
- Market Attractiveness Analysis: Product Type
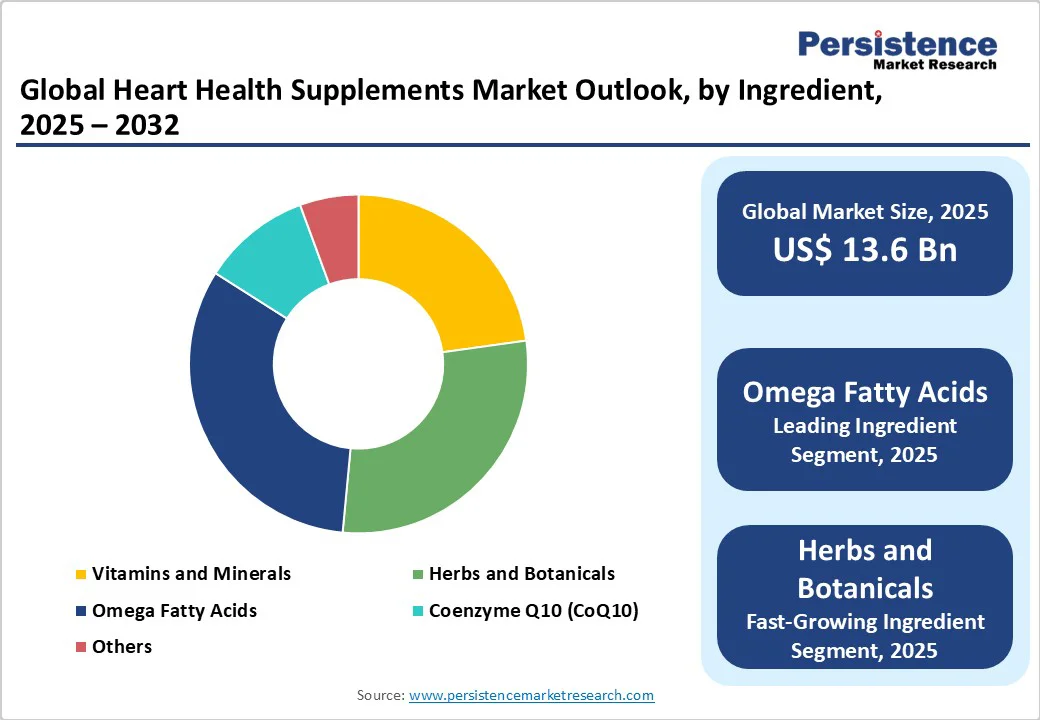
- Global Heart Health Supplements Market Outlook: Ingredient
- Introduction / Key Findings
- Historical Market Size (US$ Bn) Analysis, By Ingredient, 2019 - 2024
- Market Size (US$ Bn) Analysis and Forecast, By Ingredient, 2025 - 2032
- Vitamins and Minerals
- Herbs and Botanicals
- Omega Fatty Acids
- Coenzyme Q10 (CoQ10)
- Others
- Market Attractiveness Analysis: Ingredient
- Global Heart Health Supplements Market Outlook: Form
- Introduction / Key Findings
- Historical Market Size (US$ Bn) Analysis, By Form, 2019 - 2024
- Market Size (US$ Bn) Analysis and Forecast, By Form, 2025 - 2032
- Liquid
- Tablet
- Capsules
- Softgels
- Powder
- Others
- Market Attractiveness Analysis: Form
- Global Heart Health Supplements Market Outlook: Distribution Channel
- Introduction / Key Findings
- Historical Market Size (US$ Bn) Analysis, By Distribution Channel, 2019 - 2024
- Market Size (US$ Bn) Analysis and Forecast, By Distribution Channel, 2025 - 2032
- Offline
- Online
- Market Attractiveness Analysis: Distribution Channel
- Key Highlights
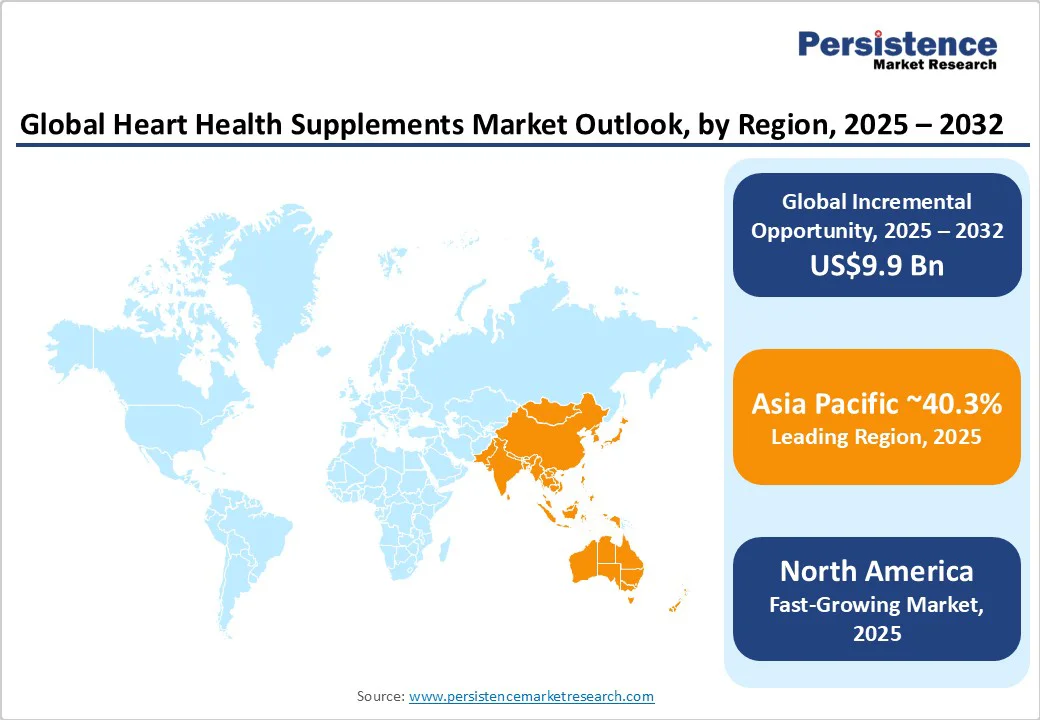
- Global Heart Health Supplements Market Outlook: Region
- Key Highlights
- Historical Market Size (US$ Bn) and Volume (Units) Analysis, By Region, 2019 - 2024
- Market Size (US$ Bn) and Volume (Units) Analysis and Forecast, By Region, 2025 - 2032
- North America
- Europe
- East Asia
- South Asia and Oceania
- Latin America
- Middle East & Africa
- Market Attractiveness Analysis: Region
- North America Heart Health Supplements Market Outlook
- Key Highlights
- Historical Market Size (US$ Bn) Analysis, By Market, 2019 - 2024
- By Country
- By Product Type
- By Ingredient
- By Form
- By Distribution Channel
- Market Size (US$ Bn) Analysis and Forecast, By Country, 2025 - 2032
- U.S.
- Canada
- Market Size (US$ Bn) and Volume (Units) Analysis and Forecast, By Product Type, 2025 - 2032
- Natural Supplements
- Synthetic Supplements
- Market Size (US$ Bn) Analysis and Forecast, By Ingredient, 2025 - 2032
- Vitamins and Minerals
- Herbs and Botanicals
- Omega Fatty Acids
- Coenzyme Q10 (CoQ10)
- Others
- Market Size (US$ Bn) Analysis and Forecast, By Form, 2025 - 2032
- Liquid
- Tablet
- Capsules
- Softgels
- Powder
- Others
- Market Size (US$ Bn) Analysis and Forecast, By Distribution Channel, 2025 - 2032
- Offline
- Online
- Market Attractiveness Analysis
- Europe Heart Health Supplements Market Outlook
- Key Highlights
- Historical Market Size (US$ Bn) Analysis, By Market, 2019 - 2024
- By Country
- By Product Type
- By Ingredient
- By Form
- By Distribution Channel
- Market Size (US$ Bn) Analysis and Forecast, By Country, 2025 - 2032
- Germany
- France
- U.K.
- Italy
- Spain
- Russia
- Türkiye
- Rest of Europe
- Market Size (US$ Bn) and Volume (Units) Analysis and Forecast, By Product Type, 2025 - 2032
- Natural Supplements
- Synthetic Supplements
- Market Size (US$ Bn) Analysis and Forecast, By Ingredient, 2025 - 2032
- Vitamins and Minerals
- Herbs and Botanicals
- Omega Fatty Acids
- Coenzyme Q10 (CoQ10)
- Others
- Market Size (US$ Bn) Analysis and Forecast, By Form, 2025 - 2032
- Liquid
- Tablet
- Capsules
- Softgels
- Powder
- Others
- Market Size (US$ Bn) Analysis and Forecast, By Distribution Channel, 2025 - 2032
- Offline
- Online
- Market Attractiveness Analysis
- East Asia Heart Health Supplements Market Outlook
- Key Highlights
- Historical Market Size (US$ Bn) Analysis, By Market, 2019 - 2024
- By Country
- By Product Type
- By Ingredient
- By Form
- By Distribution Channel
- Market Size (US$ Bn) Analysis and Forecast, By Country, 2025 - 2032
- China
- Japan
- South Korea
- Market Size (US$ Bn) and Volume (Units) Analysis and Forecast, By Product Type, 2025 - 2032
- Natural Supplements
- Synthetic Supplements
- Market Size (US$ Bn) Analysis and Forecast, By Ingredient, 2025 - 2032
- Vitamins and Minerals
- Herbs and Botanicals
- Omega Fatty Acids
- Coenzyme Q10 (CoQ10)
- Others
- Market Size (US$ Bn) Analysis and Forecast, By Form, 2025 - 2032
- Liquid
- Tablet
- Capsules
- Softgels
- Powder
- Others
- Market Size (US$ Bn) Analysis and Forecast, By Distribution Channel, 2025 - 2032
- Offline
- Online
- Market Attractiveness Analysis
- South Asia & Oceania Heart Health Supplements Market Outlook
- Key Highlights
- Historical Market Size (US$ Bn) Analysis, By Market, 2019 - 2024
- By Country
- By Product Type
- By Ingredient
- By Form
- By Distribution Channel
- Market Size (US$ Bn) Analysis and Forecast, By Country, 2025 - 2032
- India
- Southeast Asia
- ANZ
- Rest of South Asia & Oceania
- Market Size (US$ Bn) and Volume (Units) Analysis and Forecast, By Product Type, 2025 - 2032
- Natural Supplements
- Synthetic Supplements
- Market Size (US$ Bn) Analysis and Forecast, By Ingredient, 2025 - 2032
- Vitamins and Minerals
- Herbs and Botanicals
- Omega Fatty Acids
- Coenzyme Q10 (CoQ10)
- Others
- Market Size (US$ Bn) Analysis and Forecast, By Form, 2025 - 2032
- Liquid
- Tablet
- Capsules
- Softgels
- Powder
- Others
- Market Size (US$ Bn) Analysis and Forecast, By Distribution Channel, 2025 - 2032
- Offline
- Online
- Market Attractiveness Analysis
- Latin America Heart Health Supplements Market Outlook
- Key Highlights
- Historical Market Size (US$ Bn) Analysis, By Market, 2019 - 2024
- By Country
- By Product Type
- By Ingredient
- By Form
- By Distribution Channel
- Market Size (US$ Bn) Analysis and Forecast, By Country, 2025 - 2032
- Brazil
- Mexico
- Rest of Latin America
- Market Size (US$ Bn) and Volume (Units) Analysis and Forecast, By Product Type, 2025 - 2032
- Natural Supplements
- Synthetic Supplements
- Market Size (US$ Bn) Analysis and Forecast, By Ingredient, 2025 - 2032
- Vitamins and Minerals
- Herbs and Botanicals
- Omega Fatty Acids
- Coenzyme Q10 (CoQ10)
- Others
- Market Size (US$ Bn) Analysis and Forecast, By Form, 2025 - 2032
- Liquid
- Tablet
- Capsules
- Softgels
- Powder
- Others
- Market Size (US$ Bn) Analysis and Forecast, By Distribution Channel, 2025 - 2032
- Offline
- Online
- Market Attractiveness Analysis
- Middle East & Africa Heart Health Supplements Market Outlook
- Key Highlights
- Historical Market Size (US$ Bn) Analysis, By Market, 2019 - 2024
- By Country
- By Product Type
- By Ingredient
- By Form
- By Distribution Channel
- Market Size (US$ Bn) Analysis and Forecast, By Country, 2025 - 2032
- GCC Countries
- Egypt
- South Africa
- Northern Africa
- Rest of Middle East & Africa
- Market Size (US$ Bn) and Volume (Units) Analysis and Forecast, By Product Type, 2025 - 2032
- Natural Supplements
- Synthetic Supplements
- Market Size (US$ Bn) Analysis and Forecast, By Ingredient, 2025 - 2032
- Vitamins and Minerals
- Herbs and Botanicals
- Omega Fatty Acids
- Coenzyme Q10 (CoQ10)
- Others
- Market Size (US$ Bn) Analysis and Forecast, By Form, 2025 - 2032
- Liquid
- Tablet
- Capsules
- Softgels
- Powder
- Others
- Market Size (US$ Bn) Analysis and Forecast, By Distribution Channel, 2025 - 2032
- Offline
- Online
- Market Attractiveness Analysis
- Competition Landscape
- Market Share Analysis, 2024
- Market Structure
- Competition Intensity Mapping By Market
- Competition Dashboard
- Company Profiles (Details - Overview, Financials, Strategy, Recent Developments)
- Bright Lifecare Pvt Ltd (Truebasics.com)
- Overview
- Segments and Product Type
- Key Financials
- Market Developments
- Market Strategy
- NOW Health Group, Inc.
- Natural Organics, Inc.
- Amway Corp.
- DaVinci Laboratories of Vermont
- Thorne HealthTech, Inc.
- Nordic Naturals
- Nestle (Pure Encapsulations, LLC.)
- GNC Holdings, LLC
- InVite Health
- Others
- Bright Lifecare Pvt Ltd (Truebasics.com)
- Appendix
- Research Methodology
- Research Assumptions
- Acronyms and Abbreviations

Loading page data
Please wait a moment


