Gas Pressure Regulator Market Size, Share, and Growth Forecast for 2025 - 2032

Gas Pressure Regulator Market By Product type (Low Pressure (0-20 psi), Medium Pressure (20-100 psi) and High Pressure (100-1000 psi), Gas Type (Brass, Stainless Steel, Cast Iron and Plastic), End-user (Industrial Manufacturing, Oil & Gas Production, Healthcare, Water Treatment), and Regional Analysis from 2025 to 2032

ID: PMRREP18322
Calendar

November 2025

260 Pages

Author : Jitendra Deviputra

Gas Pressure Regulator Market Size and Share Analysis

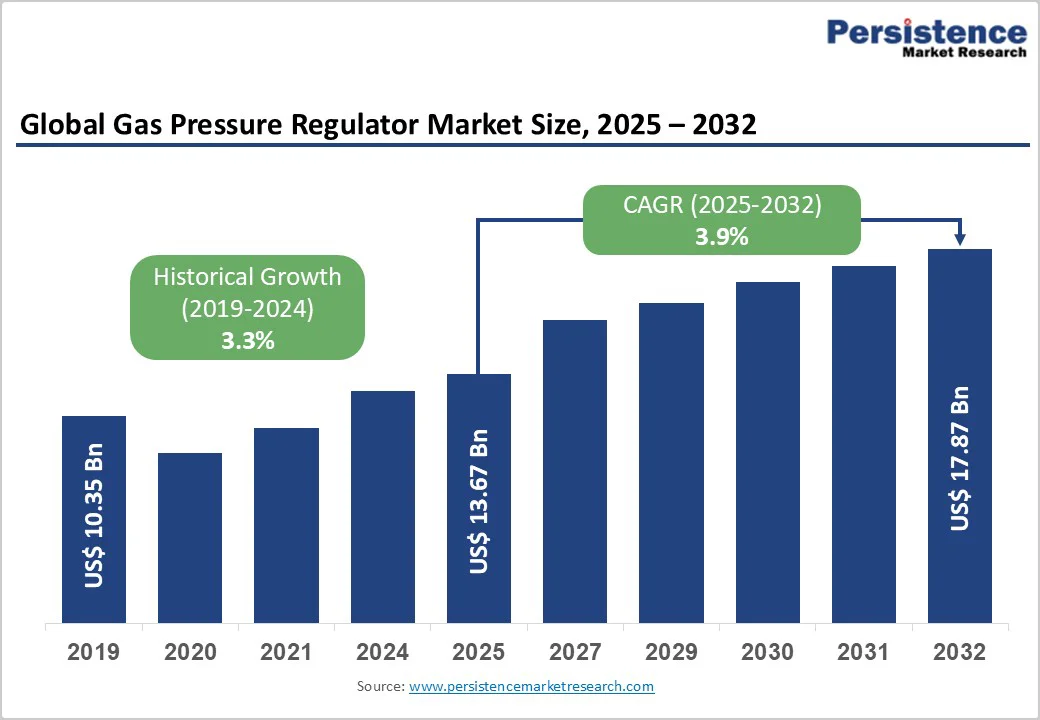
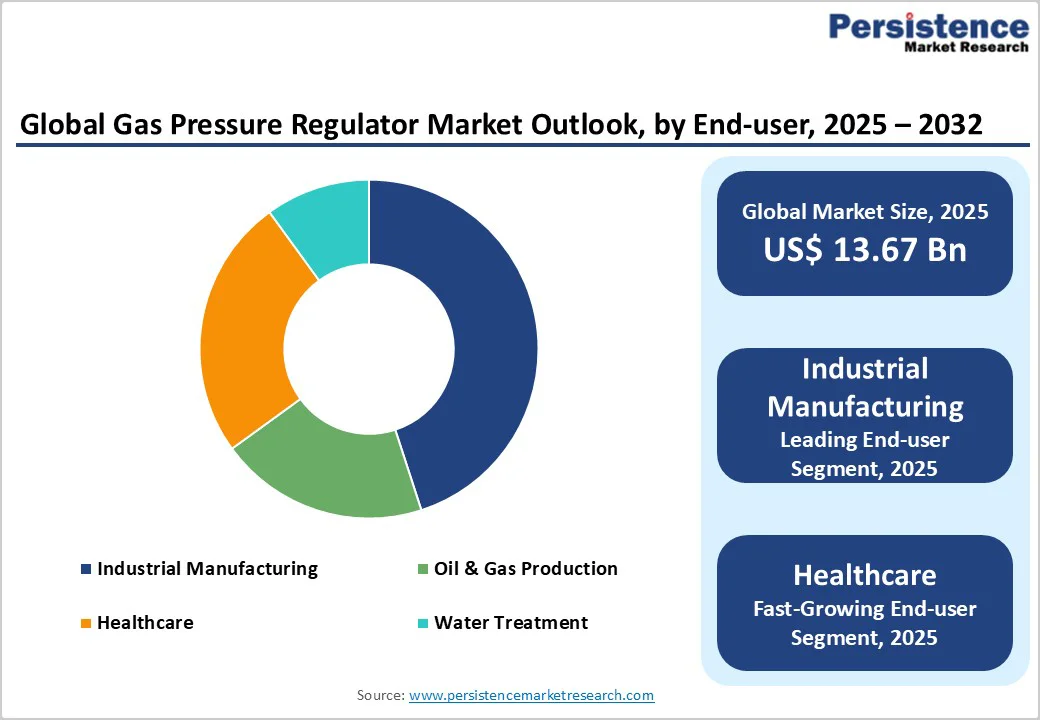
The global gas pressure regulator market size is likely to be valued at US$13.67 billion in 2025 and is projected to reach US$17.87 billion by 2032, growing at a CAGR of 3.9% between 2025 and 2032. The demand grows due to investments in new gas infrastructure, expanding industrial base in Asia-Pacific, and regulatory requirements for process safety. Key growth enablers include technological innovation, uptake across healthcare and water treatment, and transition to low-carbon energy sources.

Key Industry Highlights:

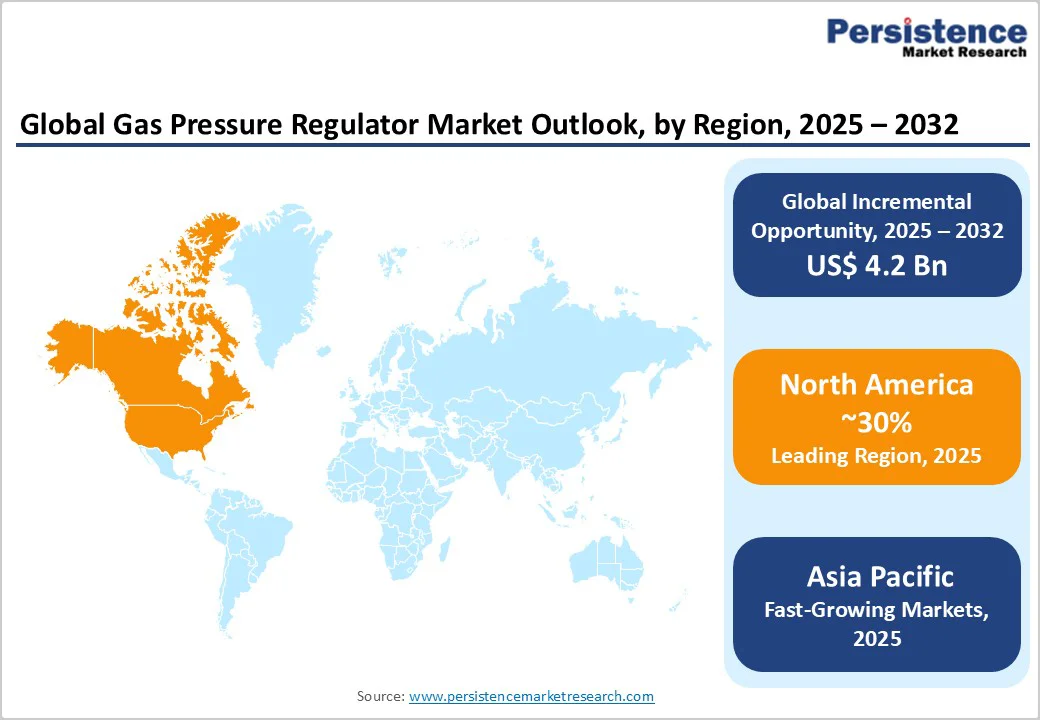
  • Leading Region: North America leads the global gas pressure regulators market with an estimated 26.3% share in 2025, supported by strong demand from industrial manufacturing, oil & gas, and healthcare sectors. The region’s emphasis on process safety, high-performance materials, and precision control systems continues to drive adoption across critical applications such as chemical processing, energy distribution, and medical gas supply.
  • Fastest-Growing Region: Asia Pacific is the fastest-growing region, accounting for over 39% of new unit installations during the forecast period. Rapid industrialization, infrastructure expansion, and growing healthcare investments in China, India, and Southeast Asia are fueling market acceleration. Government-backed initiatives promoting clean energy and hydrogen infrastructure further enhance regional growth prospects.
  • Dominant Pressure Range: Low-pressure regulators dominate the market with a 37.3% share in 2025, driven by widespread use in residential, laboratory, and low-flow industrial applications where stability and accuracy are essential. Meanwhile, the high-pressure regulator segment is projected to post the fastest growth rate due to increasing adoption in energy, aerospace, and industrial gas systems requiring superior performance and safety.
  • Material Leadership: Brass regulators hold approximately 34.1% of the global share, favoured for their cost-effectiveness and compatibility with a wide range of gases. However, the stainless-steel regulator segment is anticipated to grow at the fastest rate, propelled by rising demand for corrosion-resistant, high-purity, and hydrogen-compatible systems in semiconductor and healthcare applications.
  • End-Use Industry Leadership: The industrial manufacturing sector maintains dominance with a 45.3% market share, driven by process control applications in metalworking, chemical production, and equipment manufacturing. The healthcare sector is forecast to record the highest CAGR of 5.1%, supported by expanding medical gas infrastructure and increased demand for precision flow control in hospitals and laboratories.
  • Technological Advancement: The market is advancing through smart regulator technologies, digital pressure control systems, and hydrogen-ready designs. Key developments include Emerson’s ER5000 electronic regulator launch, Linde’s ultra-high-purity (UHP) product expansion, and the Greenfuel–Ventrex partnership in India (2023–2025), reflecting industry momentum toward automation, sustainability, and clean energy transition.
Key Insights Details
Gas Pressure Regulator Market Size (2025E) US$ 13.67 Bn
Projected Market Value (2032F) US$ 17.87 Bn
Global Market Growth Rate (CAGR 2025 to 2032) 3.9%
Historical Market Growth Rate (CAGR 2019 to 2023) 3.3%

global-gas-pressure-regulator-market-size-2025-2032

Market Dynamics

Driver - Rising Demand for Innovative Machines Drives the North America Gas Pressure Regulator Market

Global urbanization and industrialization directly increase the need for safe, reliable gas distribution. In 2025, more than 45% of total installations were attributed to new factories and urban projects, notably in China, India, and Southeast Asia. Regulatory mandates established by agencies—including the U.S. Department of Energy (DOE) and China's National Development and Reform Commission—require advanced gas pressure regulators in all new energy and utility development projects, effectively driving year-over-year growth.

Energy Transition & Clean Fuel Initiatives

International efforts to reduce emissions propel natural gas and LPG adoption, with OECD and IEA-backed policies supporting cleaner fuel infrastructure. In 2024, the EU’s “Green Gas Support Scheme” and India’s LPG expansion program contributed to greater market penetration. Approximately 53% of new residential energy connections now utilize regulated natural gas, underscoring sustained demand for pressure management solutions.

Advancements in Digital and Smart Regulator Technology

Technological progress—in AI-driven diagnostics, IoT-enabled remote monitoring, and smart sensors—has transformed reliability and responsiveness. By 2025, nearly 37% of new market entrants will have launched products equipped for digital integration and real-time leak/fault detection. Such features are crucial for compliance in hazardous environments and medical gas delivery.

Restraint - High Upfront Costs and Skilled Workforce Shortfalls

Advanced regulator systems, especially those with smart features, entail considerable initial investment and require specialized installation skills. The shortage of trained technicians and engineers in emerging markets impedes adoption, particularly in rural and small enterprise sectors, resulting in slower rate of technology penetration and higher maintenance costs.

Infrastructure Retrofitting and Regulatory Complexity

Aged pipeline infrastructure in mature markets poses retrofitting challenges, increasing project costs and complicating compliance with diverse international standards. Retrofits of legacy networks in North America and Europe can inflate regulator system costs by up to 15-20%, influencing replacement cycles and leading to delays in large municipal upgrades.

Opportunity - High-Pressure and Hydrogen-Ready Regulators

Fast-growth is expected in the high-pressure segment and for hydrogen-ready devices as new industries (green hydrogen plants, refueling stations) come online. Investments and subsidies are driving a 6.2% CAGR in these segments, which represent actionable opportunities for product differentiation and market capture.

Asia Pacific accounts for more than 39% of gas regulator installations, with rapid deployment in both urban residential and clustered industrial parks. Local governments grant incentives for LPG/CNG conversion, smart metering, and modular pressure control systems—representing scalable opportunity for manufacturers.

Healthcare and Smart Home Adoption

The healthcare segment posts a 5.1% CAGR, spurred by hospital expansions and regulatory standards for medical gas supply. Smart homes increasingly require pressure regulators integrated with home automation, driving new product launches into mainstream consumer electronics and utilities markets.

Category-wise Analysis

Product Type Insights

Low-pressure regulators dominate the market, capturing a 37.3% share in 2025. Their core role is safe home, commercial kitchen, and utility gas delivery. Large-scale adoption is supported by ongoing replacement cycles and regulatory incentives for new builds; resilience and user-friendliness ensure steady volume growth.

High-pressure regulators are the fastest growing segment, reflecting demand for industrial, energy plant, and hydrogen applications. This segment benefits from the expansion of manufacturing and chemical plants using gases under high pressure. Growth is anticipated at over 6.2% CAGR, with industry stakeholders investing in R&D to optimize regulator design for hydrogen and other specialty gases.[2][1]

Gas Type (Material) Analysis

Brass Regulators

Brass regulators are the market share leaders, accounting for 34.1% in 2025. Preferred for their strength, corrosion resistance, and broad applicability in industrial and residential systems, brass remains the standard in multi-gas supply pipelines and utility connections.

Stainless steel, as the fastest growing material segment, is driven by stringent safety and hygiene requirements in healthcare, pharmaceuticals, and chemical manufacturing. Enhanced durability and expanded compatibility push CAGR in this segment above the industry average, notably for clean-room and critical environment installations.

End-use Analysis

Industrial manufacturing represents the largest end-use category, claiming a 45.3% share in 2025. With factories and process industries depending upon controlled gas supply for operational and occupational safety, manufacturers are scaling up regulator installations for diverse production lines.

Healthcare is the fastest growing end-use segment, with a CAGR of 5.1%. The requirement for precise pressure management in oxygen delivery, anesthesia, and laboratory gases is augmented by post-pandemic infrastructure investment and regulatory updates, especially across Southeast Asia and Europe.

global-gas-pressure-regulator-market-outlook-by-end-user-2025-2032

Regional Market Insights

North America Gas Pressure Regulator Market Trends

North America is the market leader, attributed to advanced gas distribution network maturity and strict implementation of safety standards (e.g., ANSI Z21, OSHA regulations). The U.S. occupies over 21.3% of global market share, propelled by ongoing infrastructure upgrades, residential conversions to gas heating, and strong industrial output. Canada and Mexico are also experiencing growth, albeit from a smaller base, aided by cross-border regulatory harmonization and trade in gas equipment. Investment in hydrogen blending pilots and smart regulator deployment further underpin future expansion. The region’s competitive landscape is marked by highly consolidated supply chains, with major manufacturers such as Emerson and Honeywell spearheading innovation.

Europe Gas Pressure Regulator Market Trends

Europe follows North America in market size, led by Germany, France, the UK, and Spain. The region’s driving forces are government mandates on energy transition, national incentives for upgrading natural gas grids, and phasing out legacy boilers for hydrogen-ready systems. Germany’s Energiewende program and EU-wide sustainability goals stimulate demand for high-performance, eco-friendly regulators. The healthcare segment is robust, and modular designs for industrial SMEs (small and medium-sized enterprises) are gaining traction. Regulatory advances ensure strong compliance and facilitate transnational market presence, especially in high-value end markets.

Asia Pacific Gas Pressure Regulator Market Trends

Asia Pacific emerges as the fastest growing region, responsible for more than 39% of installations in 2025. China, India, Japan, and ASEAN economies benefit from rapid urbanization, aggressive government incentives for LPG/CNG conversion, and new industrial cluster developments. Growth in smart cities, infrastructure expansion, and robust water treatment investments contribute to record regulator unit installations. The competitive landscape is fragmented, with global leaders focusing on strategic partnerships and local manufacturing to address regulator customization preferences and regulatory diversity.

global-gas-pressure-regulator-market-outlook-by-region-2025-2032

Competitive Landscape

The Gas Pressure Regulator Market is moderately consolidated, with the top five player Emerson Electric, The Linde Group, Air Liquide, Cavagna Group, and Itron Inc. accounting for about 60-65% of global revenue. The remainder is split among regional specialists and niche market entrants. Leading companies maintain strong competitive positioning via product innovation, comprehensive service contracts, and investment in digital integration. Smaller and new entrants are increasing market fragmentation in selected Asia Pacific and European countries.

Recent Industry Developments:

  • In 2024, Emerson Electric, Launched TESCOM ER5000 series, featuring wireless diagnostics and remote setpoint control, targeting industrial and utility segments.
  • In 2024, Linde Group, Expanded SPECTRA product line for UHP compatibility; partnered with OEMs for dual-stage regulator rollouts in hydrogen infrastructure projects across Europe and APAC.
  • In 2024, Air Liquide, introduced smart regulators for medical and industrial use, including real-time leak detection and performed hospital network retrofits in Southeast Asia.

Companies Covered in Gas Pressure Regulator Market

  • Honeywell International
  • Air Liquide SA
  • Itron Inc.
  • Emerson Electric Co.
  • Xylem
  • Air Products and Chemicals, Inc.
  • Rotarex SA
  • ESAB
  • Watts Water Technologies, Inc.
  • Linde plc.
  • Matheson Tri-Gas, Inc.
  • Medenus Gas-Druckregeltechnik GmbH
  • Pietro Fiorentini S.p.a
  • Essex Industries, Inc.
  • Greggersen Gasetechnik GmbH
Frequently Asked Questions

The Gas Pressure Regulator market is estimated to be valued at US$ 13.67 Bn in 2025.

The key demand driver for the Gas Pressure Regulator market is the rising need for precise pressure control and safety in industrial, energy, and healthcare applications.

In 2025, the North America region will dominate the market with an exceeding 30% revenue share in the global Gas Pressure Regulator market.

Among the Pressure Range, Low Pressure (0-20 psi) hold the highest preference, capturing beyond 37.3% of the market revenue share in 2025, surpassing other products.

The key players in the Gas Pressure Regulator market are Kennametal Inc., Flow International Corporation, OMAX Corporation, CERATIZIT S.A. and GMA Garnet Pty. Ltd.

Global Gas Pressure Regulator Report Scope
Report Attribute Details
Historical Data/Actuals 2019 – 2024
Forecast Period 2025 – 2032
Market Analysis Units Value: US$ Bn, Volume: Units
Geographical Coverage
  • North America
  • Europe
  • Asia Pacific
  • Latin America
  • Middle East & Africa
Segmental Coverage
  • Pressure Range
  • Material 
  • Product Type 
  • End- user
  • Region
Competitive Analysis
  • Kennametal Inc.
  • Flow International Corporation
  • OMAX Corporation
  • CERATIZIT S.A.
  • GMA Garnet Pty. Ltd.
  • Wardjet Inc.
  • Hypertherm Inc.
  • TECHNI Waterjet
  • Jet Edge, Inc.
  • KMT Waterjet
  • ALLFI AG
  • Opta Minerals Inc.
  • Kimblad Technology AB
  • H2O Jet
  • Other Market Players
Report Highlights
  • Market Forecast and Trends
  • Competitive Intelligence & Share Analysis
  • Growth Factors and Challenges
  • Strategic Growth Initiatives
  • Pricing Analysis & Technology Roadmap
  • Future Opportunities and Revenue Pockets
  • Market Analysis Tools
Market Segmentation

By Pressure Range

  • Low Pressure (0-20 psi)
  • Medium Pressure (20-100 psi)
  • High Pressure (100-1000 psi)

By Material

  • Brass
  • Stainless Steel
  • Cast Iron
  • Plastic

By Product Type 

  • Direct-Acting Regulators
  • Pilot-Operated Regulators
  • Self-Operated Regulators
  • Pressure Relief Valves

By End-use

  • Industrial Manufacturing
  • Oil & Gas Production
  • Healthcare
  • Water Treatment

By Region

  • North America
  • Europe
  • Asia Pacific
  • Latin America
  • Middle East & Africa

Related Reports

  1. Executive Summary
    1. Global Gas Pressure Regulator Snapshot 2025 and 2032
    2. Market Opportunity Assessment, 2025-2032, US$ Bn
    3. Key Market Trends
    4. Industry Developments and Key Market Events
    5. Demand Side and Supply-Side Analysis
    6. PMR Analysis and Recommendations
  2. Market Overview
    1. Market Scope and Definitions
    2. Value Chain Analysis
    3. Macro-Economic Factors
      1. Global GDP Outlook
      2. Global Construction Industry Overview
      3. Global Oil & Gas Overview
    4. Forecast Factors – Relevance and Impact
    5. COVID-19 Impact Assessment
    6. PESTLE Analysis
    7. Porter's Five Forces Analysis
    8. Geopolitical Tensions: Market Impact
    9. Regulatory and Technology Landscape
  3. Market Dynamics
    1. Drivers
    2. Restraints
    3. Opportunities
    4. Trends
  4. Price Trend Analysis, 2019 – 2032
    1. Region-wise Price Analysis
    2. Price by Segments
    3. Price Impact Factors
  5. Global Gas Pressure Regulator Outlook: Historical (2019 – 2024) and Forecast (2025 – 2032)
    1. Key Highlights
    2. Global Gas Pressure Regulator Outlook: Product Type
      1. Introduction/Key Findings
      2. Historical Market Size (US$ Bn) and Volume (Units) Analysis by Product Type, 2019-2024
      3. Current Market Size (US$ Bn) and Volume (Units) Forecast, by Product Type, 2025-2032
        1. Low Pressure (0-20 psi)
        2. Medium Pressure (20-100 psi)
        3. High Pressure (100-1000 psi)
      4. Market Attractiveness Analysis: Product Type
    3. Global Gas Pressure Regulator Outlook: Material 
      1. Introduction/Key Findings
      2. Historical Market Size (US$ Bn) and Volume (Units) Analysis by Material, 2019-2024
      3. Current Market Size (US$ Bn) and Volume (Units) Forecast, by Material,2025-2032
        1. Brass
        2. Stainless Steel
        3. Cast Iron
        4. Plastic
      4. Market Attractiveness Analysis: Material 
    4. Global Gas Pressure Regulator Outlook: Product Type 
      1. Introduction/Key Findings
      2. Historical Market Size (US$ Bn) and Volume (Units) Analysis by Product Type , 2019-2024
      3. Current Market Size (US$ Bn) and Volume (Units) Forecast, by Product Type , 2025-2032
        1. Direct-Acting Regulators
        2. Pilot-Operated Regulators
        3. Self-Operated Regulators
        4. Pressure Relief Valves
      4. Market Attractiveness Analysis: Product Type 
    5. Global Gas Pressure Regulator Outlook: End- user
      1. Introduction/Key Findings
      2. Historical Market Size (US$ Bn) and Volume (Units) Analysis by End- user, 2019-2024
      3. Current Market Size (US$ Bn) and Volume (Units) Forecast, by End- user, 2025-2032
        1. Industrial Manufacturing
        2. Oil & Gas Production
        3. Healthcare
        4. Water Treatment
      4. Market Attractiveness Analysis: End- user
  6. Global Gas Pressure Regulator Outlook: Region
    1. Key Highlights
    2. Historical Market Size (US$ Bn) and Volume (Units) Analysis by Region, 2019-2024
    3. Current Market Size (US$ Bn) and Volume (Units) Forecast, by Region, 2025-2032
      1. North America
      2. Europe
      3. East Asia
      4. South Asia & Oceania
      5. Latin America
      6. Middle East & Africa
    4. Market Attractiveness Analysis: Region
  7. North America Gas Pressure Regulator Outlook: Historical (2019 – 2024) and Forecast (2025 – 2032)
    1. Key Highlights
    2. Pricing Analysis
    3. North America Market Size (US$ Bn) and Volume (Units) Forecast, by Country, 2025-2032
      1. U.S.
      2. Canada
    4. North America Market Size (US$ Bn) and Volume (Units) Forecast, by Product Type, 2025-2032
      1. Low Pressure (0-20 psi)
      2. Medium Pressure (20-100 psi)
      3. High Pressure (100-1000 psi)
    5. North America Market Size (US$ Bn) and Volume (Units) Forecast, by Material,2025-2032
      1. Brass
      2. Stainless Steel
      3. Cast Iron
      4. Plastic
    6. North America Market Size (US$ Bn) and Volume (Units) Forecast, by Product Type , 2025-2032
      1. Direct-Acting Regulators
      2. Pilot-Operated Regulators
      3. Self-Operated Regulators
      4. Pressure Relief Valves
    7. North America Market Size (US$ Bn) and Volume (Units) Forecast, by End- user, 2025-2032
      1. Industrial Manufacturing
      2. Oil & Gas Production
      3. Healthcare
      4. Water Treatment
  8. Europe Gas Pressure Regulator Outlook: Historical (2019 – 2024) and Forecast (2025 – 2032)
    1. Key Highlights
    2. Pricing Analysis
    3. Europe Market Size (US$ Bn) and Volume (Units) Forecast, by Country, 2025-2032
      1. Germany
      2. Italy
      3. France
      4. U.K.
      5. Spain
      6. Russia
      7. Rest of Europe
    4. Europe Market Size (US$ Bn) and Volume (Units) Forecast, by Product Type, 2025-2032
      1. Low Pressure (0-20 psi)
      2. Medium Pressure (20-100 psi)
      3. High Pressure (100-1000 psi)
    5. Europe Market Size (US$ Bn) and Volume (Units) Forecast, by Material,2025-2032
      1. Brass
      2. Stainless Steel
      3. Cast Iron
      4. Plastic
    6. Europe Market Size (US$ Bn) and Volume (Units) Forecast, by Product Type , 2025-2032
      1. Direct-Acting Regulators
      2. Pilot-Operated Regulators
      3. Self-Operated Regulators
      4. Pressure Relief Valves
    7. Europe Market Size (US$ Bn) and Volume (Units) Forecast, by End- user, 2025-2032
      1. Industrial Manufacturing
      2. Oil & Gas Production
      3. Healthcare
      4. Water Treatment
  9. East Asia Gas Pressure Regulator Outlook: Historical (2019 – 2024) and Forecast (2025 – 2032)
    1. Key Highlights
    2. Pricing Analysis
    3. East Asia Market Size (US$ Bn) and Volume (Units) Forecast, by Country, 2025-2032
      1. China
      2. Japan
      3. South Korea
    4. East Asia Market Size (US$ Bn) and Volume (Units) Forecast, by Product Type, 2025-2032
      1. Low Pressure (0-20 psi)
      2. Medium Pressure (20-100 psi)
      3. High Pressure (100-1000 psi)
    5. East Asia Market Size (US$ Bn) and Volume (Units) Forecast, by Material,2025-2032
      1. Brass
      2. Stainless Steel
      3. Cast Iron
      4. Plastic
    6. East Asia Market Size (US$ Bn) and Volume (Units) Forecast, by Product Type , 2025-2032
      1. Direct-Acting Regulators
      2. Pilot-Operated Regulators
      3. Self-Operated Regulators
      4. Pressure Relief Valves
    7. East Asia Market Size (US$ Bn) and Volume (Units) Forecast, by End- user, 2025-2032
      1. Industrial Manufacturing
      2. Oil & Gas Production
      3. Healthcare
      4. Water Treatment
  10. South Asia & Oceania Gas Pressure Regulator Outlook: Historical (2019 – 2024) and Forecast (2025 – 2032)
    1. Key Highlights
    2. Pricing Analysis
    3. South Asia & Oceania Market Size (US$ Bn) and Volume (Units) Forecast, by Country, 2025-2032
      1. India
      2. Southeast Asia
      3. ANZ
      4. Rest of SAO
    4. South Asia & Oceania Market Size (US$ Bn) and Volume (Units) Forecast, by Product Type, 2025-2032
      1. Low Pressure (0-20 psi)
      2. Medium Pressure (20-100 psi)
      3. High Pressure (100-1000 psi)
    5. South Asia & Oceania Market Size (US$ Bn) and Volume (Units) Forecast, by Material,2025-2032
      1. Brass
      2. Stainless Steel
      3. Cast Iron
      4. Plastic
    6. South Asia & Oceania Market Size (US$ Bn) and Volume (Units) Forecast, by Product Type , 2025-2032
      1. Direct-Acting Regulators
      2. Pilot-Operated Regulators
      3. Self-Operated Regulators
      4. Pressure Relief Valves
    7. South Asia & Oceania Market Size (US$ Bn) and Volume (Units) Forecast, by End- user, 2025-2032
      1. Industrial Manufacturing
      2. Oil & Gas Production
      3. Healthcare
      4. Water Treatment
  11. Latin America Gas Pressure Regulator Outlook: Historical (2019 – 2024) and Forecast (2025 – 2032)
    1. Key Highlights
    2. Pricing Analysis
    3. Latin America Market Size (US$ Bn) and Volume (Units) Forecast, by Country, 2025-2032
      1. Brazil
      2. Mexico
      3. Rest of LATAM
    4. Latin America Market Size (US$ Bn) and Volume (Units) Forecast, by Product Type, 2025-2032
      1. Low Pressure (0-20 psi)
      2. Medium Pressure (20-100 psi)
      3. High Pressure (100-1000 psi)
    5. Latin America Market Size (US$ Bn) and Volume (Units) Forecast, by Material,2025-2032
      1. Brass
      2. Stainless Steel
      3. Cast Iron
      4. Plastic
    6. Latin America Market Size (US$ Bn) and Volume (Units) Forecast, by Product Type , 2025-2032
      1. Direct-Acting Regulators
      2. Pilot-Operated Regulators
      3. Self-Operated Regulators
      4. Pressure Relief Valves
    7. Latin America Market Size (US$ Bn) and Volume (Units) Forecast, by End- user, 2025-2032
      1. Industrial Manufacturing
      2. Oil & Gas Production
      3. Healthcare
      4. Water Treatment
  12. Middle East & Africa Gas Pressure Regulator Outlook: Historical (2019 – 2024) and Forecast (2025 – 2032)
    1. Key Highlights
    2. Pricing Analysis
    3. Middle East & Africa Market Size (US$ Bn) and Volume (Units) Forecast, by Country, 2025-2032
      1. GCC Countries
      2. South Africa
      3. Northern Africa
      4. Rest of MEA
    4. Middle East & Africa Market Size (US$ Bn) and Volume (Units) Forecast, by Product Type, 2025-2032
      1. Low Pressure (0-20 psi)
      2. Medium Pressure (20-100 psi)
      3. High Pressure (100-1000 psi)
    5. Middle East & Africa Market Size (US$ Bn) and Volume (Units) Forecast, by Material,2025-2032
      1. Brass
      2. Stainless Steel
      3. Cast Iron
      4. Plastic
    6. Middle East & Africa Market Size (US$ Bn) and Volume (Units) Forecast, by Product Type , 2025-2032
      1. Direct-Acting Regulators
      2. Pilot-Operated Regulators
      3. Self-Operated Regulators
      4. Pressure Relief Valves
    7. Middle East & Africa Market Size (US$ Bn) and Volume (Units) Forecast, by End- user, 2025-2032
      1. Industrial Manufacturing
      2. Oil & Gas Production
      3. Healthcare
      4. Water Treatment
  13. Competition Landscape
    1. Market Share Analysis, 2024
    2. Market Structure
      1. Competition Intensity Mapping
      2. Competition Dashboard
    3. Company Profiles
      1. Honeywell International
        1. Company Overview
        2. Product Portfolio/Offerings
        3. Key Financials
        4. SWOT Analysis
        5. Company Strategy and Key Developments
      2. Air Liquide SA
      3. Itron Inc.
      4. Emerson Electric Co.
      5. Xylem
      6. Air Products and Chemicals, Inc.
      7. Rotarex SA
      8. ESAB
      9. Watts Water Technologies, Inc.
      10. Linde plc.
      11. Matheson Tri-Gas, Inc.
      12. Medenus Gas-Druckregeltechnik GmbH
  14. Appendix
    1. Research Methodology
    2. Research Assumptions
    3. Acronyms and Abbreviations


Research Methodology Framework for Market Research Excellence

At Persistence Market Research, we implement a comprehensive, validated, and multi-dimensional approachto market analysis that delivers actionable insights across complex market landscapes. Our methodology combines the analytical rigor of leading consulting firms with innovative research techniques, ensuring robust market assessments that guide strategic decision-making with confidence.

Core Research Philosophy

Our methodology is built on four foundational pillars:

Research Philosophy Image

At Persistence Market Research, our methodology is designed to transcend conventional market studies by combining analytical rigor, multi-source validation, and future-focused insights.

We integrate advanced research frameworks, robust data collection strategies, cutting-edge analytics, and innovative technologies to deliver a 360-degree view of complex markets.

We integrate advanced research frameworks, robust data collection strategies, cutting-edge analytics, and innovative technologies to deliver a 360-degree view of complex markets.

Each stage spanning from strategic scoping and hypothesis-building to competitive intelligence, quality validation, and actionable recommendations is engineered to provide clients with unmatched clarity, precision, and confidence in decision-making.

By embedding innovation and technology at the core, our approach ensures that insights are not only comprehensive but also predictive, empowering businesses to seize opportunities, mitigate risks, and achieve sustainable growth

Research Philosophy Image

Capturing Key Information and Events

During this phase, key research objectives focus on essential information and data points for assessing the market, including:

Research Philosophy Image

TAM-SAM-SOM Framework Implementation

We employ both top-down and bottom-up approaches to ensure accurate market sizing.

Top-Down Market SizingBottom-Up Market Sizing
Universe Definition: Total global/regional market identificationUnit Economics: Average transaction values, purchase frequencies, customer lifecycle
Segmentation Filters: Geographic, demographic, and behavioral constraintsCustomer Segmentation: Detailed buyer persona development and sizing
Market Share Analysis: Competitive landscape assessment and share allocationPenetration Analysis: Market penetration rates by segment and geography
Growth Rate Application: Historical trends and forward-looking growth assumptionsScaling Methodology: Extrapolation techniques with confidence intervals

Validation & Cross-Verification

  • Triangulation: Comparing top-down and bottom-up results for consistency
  • Sensitivity Analysis: Testing key assumptions and parameter variations
  • Peer Benchmarking: Comparison with analogous markets and industry benchmarks
  • Expert Review: External validation through industry specialist consultation

Research Philosophy Image

Forecasting & Projection Modeling

Our proprietary forecasting models incorporate multiple variables and scenarios.

Forecasting Components

  • Historical Trend Analysis: 10-year historical growth patterns and cyclical variations
  • Driver-Based Modeling: Economic indicators, demographic shifts, technology adoption
  • Scenario Planning: Base case, optimistic, and conservative projections
  • Monte Carlo Simulations: Probability-weighted outcomes and risk assessments

Model Validation

  • Back-Testing: Historical accuracy assessment over 3–5-year periods
  • Cross-Validation: Multiple modeling approaches for result comparison
  • External Benchmarking: Comparison with established market forecasts
  • Continuous Calibration: Quarterly model updates based on new data

Comprehensive Data Collection Strategy

Our secondary research phase establishes a robust knowledge base utilizing diverse, credible sources.

Secondary Data Sourcess

  • Industry Publications & Reports
  • Government & Regulatory Data
  • Financial Intelligence (filings & reports)
  • Academic Research & Digital Intelligence

Quality Assurance Protocol

  • Source credibility assessment and publication date validation
  • Data consistency checks across multiple sources
  • Bias identification and neutralization techniques
  • Information gap tracking for primary research prioritization

Research Philosophy Image

Primary Research Excellence

Our primary research methodology employs best-in-class techniques to capture unique market insights.

Quantitative Research Methods

  • Large-Scale Surveys: Statistically representative samples with 95% confidence intervals
  • Survey Methodology: Multi-channel deployment (online, telephone, in-person)
  • Question Architecture and Response Optimization

Qualitative Research Methods

  • Executive Interviews
  • Focus Groups
  • Expert Consultations

Quality Assurance & Validation Framework

Multi-Stage Validation Process

  • Source Verification and Consistency Testing
  • Outlier Detection and Bias Assessment
  • Peer Review Process and External Validation
  • Sensitivity Analysis and Confidence Intervals

Research Philosophy Image

Methodology Validation & Credibility

Our research methodology has been extensively validated through:

  • Academic Partnerships: Collaborations with top-tier business schools and research institutions
  • Client Success Stories: Documented case studies demonstrating research impact and ROI
  • Continuous Benchmarking: Performance comparison with leading global research firms

This comprehensive methodology framework positions Persistence Market Research at the forefront of market intelligence, combining the analytical sophistication of top-tier consulting firms with innovative research techniques. Our approach ensures that every market assessment delivers precise, actionable, and strategically valuable insights that drive business success in competitive market environments.

Ready to unlock your market potential? Contact our research experts to discuss how our validated methodology can transform your strategic decision-making with data-driven market intelligence.

Copyright © 2026 Persistence Market Research. All Rights Reserved

Connect With Us -