


- Executive Summary
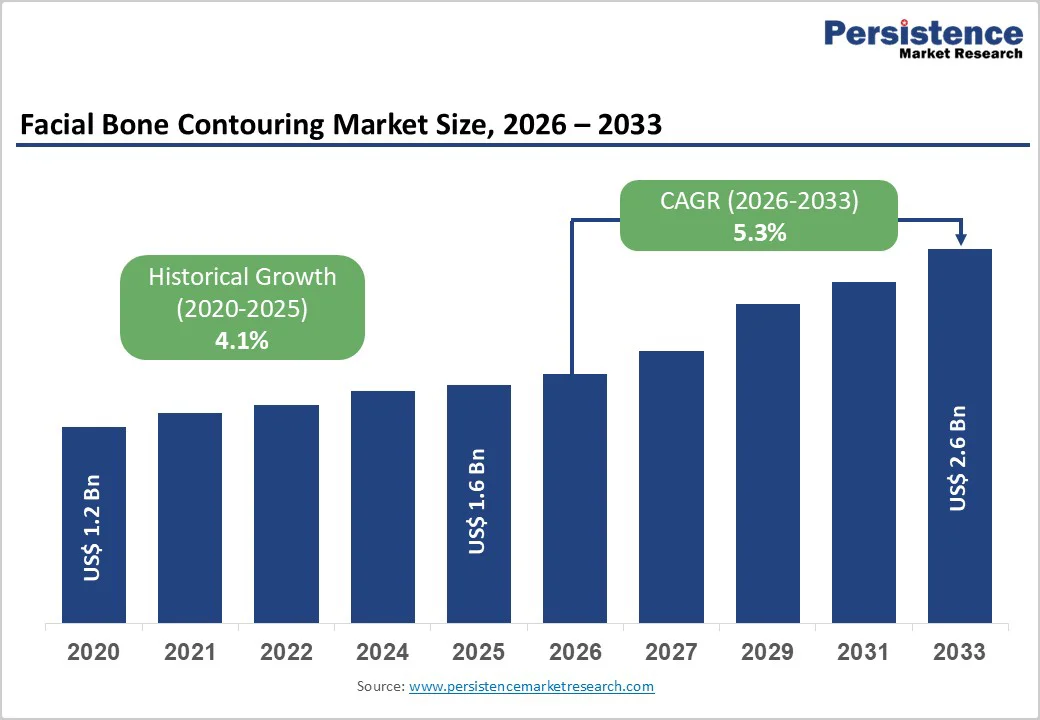
- Global Facial Bone Contouring Market Snapshot, 2026 and 2033
- Market Opportunity Assessment, 2026 - 2033, US$ Bn
- Key Market Trends
- Future Market Projections
- Premium Market Insights
- Industry Developments and Key Market Events
- PMR Analysis and Recommendations
- Market Overview
- Market Scope and Definition
- Market Dynamics
- Drivers
- Restraints
- Opportunity
- Key Trends
- Macro-Economic Factors
- Global Sectorial Outlook
- Global GDP Growth Outlook
- COVID-19 Impact Analysis
- Forecast Factors - Relevance and Impact
- Value Added Insights
- Product Adoption Analysis
- Recent Product Launches
- Regulatory Landscape
- Value Chain Analysis
- Key Deals and Mergers
- PESTLE Analysis
- Porter’s Five Force Analysis
- Global Facial Bone Contouring Market Outlook:
- Key Highlights
- Market Size (US$ Bn) and Y-o-Y Growth
- Absolute $ Opportunity
- Market Size (US$ Bn) Analysis and Forecast
- Historical Market Size (US$ Bn) Analysis, 2020-2025
- Market Size (US$ Bn) Analysis and Forecast, 2026-2033
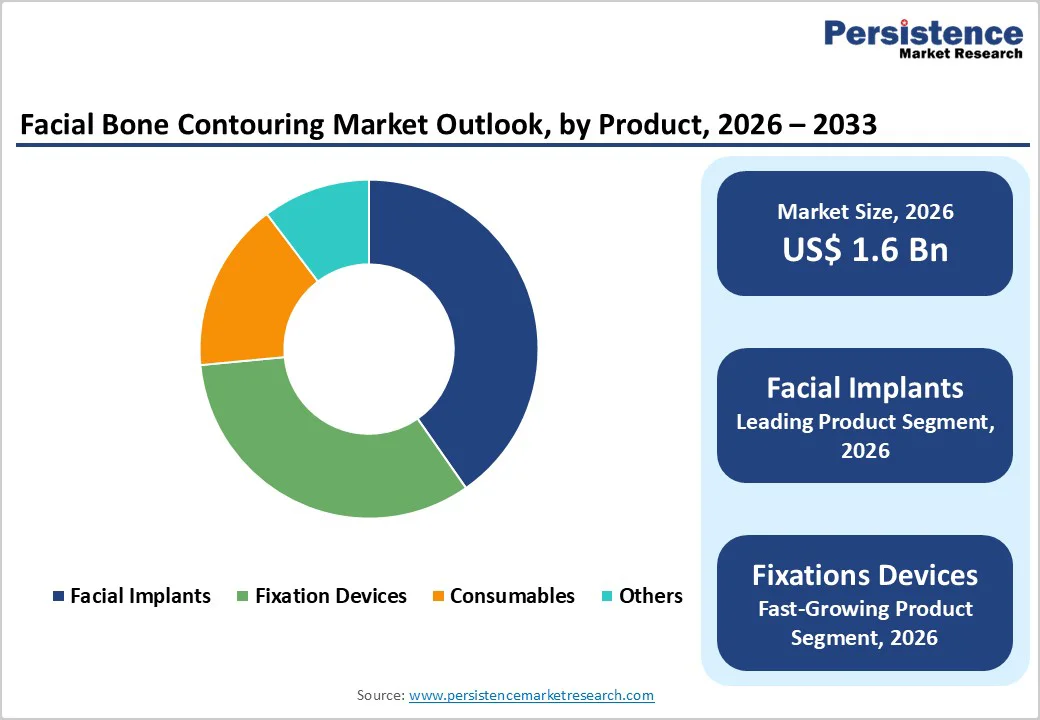
- Global Facial Bone Contouring Market Outlook: Product
- Introduction / Key Findings
- Historical Market Size (US$ Bn) Analysis, By Product, 2020 - 2025
- Market Size (US$ Bn) Analysis and Forecast, By Product, 2026 - 2033
- Facial Implants
- Fixation Devices
- Consumables
- Others
- Market Attractiveness Analysis: By Product
- Global Facial Bone Contouring Market Outlook: Procedure
- Introduction / Key Findings
- Historical Market Size (US$ Bn) Analysis, By Procedure, 2020 - 2025
- Market Size (US$ Bn) Analysis and Forecast, By Procedure, 2026 - 2033
- V Line Surgery
- Angle Reduction Surgery
- Cheek Bone Reduction Surgery
- Cheek Fat Removal
- Chin Narrowing Surgery
- Others
- Market Attractiveness Analysis: Procedure
- Global Facial Bone Contouring Market Outlook: End User
- Introduction / Key Findings
- Historical Market Size (US$ Bn) Analysis, By End User, 2020 - 2025
- Market Size (US$ Bn) Analysis and Forecast, By End User, 2026 - 2033
- Hospitals
- Aesthetic Clinics
- Ambulatory Surgery Centers
- Market Attractiveness Analysis: End User
- Key Highlights
- Global Facial Bone Contouring Market Outlook: Region
- Key Highlights
- Historical Market Size (US$ Bn) Analysis, By Region, 2020 - 2025
- Market Size (US$ Bn) Analysis and Forecast, By Region, 2026 - 2033
- North America
- Europe
- East Asia
- South Asia and Oceania
- Latin America
- Middle East & Africa
- Market Attractiveness Analysis: Region
- North America Facial Bone Contouring Market Outlook:
- Key Highlights
- Historical Market Size (US$ Bn) Analysis, By Market, 2020 - 2025
- By Country
- By Product
- By Procedure
- By End User
- Market Size (US$ Bn) Analysis and Forecast, By Country, 2026 - 2033
- U.S.
- Canada
- Market Size (US$ Bn) Analysis and Forecast, By Product, 2026 - 2033
- Facial Implants
- Fixation Devices
- Consumables
- Others
- Market Size (US$ Bn) Analysis and Forecast, By Procedure, 2026 - 2033
- V Line Surgery
- Angle Reduction Surgery
- Cheek Bone Reduction Surgery
- Cheek Fat Removal
- Chin Narrowing Surgery
- Others
- Market Size (US$ Bn) Analysis and Forecast, By End User, 2026 - 2033
- Hospitals
- Aesthetic Clinics
- Ambulatory Surgery Centers
- Market Attractiveness Analysis
- Europe Facial Bone Contouring Market Outlook:
- Key Highlights
- Historical Market Size (US$ Bn) Analysis, By Market, 2020 - 2025
- By Country
- By Product
- By Procedure
- By End User
- Market Size (US$ Bn) Analysis and Forecast, By Country, 2026 - 2033
- Germany
- France
- U.K.
- Italy
- Spain
- Russia
- Rest of Europe
- Market Size (US$ Bn) Analysis and Forecast, By Product, 2026 - 2033
- Facial Implants
- Fixation Devices
- Consumables
- Others
- Market Size (US$ Bn) Analysis and Forecast, By Procedure, 2026 - 2033
- V Line Surgery
- Angle Reduction Surgery
- Cheek Bone Reduction Surgery
- Cheek Fat Removal
- Chin Narrowing Surgery
- Others
- Market Size (US$ Bn) Analysis and Forecast, By End User, 2026 - 2033
- Hospitals
- Aesthetic Clinics
- Ambulatory Surgery Centers
- Market Attractiveness Analysis
- East Asia Facial Bone Contouring Market Outlook:
- Key Highlights
- Historical Market Size (US$ Bn) Analysis, By Market, 2020 - 2025
- By Country
- By Product
- By Procedure
- By End User
- Market Size (US$ Bn) Analysis and Forecast, By Country, 2026 - 2033
- China
- Japan
- South Korea
- Market Size (US$ Bn) Analysis and Forecast, By Product, 2026 - 2033
- Facial Implants
- Fixation Devices
- Consumables
- Others
- Market Size (US$ Bn) Analysis and Forecast, By Procedure, 2026 - 2033
- V Line Surgery
- Angle Reduction Surgery
- Cheek Bone Reduction Surgery
- Cheek Fat Removal
- Chin Narrowing Surgery
- Others
- Market Size (US$ Bn) Analysis and Forecast, By End User, 2026 - 2033
- Hospitals
- Specialty Clinics
- Ambulatory Surgery Centers
- Market Attractiveness Analysis
- South Asia & Oceania Facial Bone Contouring Market Outlook:
- Key Highlights
- Historical Market Size (US$ Bn) Analysis, By Market, 2020 - 2025
- By Country
- By Product
- By Procedure
- By End User
- Market Size (US$ Bn) Analysis and Forecast, By Country, 2026 - 2033
- India
- Southeast Asia
- ANZ
- Rest of South Asia & Oceania
- Market Size (US$ Bn) Analysis and Forecast, By Product, 2026 - 2033
- Facial Implants
- Fixation Devices
- Consumables
- Others
- Market Size (US$ Bn) Analysis and Forecast, By Procedure, 2026 - 2033
- V Line Surgery
- Angle Reduction Surgery
- Cheek Bone Reduction Surgery
- Cheek Fat Removal
- Chin Narrowing Surgery
- Others
- Market Size (US$ Bn) Analysis and Forecast, By End User, 2026 - 2033
- Hospitals
- Specialty Clinics
- Ambulatory Surgery Centers
- Market Attractiveness Analysis
- Latin America Facial Bone Contouring Market Outlook:
- Key Highlights
- Historical Market Size (US$ Bn) Analysis, By Market, 2020 - 2025
- By Country
- By Product
- By Procedure
- By End User
- Market Size (US$ Bn) Analysis and Forecast, By Country, 2026 - 2033
- Brazil
- Mexico
- Rest of Latin America
- Market Size (US$ Bn) Analysis and Forecast, By Product, 2026 - 2033
- Facial Implants
- Fixation Devices
- Consumables
- Others
- Market Size (US$ Bn) Analysis and Forecast, By Procedure, 2026 - 2033
- V Line Surgery
- Angle Reduction Surgery
- Cheek Bone Reduction Surgery
- Cheek Fat Removal
- Chin Narrowing Surgery
- Others
- Market Size (US$ Bn) Analysis and Forecast, By End User, 2026 - 2033
- Hospitals
- Specialty Clinics
- Ambulatory Surgery Centers
- Market Attractiveness Analysis
- Middle East & Africa Facial Bone Contouring Market Outlook:
- Key Highlights
- Historical Market Size (US$ Bn) Analysis, By Market, 2020 - 2025
- By Country
- By Product
- By Procedure
- By End User
- Market Size (US$ Bn) Analysis and Forecast, By Country, 2026 - 2033
- GCC Countries
- Egypt
- South Africa
- Northern Africa
- Rest of Middle East & Africa
- Market Size (US$ Bn) Analysis and Forecast, By Product, 2026 - 2033
- Facial Implants
- Fixation Devices
- Consumables
- Others
- Market Size (US$ Bn) Analysis and Forecast, By Procedure, 2026 - 2033
- V Line Surgery
- Angle Reduction Surgery
- Cheek Bone Reduction Surgery
- Cheek Fat Removal
- Chin Narrowing Surgery
- Others
- Market Size (US$ Bn) Analysis and Forecast, By End User, 2026 - 2033
- Hospitals
- Specialty Clinics
- Ambulatory Surgery Centers
- Market Attractiveness Analysis
- Competition Landscape
- Market Structure
- Competition Intensity Mapping By Market
- Competition Dashboard
- Company Profiles (Details - Overview, Recent Developments)
- Stryker
- Overview
- Segments and Product & End User
- Key Financials
- Market Developments
- Market Strategy
- Johnson & Johnson
- Zimmer Biomet
- Acumed LLC
- Medtronic
- Smith + Nephew
- Wright Medical Group N.V
- NuVasive Inc
- Baxter International Inc
- KLS Martin Group
- CADskills
- Others
- Stryker
- Market Structure
- Appendix
- Research Methodology
- Research Assumptions
- Acronyms and Abbreviations

Loading page data
Please wait a moment


