


- Executive Summary
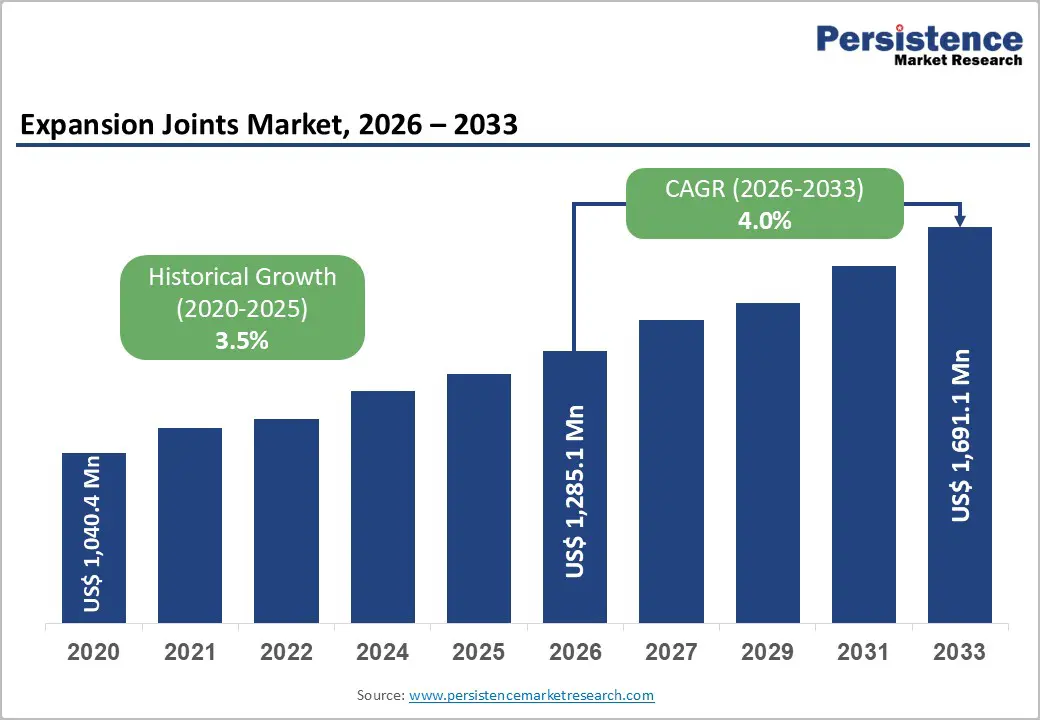
- Global Expansion Joints Market Snapshot 2026 and 2033
- Market Opportunity Assessment, 2026-2033, US$ Mn
- Key Market Trends
- Industry Developments and Key Market Events
- Demand Side and Supply-Side Analysis
- PMR Analysis and Recommendations
- Market Overview
- Market Scope and Definitions
- Value Chain Analysis
- Macro-Economic Factors
- Global GDP Outlook
- Global Power & Energy Industry Overview
- Global Oil & Gas Industry Overview
- Forecast Factors - Relevance and Impact
- COVID-19 Impact Assessment
- PESTLE Analysis
- Porter's Five Forces Analysis
- Geopolitical Tensions: Market Impact
- Regulatory and Technology Landscape
- Market Dynamics
- Drivers
- Restraints
- Opportunities
- Trends
- Price Trend Analysis, 2020 - 2033
- Region-wise Price Analysis
- Price by Segments
- Price Impact Factors
- Global Expansion Joints Market Outlook: Historical (2020 - 2025) and Forecast (2026 - 2033)
- Key Highlights
- Global Expansion Joints Market Outlook: Material Type
- Introduction/Key Findings
- Historical Market Size (US$ Mn) and Volume (Units) Analysis by Material Type, 2020-2025
- Current Market Size (US$ Mn) and Volume (Units) Forecast, by Material Type, 2026-2033
- Metallic
- Single Expansion Joints
- Hinged Expansion Joints
- Gimbal Expansion Joints
- Universal Expansion Joints
- Pressure-Balanced (Elbow & In-line)
- Toroidal Expansion Joints
- Misc.
- Fabric
- Standard Fabric Expansion Joints
- Multi-Layer Fabric Expansion Joints
- Misc.
- Rubber
- Spool-Type Rubber Expansion Joints
- Arch-Type Rubber Expansion Joints
- Misc.
- Misc.
- Metallic
- Market Attractiveness Analysis: Material Type
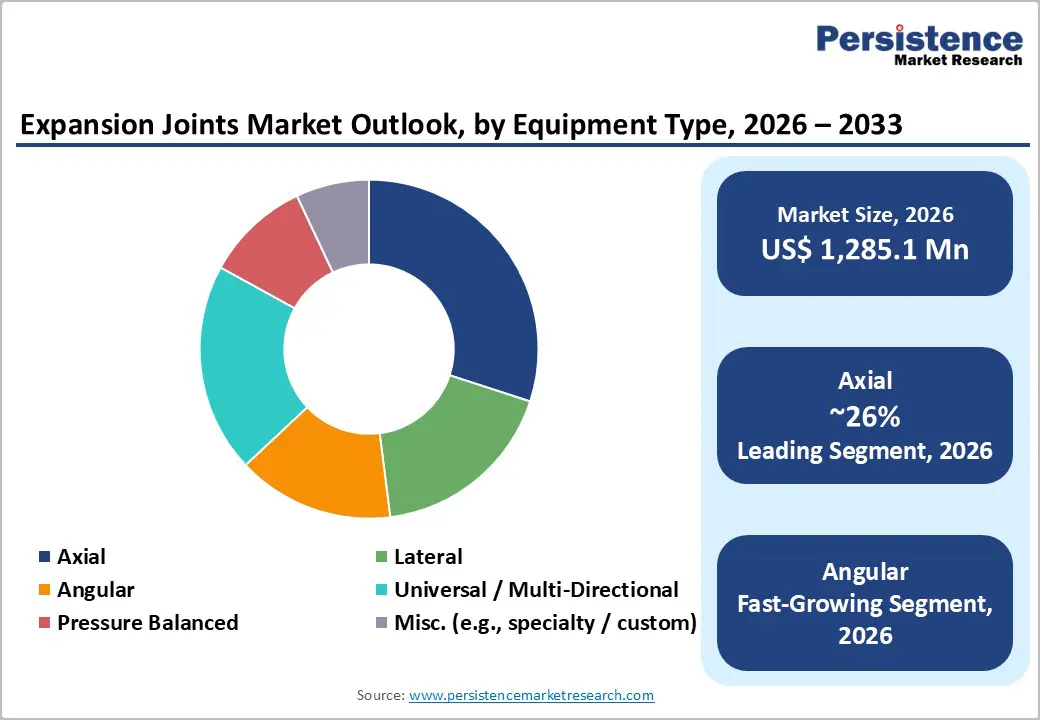
- Global Expansion Joints Market Outlook: Equipment Type
- Introduction/Key Findings
- Historical Market Size (US$ Mn) and Volume (Units) Analysis by Equipment Type, 2020-2025
- Current Market Size (US$ Mn) and Volume (Units) Forecast, by Equipment Type, 2026-2033
- Axial
- Lateral
- Angular
- Universal / Multi-Directional
- Pressure Balanced
- Misc.
- Market Attractiveness Analysis: Equipment Type
- Global Expansion Joints Market Outlook: Application
- Introduction/Key Findings
- Historical Market Size (US$ Mn) and Volume (Units) Analysis by Application, 2020-2025
- Current Market Size (US$ Mn) and Volume (Units) Forecast, by Application, 2026-2033
- Power & Energy
- Oil & Gas
- Chemical & Petrochemical
- Water & Wastewater
- HVAC & Building Services
- Pulp & Paper / Steel & Metals
- Market Attractiveness Analysis: Application
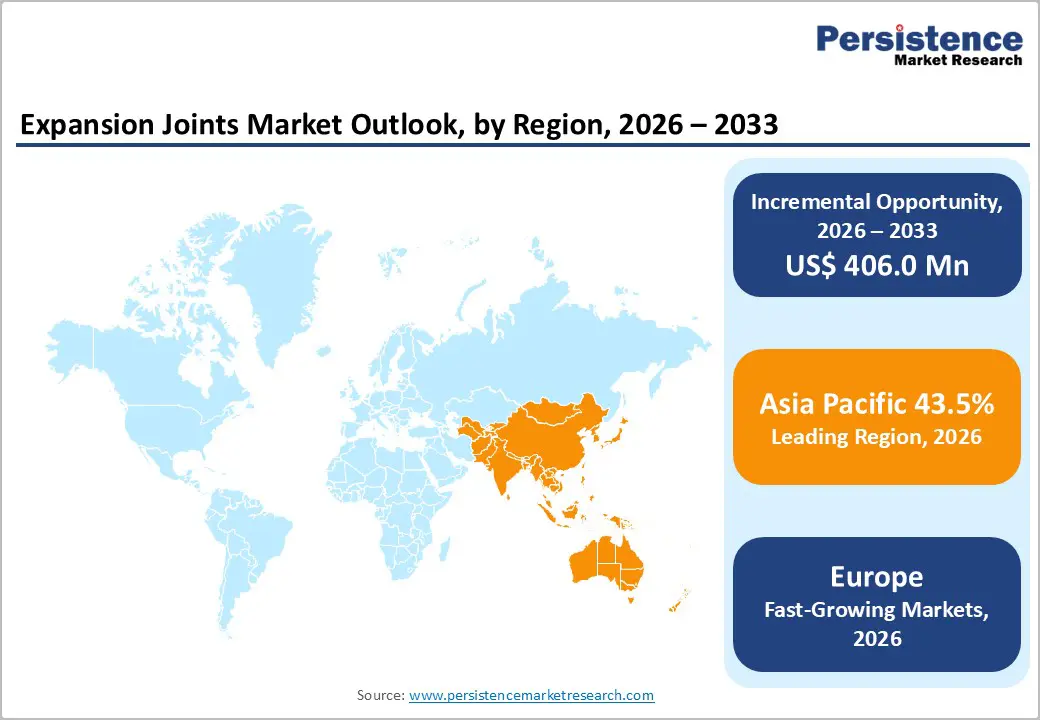
- Global Expansion Joints Market Outlook: Region
- Key Highlights
- Historical Market Size (US$ Mn) and Volume (Units) Analysis by Region, 2020-2025
- Current Market Size (US$ Mn) and Volume (Units) Forecast, by Region, 2026-2033
- North America
- Europe
- East Asia
- South Asia & Oceania
- Latin America
- Middle East & Africa
- Market Attractiveness Analysis: Region
- North America Expansion Joints Market Outlook: Historical (2020 - 2025) and Forecast (2026 - 2033)
- Key Highlights
- Pricing Analysis
- North America Market Size (US$ Mn) and Volume (Units) Forecast, by Country, 2026-2033
- U.S.
- Canada
- North America Market Size (US$ Mn) and Volume (Units) Forecast, by Material Type, 2026-2033
- Metallic
- Single Expansion Joints
- Hinged Expansion Joints
- Gimbal Expansion Joints
- Universal Expansion Joints
- Pressure-Balanced (Elbow & In-line)
- Toroidal Expansion Joints
- Misc.
- Fabric
- Standard Fabric Expansion Joints
- Multi-Layer Fabric Expansion Joints
- Misc.
- Rubber
- Spool-Type Rubber Expansion Joints
- Arch-Type Rubber Expansion Joints
- Misc.
- Misc.
- Metallic
- North America Market Size (US$ Mn) and Volume (Units) Forecast, by Equipment Type, 2026-2033
- Axial
- Lateral
- Angular
- Universal / Multi-Directional
- Pressure Balanced
- Misc.
- North America Market Size (US$ Mn) and Volume (Units) Forecast, by Application, 2026-2033
- Power & Energy
- Oil & Gas
- Chemical & Petrochemical
- Water & Wastewater
- HVAC & Building Services
- Pulp & Paper / Steel & Metals
- Europe Expansion Joints Market Outlook: Historical (2020 - 2025) and Forecast (2026 - 2033)
- Key Highlights
- Pricing Analysis
- Europe Market Size (US$ Mn) and Volume (Units) Forecast, by Country, 2026-2033
- Germany
- Italy
- France
- U.K.
- Spain
- Russia
- Rest of Europe
- Europe Market Size (US$ Mn) and Volume (Units) Forecast, by Material Type, 2026-2033
- Metallic
- Single Expansion Joints
- Hinged Expansion Joints
- Gimbal Expansion Joints
- Universal Expansion Joints
- Pressure-Balanced (Elbow & In-line)
- Toroidal Expansion Joints
- Misc.
- Fabric
- Standard Fabric Expansion Joints
- Multi-Layer Fabric Expansion Joints
- Misc.
- Rubber
- Spool-Type Rubber Expansion Joints
- Arch-Type Rubber Expansion Joints
- Misc.
- Misc.
- Metallic
- Europe Market Size (US$ Mn) and Volume (Units) Forecast, by Equipment Type, 2026-2033
- Axial
- Lateral
- Angular
- Universal / Multi-Directional
- Pressure Balanced
- Misc.
- Europe Market Size (US$ Mn) and Volume (Units) Forecast, by Application, 2026-2033
- Power & Energy
- Oil & Gas
- Chemical & Petrochemical
- Water & Wastewater
- HVAC & Building Services
- Pulp & Paper / Steel & Metals
- East Asia Expansion Joints Market Outlook: Historical (2020 - 2025) and Forecast (2026 - 2033)
- Key Highlights
- Pricing Analysis
- East Asia Market Size (US$ Mn) and Volume (Units) Forecast, by Country, 2026-2033
- China
- Japan
- South Korea
- East Asia Market Size (US$ Mn) and Volume (Units) Forecast, by Material Type, 2026-2033
- Metallic
- Single Expansion Joints
- Hinged Expansion Joints
- Gimbal Expansion Joints
- Universal Expansion Joints
- Pressure-Balanced (Elbow & In-line)
- Toroidal Expansion Joints
- Misc.
- Fabric
- Standard Fabric Expansion Joints
- Multi-Layer Fabric Expansion Joints
- Misc.
- Rubber
- Spool-Type Rubber Expansion Joints
- Arch-Type Rubber Expansion Joints
- Misc.
- Misc.
- Metallic
- East Asia Market Size (US$ Mn) and Volume (Units) Forecast, by Equipment Type, 2026-2033
- Axial
- Lateral
- Angular
- Universal / Multi-Directional
- Pressure Balanced
- Misc.
- East Asia Market Size (US$ Mn) and Volume (Units) Forecast, by Application, 2026-2033
- Power & Energy
- Oil & Gas
- Chemical & Petrochemical
- Water & Wastewater
- HVAC & Building Services
- Pulp & Paper / Steel & Metals
- South Asia & Oceania Expansion Joints Market Outlook: Historical (2020 - 2025) and Forecast (2026 - 2033)
- Key Highlights
- Pricing Analysis
- South Asia & Oceania Market Size (US$ Mn) and Volume (Units) Forecast, by Country, 2026-2033
- India
- Southeast Asia
- ANZ
- Rest of SAO
- South Asia & Oceania Market Size (US$ Mn) and Volume (Units) Forecast, by Material Type, 2026-2033
- Metallic
- Single Expansion Joints
- Hinged Expansion Joints
- Gimbal Expansion Joints
- Universal Expansion Joints
- Pressure-Balanced (Elbow & In-line)
- Toroidal Expansion Joints
- Misc.
- Fabric
- Standard Fabric Expansion Joints
- Multi-Layer Fabric Expansion Joints
- Misc.
- Rubber
- Spool-Type Rubber Expansion Joints
- Arch-Type Rubber Expansion Joints
- Misc.
- Misc.
- Metallic
- South Asia & Oceania Market Size (US$ Mn) and Volume (Units) Forecast, by Equipment Type, 2026-2033
- Axial
- Lateral
- Angular
- Universal / Multi-Directional
- Pressure Balanced
- Misc.
- South Asia & Oceania Market Size (US$ Mn) and Volume (Units) Forecast, by Application, 2026-2033
- Power & Energy
- Oil & Gas
- Chemical & Petrochemical
- Water & Wastewater
- HVAC & Building Services
- Pulp & Paper / Steel & Metals
- Latin America Expansion Joints Market Outlook: Historical (2020 - 2025) and Forecast (2026 - 2033)
- Key Highlights
- Pricing Analysis
- Latin America Market Size (US$ Mn) and Volume (Units) Forecast, by Country, 2026-2033
- Brazil
- Mexico
- Rest of LATAM
- Latin America Market Size (US$ Mn) and Volume (Units) Forecast, by Material Type, 2026-2033
- Metallic
- Single Expansion Joints
- Hinged Expansion Joints
- Gimbal Expansion Joints
- Universal Expansion Joints
- Pressure-Balanced (Elbow & In-line)
- Toroidal Expansion Joints
- Misc.
- Fabric
- Standard Fabric Expansion Joints
- Multi-Layer Fabric Expansion Joints
- Misc.
- Rubber
- Spool-Type Rubber Expansion Joints
- Arch-Type Rubber Expansion Joints
- Misc.
- Misc.
- Metallic
- Latin America Market Size (US$ Mn) and Volume (Units) Forecast, by Equipment Type, 2026-2033
- Axial
- Lateral
- Angular
- Universal / Multi-Directional
- Pressure Balanced
- Misc.
- Latin America Market Size (US$ Mn) and Volume (Units) Forecast, by Application, 2026-2033
- Power & Energy
- Oil & Gas
- Chemical & Petrochemical
- Water & Wastewater
- HVAC & Building Services
- Pulp & Paper / Steel & Metals
- Middle East & Africa Expansion Joints Market Outlook: Historical (2020 - 2025) and Forecast (2026 - 2033)
- Key Highlights
- Pricing Analysis
- Middle East & Africa Market Size (US$ Mn) and Volume (Units) Forecast, by Country, 2026-2033
- GCC Countries
- South Africa
- Northern Africa
- Rest of MEA
- Middle East & Africa Market Size (US$ Mn) and Volume (Units) Forecast, by Material Type, 2026-2033
- Metallic
- Single Expansion Joints
- Hinged Expansion Joints
- Gimbal Expansion Joints
- Universal Expansion Joints
- Pressure-Balanced (Elbow & In-line)
- Toroidal Expansion Joints
- Misc.
- Fabric
- Standard Fabric Expansion Joints
- Multi-Layer Fabric Expansion Joints
- Misc.
- Rubber
- Spool-Type Rubber Expansion Joints
- Arch-Type Rubber Expansion Joints
- Misc.
- Misc.
- Metallic
- Middle East & Africa Market Size (US$ Mn) and Volume (Units) Forecast, by Equipment Type, 2026-2033
- Axial
- Lateral
- Angular
- Universal / Multi-Directional
- Pressure Balanced
- Misc.
- Middle East & Africa Market Size (US$ Mn) and Volume (Units) Forecast, by Application, 2026-2033
- Power & Energy
- Oil & Gas
- Chemical & Petrochemical
- Water & Wastewater
- HVAC & Building Services
- Pulp & Paper / Steel & Metals
- Competition Landscape
- Market Share Analysis, 2025
- Market Structure
- Competition Intensity Mapping
- Competition Dashboard
- Company Profiles
- Trelleborg AB
- Company Overview
- Product Portfolio/Offerings
- Key Financials
- SWOT Analysis
- Company Strategy and Key Developments
- EagleBurgmann
- Witzenmann
- Weldmac
- Unaflex
- BOA Group
- Flexider
- Senior Flexonics Pathway
- Macoga
- Tofle
- S. Bellows
- Technoflex
- Trelleborg AB
- Appendix
- Research Methodology
- Research Assumptions
- Acronyms and Abbreviations

Loading page data
Please wait a moment


