

- Executive Summary
- EMEA De-Aromatic Solvents Market Snapshot 2026 and 2033
- Market Opportunity Assessment, 2026-2033, US$ Mn
- Key Market Trends
- Industry Developments and Key Market Events
- Demand Side and Supply Side Analysis
- PMR Analysis and Recommendations
- Market Overview
- Market Scope and Definitions
- Value Chain Analysis
- Macro-Economic Factors
- EMEA GDP Outlook
- EMEA Paints & Coatings Market by Country
- EMEA Adhesives & Sealants Market by Country
- EMEA Metalworking Market Overview
- Forecast Factors – Relevance and Impact
- COVID-19 Impact Assessment
- PESTLE Analysis
- Porter's Five Forces Analysis
- Geopolitical Tensions: Market Impact
- Regulatory and Technology Landscape
- Market Dynamics
- Drivers
- Restraints
- Opportunities
- Trends
- Price Trend Analysis, 2020 – 2033
- Country-wise Price Analysis
- Price by Segments
- Price Impact Factors
- EMEA De-Aromatic Solvents Market Outlook:
- Key Highlights
- EMEA De-Aromatic Solvents Market Outlook: Flash Point
- Introduction/Key Findings
- Historical Market Size (US$ Mn) and Volume (Tons) Analysis by Flash Point, 2020-2025
- Current Market Size (US$ Mn) and Volume (Tons) Analysis and Forecast, by Flash Point, 2026-2033
- Low Flash Point
- Medium Flash Point
- High Flash Point
- Market Attractiveness Analysis: Flash Point
- EMEA De-Aromatic Solvents Market Outlook: Boiling Point
- Introduction/Key Findings
- Historical Market Size (US$ Mn) and Volume (Tons) Analysis by Boiling Point, 2020-2025
- Current Market Size (US$ Mn) and Volume (Tons) Analysis and Forecast, by Boiling Point, 2026-2033
- Type 1
- Type 2
- Type 3
- Market Attractiveness Analysis: Boiling Point
- EMEA De-Aromatic Solvents Market Outlook: Application
- Introduction/Key Findings
- Historical Market Size (US$ Mn) and Volume (Tons) Analysis by Application, 2020-2025
- Current Market Size (US$ Mn) and Volume (Tons) Analysis and Forecast, by Application, 2026-2033
- Paints, Coatings, and Inks
- Metalworking
- Industrial Cleaning
- Adhesives & Sealants
- Drilling Fluids
- Consumer Products
- Others
- Market Attractiveness Analysis: Application
- EMEA De-Aromatic Solvents Market Outlook: Country
- Introduction/Key Findings
- Historical Market Size (US$ Mn) and Volume (Tons) Analysis by Country, 2020-2025
- Current Market Size (US$ Mn) and Volume (Tons) Analysis and Forecast, by Country, 2026-2033
- Germany
- France
- U.K.
- Italy
- Spain
- Rest of Europe
- GCC
- South Africa
- Northern Africa
- Rest of MEA
- Market Attractiveness Analysis: Country
- Competition Landscape
- Market Share Analysis, 2025
- Market Structure
- Competition Intensity Mapping
- Competition Dashboard
- Company Profiles
- Idemitsu Kosan Co., Ltd
- Company Overview
- Product Portfolio/Offerings
- Key Financials
- SWOT Analysis
- Company Strategy and Key Developments
- Raj Petro Specialities P. Ltd.
- Arham Petrochem Private Limited
- Avant Petrochem Private Limited
- Isu Exachem Co. Ltd
- ExxonMobil Corporation
- Shell Plc
- total S.A.
- Appendix
- Research Methodology
- Research Assumptions
- Acronyms and Abbreviations


- Bulk Chemicals
- EMEA De-aromatic Solvents Market
EMEA De-aromatic Solvents Market Size, Share, and Growth Forecast 2026 – 2033
De-aromatic Solvents Market by Flash Point (Low Flash Point, Medium Flash Point, and High Flash Point), Boiling Point (Type 1, Type 2, and Type 3), Application (Paints, Coatings, and Inks, Metalworking, Industrial Cleaning, Adhesives & Sealants, Drilling Fluids, Consumer Products, and Others), and Regional Analysis 2026-2033
Key Market Highlights
- Leading Region: Europe dominates the EMEA de-aromatic solvents market, commanding 68% regional share, with Germany, France, UK, and Benelux countries providing established industrial demand, stringent regulatory frameworks, and advanced manufacturing capabilities supporting sustained expansion through 2033 forecast period.
- Fastest Growing Region: The Middle East and Africa regions represent the fastest-growing EMEA segments, expanding at 6.8% CAGR, driven by petrochemical infrastructure development, industrial diversification, construction sector growth, and expanding specialty chemical manufacturing capabilities, attracting multinational producer investment.
- Dominant Boiling Point: The Medium flash point segment represents the dominant category, capturing 52% market share through versatile application compatibility, superior handling safety, and regulatory compliance advantages supporting expanded adoption across paints, coatings, metalworking, and industrial cleaning applications.
- Fastest Growing Segment: Type 1 Boiling Point and Paints, Coatings, Inks segments demonstrate fastest expansion, growing at 6.2% and 6.1% CAGR respectively, driven by construction renovation programs, automotive modernization, coating system advancement, and expanding architectural finish markets supporting industrial growth.
- Key Market Opportunity: Aerospace and marine segment growth opportunity, with an estimated 7.1% CAGR, enabled by advanced coating system requirements, IMO 2020 compliance mandates, defense modernization programs, and extended asset lifespan expectations driving premium de-aromatic formulation adoption across high-performance applications.
| Report Attribute | Details |
|---|---|
|
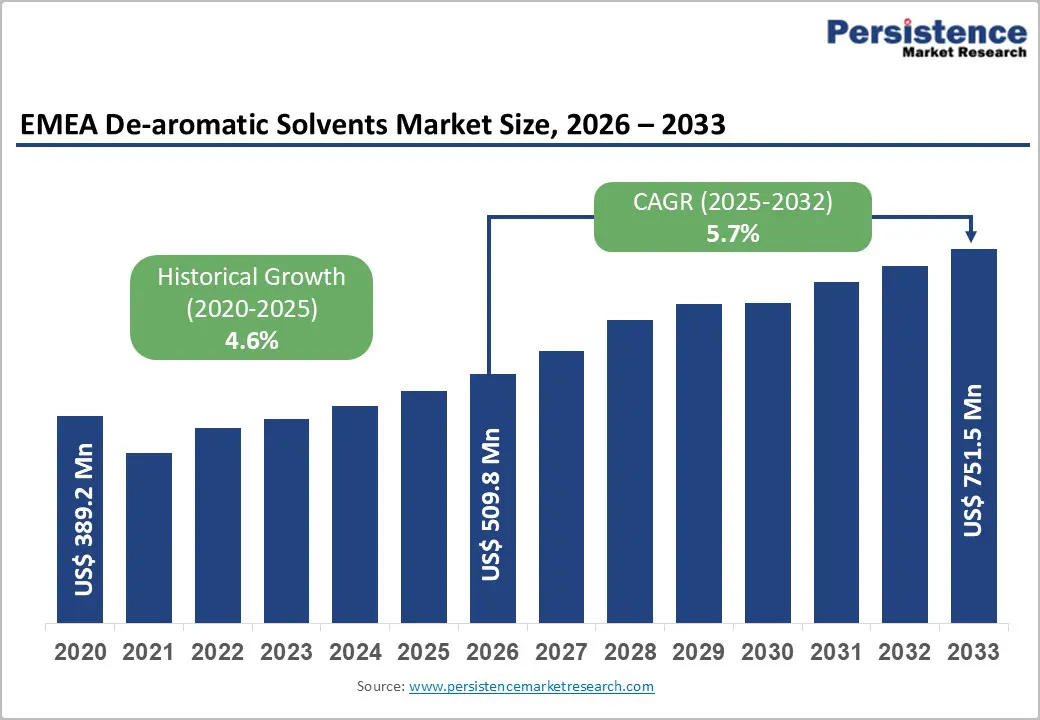
EMEA De-aromatic Solvents Market Size (2026E) |
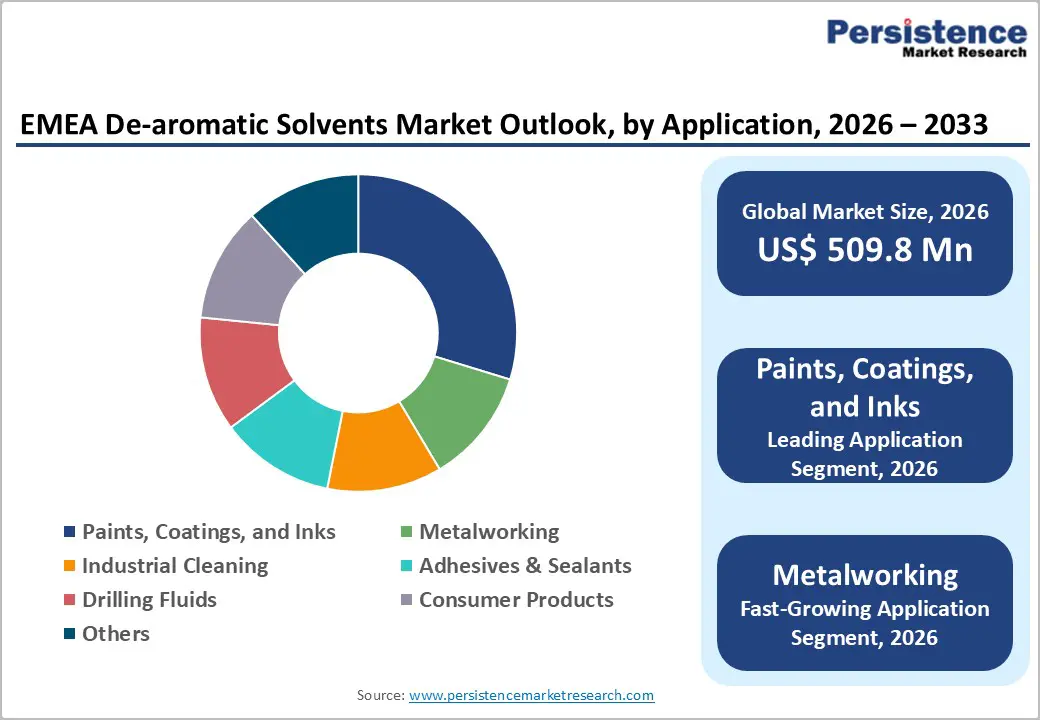
US$ 509.8 Mn |
|
Market Value Forecast (2033F) |
US$ 751.5 Mn |
|
Projected Growth CAGR (2026-2033) |
5.7% |
|
Historical Market Growth (2020-2025) |
4.6% |
Market Dynamics
Drivers - Expanding Use of Solvent-Based Formulations in Industrial and Maintenance Applications Driving Demand in EMEA
The continued reliance on solvent-based formulations across critical industrial, infrastructure, and maintenance activities is another major driver for the EMEA de-aromatic solvent market. Despite the gradual adoption of water-based and bio-based systems, many applications in paints and coatings, metalworking, corrosion protection, agrochemicals, and industrial cleaning still require solvents that deliver strong solvency, controlled evaporation, and formulation stability under challenging conditions. De-aromatic solvents meet these functional requirements while offering significantly lower odor and reduced health risks compared to traditional aromatic solvents.
In the Middle East, harsh operating environments, high temperatures, and heavy industrial usage in construction and oil & gas sectors are sustaining demand for high-flash-point, safer solvents that enhance handling and storage safety. In Europe, ongoing refurbishment of infrastructure and industrial assets continues to support consumption of high-performance maintenance coatings and cleaners. Meanwhile, Africa’s expanding manufacturing and infrastructure base is increasing the need for reliable, cost-effective solvent solutions. This sustained dependence on performance-driven solvent systems, combined with a shift toward safer alternatives, is a strong driver underpinning the growth of de-aromatic solvents across the EMEA region.
Expanding Construction, Automotive, and Aerospace Sectors Driving Application Demand
The EMEA region is experiencing substantial industrial growth across construction, automotive, and aerospace sectors, consuming significant solvent volumes and creating substantial de-aromatic demand. European renovation programmes funded by the European Green Deal, targeting the refurbishment of 35 million buildings by 2030, are driving substantial demand for specialty coatings and protective systems requiring de-aromatic solvent formulations meeting durability and environmental standards. Germany's automotive industry, employing over 750,000 workers, maintains leadership in precision manufacturing requiring advanced metalworking fluids incorporating de-aromatic solvents for optimal machining performance, tool life extension, and emission reduction.
France's established aerospace manufacturing capabilities supporting Airbus operations and defense programs consume substantial solvent volumes, with aircraft component manufacturing increasingly requiring low-VOC and low-toxicity formulations for worker safety and regulatory compliance. The UK aerospace and marine sectors specify advanced coating systems incorporating de-aromatic solvents meeting IMO 2020 low-sulphur fuel standards and corrosion protection requirements for extended asset lifespan. The convergence of accelerating industrial output, stringent performance specifications, and environmental mandates across multiple EMEA industrial sectors creates diversified, durable demand for de-aromatic solvent products.
Restraints - Volatile Crude Oil Pricing and Feedstock Cost Volatility
Crude oil price fluctuations directly impact de-aromatic solvent manufacturing costs and market profitability, creating uncertainty and margin compression, affecting industry viability. Geopolitical tensions and supply disruptions have historically driven crude oil volatility, with 2024 price fluctuations impacting refinery economics and solvent production optimization. Petrochemical feedstock costs represent 60-70% of typical de-aromatic solvent production expenses, making solvent pricing highly sensitive to upstream energy markets.
Smaller manufacturers and regional producers often lack hedging mechanisms and long-term supply contracts available to multinational competitors, creating competitive disadvantages during price volatility periods. Raw material cost increases reduce customer willingness to transition from lower-cost aromatic solvents unless regulatory mandates create substitution imperatives. The combination of upstream price volatility, limited manufacturing flexibility, and constrained margins has historically limited market expansion, particularly impacting mid-size producers and emerging market participants.
Competition from Bio-based and Sustainable Alternative Solvents
Emerging bio-based and bio-derived solvent technologies are creating competitive pressure against petroleum-derived de-aromatic solvents, with manufacturers increasingly developing sustainable alternatives from renewable feedstocks. Bio-based solvents derived from vegetable oils, plant extracts, and fermentative processes offer environmental benefits, including reduced carbon footprints, enhanced biodegradability, and renewable sourcing, aligning with European sustainability narratives and climate objectives. The European Commission's commitment to circular economy principles and support for bio-based chemical development under Horizon Europe programs has catalyzed substantial investment in renewable solvent technologies.
Consumer preferences for sustainable products and corporate environmental commitments are accelerating the adoption of bio-based alternatives, particularly among premium consumer goods manufacturers and forward-thinking industrial companies. Performance parity between bio-based and petroleum-derived de-aromatic solvents in many applications has eliminated traditional technical differentiators, allowing bio-based alternatives to compete primarily on sustainability rather than performance characteristics. The progressive maturation of bio-based solvent technologies and expanding manufacturing capacity pose long-term competitive threats to the conventional petroleum-derived de-aromatic solvent market share.
Opportunities - Aerospace and Marine Applications Incorporating Advanced Corrosion Protection and Performance Standards
The EMEA aerospace and marine sectors are adopting advanced coating systems incorporating de-aromatic solvents to meet emerging performance requirements and regulatory standards, with significant growth potential through 2033. Aerospace primes, including Airbus, are advancing requirements for chromate-free corrosion inhibitors compliant with REACH Annex XVII while maintaining resistance to hydraulic-fluid immersion and extended service life expectations. Polyurethane topcoats incorporating near-infrared reflectance pigments and advanced formulations require de-aromatic solvents meeting performance, safety, and environmental standards, with coating systems reducing cabin temperature by 5°C and improving operational efficiency.
European maritime operators complying with IMO 2020 low-sulphur fuel standards and increasingly stringent exhaust-gas acidity requirements are specifying epoxy-novolac tank linings with enhanced chemical barrier properties, driving demand for premium de-aromatic solvent formulations. Naval shipbuilding programs in the UK and Northern Europe supporting defense modernization and maritime security objectives are consuming substantial volumes of advanced protective coatings incorporating de-aromatic components. The development of new-generation aircraft and next-generation naval vessels with extended operational lifespans and enhanced performance requirements creates sustained demand for premium solvent formulations capable of supporting sophisticated coating systems and specialized applications.
Stringent REACH Regulations and Environmental Compliance Requirements
The European Union's REACH Regulation established comprehensive frameworks mandating progressive reduction of hazardous chemical substances in industrial formulations, compelling manufacturers to transition from conventional aromatic solvents toward safer de-aromatic alternatives. Polycyclic Aromatic Hydrocarbons (PAHs) face increasingly restrictive regulations, with Annex XVII Entry 50a limiting PAH content to 50 mg/kg in clay dust targets effective from April 22, 2026, creating substantial demand for compliant de-aromatic formulations. Over 40% of European manufacturers have already transitioned to eco-friendly alternatives including de-aromatic solvents to achieve REACH Directive compliance, demonstrating substantial market momentum.
The European Commission's Green Deal initiative emphasizing industrial decarbonization and sustainable chemistry practices has created accelerated timelines for solvent reformulation, with manufacturers requiring compliant product portfolios to maintain market access. Regulatory enforcement mechanisms, including product liability, market surveillance, and compliance penalties, create compelling economic imperatives for de-aromatic solvent adoption. The European Technology Platform for Sustainable Chemistry continues to identify de-aromatic solvents as key enabling technologies for meeting environmental and safety objectives, further solidifying regulatory support for market expansion.
Category-wise Analysis
Flash Point Insights
The medium flash point segment dominates the EMEA de-aromatic solvents market, commanding approximately 52% of total market share due to distinctive advantages in application versatility, handling safety, and regulatory alignment. Medium flash point de-aromatic solvents demonstrate optimal balance between stability and volatility, offering controlled evaporation rates and superior handling characteristics compared to low flash point alternatives while maintaining performance advantages over high flash point products. Paints, coatings, adhesives, and industrial cleaning applications constitute primary consumption categories for medium flash point solvents, which enable safe formulation, convenient application, reduced workplace hazards, and compliance with stringent occupational safety standards across European manufacturing facilities.
German and UK precision manufacturing sectors extensively utilize medium flash point solvents in aerospace component coating, automotive system assembly, and machinery protection applications requiring reliability and consistent performance under demanding industrial conditions. The regulatory emphasis on workplace safety and occupational exposure limits established through REACH and occupational health directives further reinforces medium flash point segment dominance, as these formulations demonstrate superior safety profiles compared to low flash point alternatives. Product availability established supply chains, and proven application histories for medium flash point solvents across diverse EMEA industrial sectors provide competitive advantages supporting sustained segment leadership through the 2033 forecast period.
Boiling Point Insights
The type 1 boiling point category represents the dominant segment within EMEA de-aromatic solvents market, representing approximately 54% of market share and demonstrating sustained expansion across industrial applications. Type 1 de-aromatic solvents, characterized by lower boiling point ranges, offer rapid evaporation rates and superior flow characteristics essential for efficient application in fast-drying coating systems, architectural finishes, and industrial formulations requiring expedited drying cycles. Construction sector demand for rapid-setting coatings supporting building renovation timelines and automotive manufacturing requirements for efficient production cycles drive substantial consumption of Type 1 solvents.
Industrial adhesive formulations, printing ink systems, and specialty coating applications extensively utilize Type 1 solvents where rapid solvent evaporation enables expedited assembly processes and enhanced productivity. The European paints and coatings market expansion targeting 35 million building refurbishments increases demand for Type 1 solvents suitable for architectural applications where drying speed supports project scheduling and labor productivity. Technical compatibility with diverse resin systems and pigment formulations, combined with established regulatory acceptance and supply chain maturity, continues to reinforce Type 1 segment leadership throughout EMEA markets.
Application Insights
The Paints, Coatings, and Inks segment represents the dominant application category, capturing approximately 48% of the EMEA de-aromatic solvents market share and demonstrating sustained expansion across residential, commercial, and industrial end-uses. European painting and coatings markets consume over 2.3 million metric tonnes of solvents annually, with de-aromatic formulations increasingly preferred for meeting REACH compliance, reducing VOC emissions, and supporting worker safety objectives. The European Commission's public procurement policies awarding evaluation premiums for paints with VOC levels below 30 g/L have catalyzed substantial reformulation toward de-aromatic formulations, with water-borne and low-solvent coating systems incorporating de-aromatic components becoming standard practice across specification development.
Aerospace coating systems, marine protective systems, and high-performance industrial finishes increasingly incorporate de-aromatic solvents meeting stringent durability, corrosion resistance, and environmental specifications. Automotive original equipment manufacturer (OEM) specifications requiring advanced clearcoat systems and base coat formulations increasingly mandate de-aromatic or minimal-aromatic solvent compositions for environmental compliance and worker safety alignment. Construction sector renovation activities, infrastructure maintenance projects, and new building construction across EMEA regions consume substantial coating volumes, with de-aromatic solvents representing preferred formulation approach supporting regulatory compliance and sustainability objectives.
Regional Insights
Germany De-aromatic Solvents Market Trends
Germany remains the EMEA region's dominant de-aromatic solvents market, commanding approximately 32% of regional market share, supported by the country's robust automotive and precision engineering sectors, established chemical manufacturing infrastructure, and stringent environmental regulatory leadership. German manufacturing base employs over 750,000 automotive workers across precision machining, component manufacturing, and vehicle assembly operations, consuming substantial metalworking fluid volumes. The German Federal Ministry for Economic Affairs reports that over 70% of German manufacturers utilize advanced de-aromatic metalworking fluids, reflecting leadership adoption of compliant, low-VOC formulations supporting operational efficiency and regulatory compliance.
France De-aromatic Solvents Market Trends
France contributes approximately 18% of the EMEA market share, supported by established aerospace manufacturing capabilities supporting Airbus production operations, automotive component manufacturing, and specialized coatings industries. French aerospace and defense sectors require advanced coating systems incorporating de-aromatic solvents for aircraft component protection and maritime applications. The French Environment Agency reports 15% annual increases in bio-based and de-aromatic MWF utilization in high-performance applications, reflecting progressive market transition toward compliant solvent formulations.
United Kingdom De-aromatic Solvents Trends
The United Kingdom accounts for approximately 16% of EMEA market share, driven by aerospace and marine manufacturing capabilities, automotive supply chains, and post-Brexit manufacturing realignment toward premium, compliant product portfolios. The UK government's commitment to sustainable manufacturing and advanced technology development supports de-aromatic solvent adoption throughout precision manufacturing sectors. Northern European regions including Scandinavia and Benelux countries collectively represent approximately 19% of EMEA market share, with established chemical manufacturing infrastructure, stringent environmental standards, and substantial paints, coatings, and specialty chemical industries driving regional demand.
Middle East Africa De-aromatic Solvents Trends
Middle East and Africa regions contribute approximately 15% of the EMEA market share, with expanding industrial development, petrochemical manufacturing integration, and construction sector growth driving de-aromatic solvent consumption. UAE and Saudi Arabia petrochemical refineries increasingly produce de-aromatic solvent products, supporting regional demand and enabling broader Middle East distribution networks. African industrial development, particularly in South Africa, supports expanding de-aromatic solvent markets through automotive component manufacturing, construction material production, and industrial processing applications.

Competitive Landscape
The EMEA de-aromatic solvents market demonstrates moderate consolidation, with multinational integrated petrochemical companies including Total S.A., Royal Dutch Shell plc., and Exxon Mobil Corporation commanding substantial market share through vertically integrated operations, established distribution infrastructure, and comprehensive product portfolios. The top three global manufacturers control approximately 38% of revenue, reflecting significant concentration among multinational producers while enabling mid-size and specialized manufacturers to sustain competitive positions in regional niche applications. Large producers employ sophisticated solvent recovery and closed-loop technologies supporting cost efficiency, environmental compliance, and competitive margin maintenance across volatile feedstock cost environments.
German and UK manufacturers emphasize innovation-driven differentiation through advanced formulation development, application-specific customization, and superior technical support capabilities. Strategic expansion initiatives, including capacity augmentation, geographic market expansion, and merger-acquisition activity among major producers, reflect competitive pressure and market consolidation dynamics. Emerging business model evolution toward circular economy principles, solvent recycling, and closed-loop manufacturing positions forward-thinking manufacturers advantageously for long-term regulatory compliance and sustainability objectives. Key differentiators, including technical expertise, regulatory compliance capabilities, supply chain reliability, and environmental performance, increasingly determine competitive positioning within quality-conscious EMEA industrial markets.
Key Developments:
- In June 2025, EU REACH Revisions: The European Commission proposed significant REACH Regulation revisions effective Q4 2025, introducing stringent PMT (Persistent, Mobile, Toxic) and vPvM (very Persistent, very Mobile) substance assessment methodologies, accelerating de-aromatic solvent adoption in compliant formulation development.
- In October 2024, Exxon Mobil Corporation expanded de-aromatic solvent production capacity by 250,000 tons for global hydrocarbon solvents, with manufacturing facilities in Singapore and Antwerp, enabling enhanced market supply and regional distribution capability supporting EMEA customer demand growth.
- In August 2024, DHC Solvent Chemie Investments DHC Solvent Chemie GmbH, the Germany-based specialty solvent manufacturer, announced substantial investment in sustainable solvent technologies and circular economy initiatives, reinforcing its commitment to bio-based and de-aromatic product development, supporting EMEA market expansion
Companies Covered in EMEA De-aromatic Solvents Market
- Total S.A.
- Royal Dutch Shell plc.
- Exxon Mobil Corporation
- Idemitsu Kosan Co., Ltd.
- NESTE
- DHC Solvent Chemie GmbH
- CEPSA
- Chevron Corporation
- BP p.l.c.
- Evonik Industries AG
- Huntsman International LLC
- Calumet Specialty Products Partners
- Nynas AB
Frequently Asked Questions
The EMEA de-aromatic solvents market size was valued at US$ 509.8 Billion in 2026 and is projected to reach US$ 751.5 Billion by 2033, expanding at a CAGR of 5.7% throughout the forecast period, driven by stringent regulatory compliance requirements and expanding industrial applications across automotive, aerospace, and construction sectors.
REACH Regulation compliance mandates progressively restricting hazardous aromatic compounds, coupled with expanding aerospace, automotive, and construction sectors requiring advanced coating systems and metalworking fluids, represent primary demand drivers. Accelerating electric vehicle component manufacturing and building renovation programs targeting 35 million structures by 2030 substantially increase de-aromatic solvent consumption across EMEA regions.
Paints, Coatings, and Inks segment represents the dominant application category, commanding approximately 48% market share, supported by construction sector renovation demand, automotive manufacturing requirements, aerospace coating system advancement, and regulatory emphasis on low-VOC formulations supporting worker safety and environmental protection objectives.
Europe, particularly Germany, France, and UK, represents the dominant EMEA region, commanding approximately 68% market share, supported by established automotive, aerospace, chemical manufacturing sectors, stringent regulatory frameworks, and advanced precision engineering capabilities. Germany alone accounts for 32% of EMEA market share through industry leadership and manufacturing excellence.
Electric vehicle manufacturing and lightweight materials processing represents the highest growth opportunity, with EV component demand projected to expand 12% annually, requiring specialized metalworking fluids and coating systems incorporating de-aromatic solvents. Aerospace and marine applications pursuing advanced corrosion protection and extended asset lifespan through premium coating systems represent secondary high-potential opportunity with 7.1% CAGR through 2033.
Total S.A., Royal Dutch Shell plc., and Exxon Mobil Corporation represent the leading multinational producers commanding approximately 38% combined market share, supported by DHC Solvent Chemie GmbH, NESTE, CEPSA, and Idemitsu Kosan Co., Ltd. occupying significant regional positions. Calumet Specialty Products, Chevron Corporation, BP p.l.c., Huntsman International, and Evonik Industries AG maintain competitive positions through differentiated product portfolios and customer-focused service delivery.


