


- Executive Summary
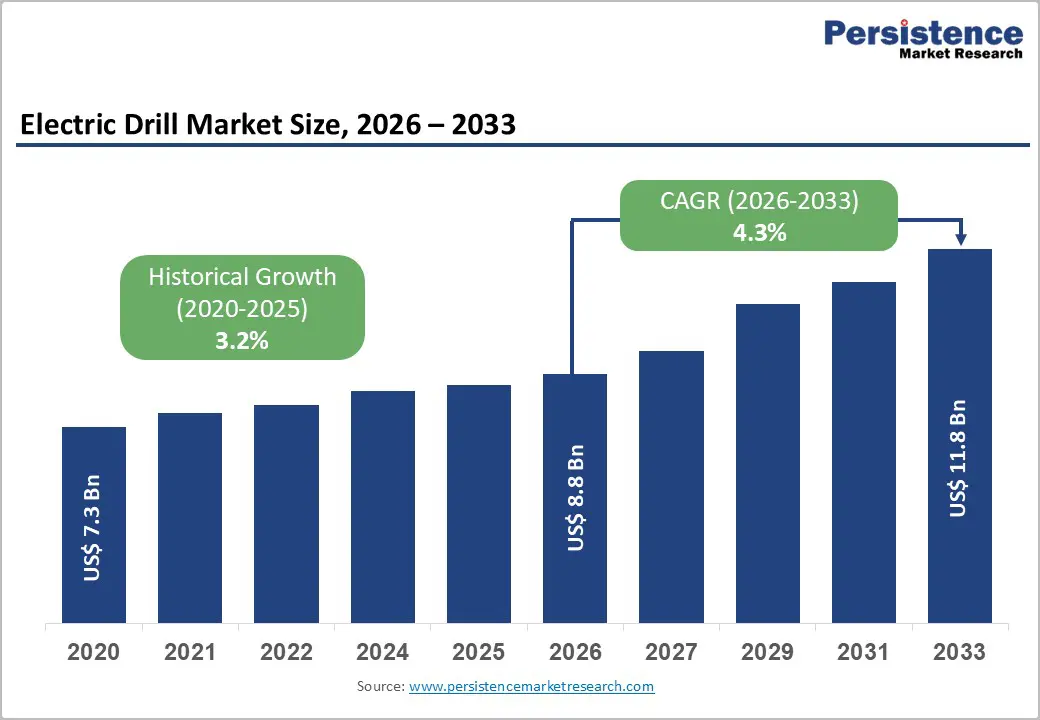
- Global Electric Drill Market Snapshot 2026 and 2033
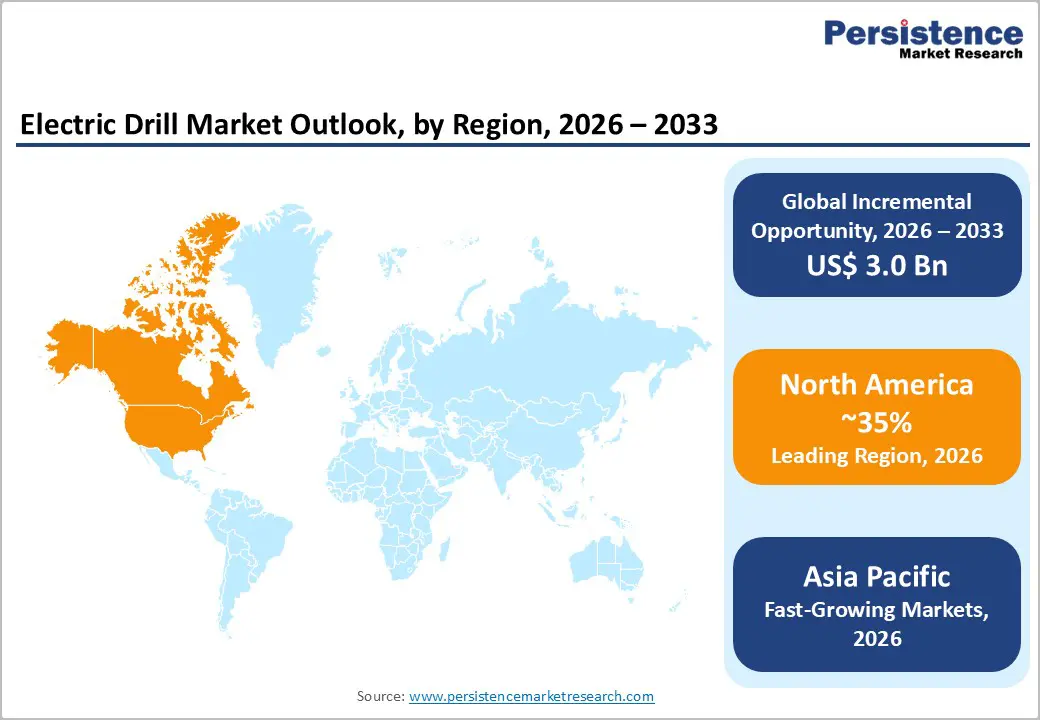
- Market Opportunity Assessment, 2026-2033, US$ Bn
- Key Market Trends
- Industry Developments and Key Market Events
- Demand Side and Supply Side Analysis
- PMR Analysis and Recommendations
- Market Overview
- Market Scope and Definitions
- Value Chain Analysis
- Macro-Economic Factors
- Global GDP Outlook
- Global Prison Growth Outlook
- Global Crime Rates by Country
- Global Prison Population by Country
- Global Private Prison Market Growth Outlook
- Other Macro-economic Factors
- Forecast Factors – Relevance and Impact
- COVID-19 Impact Assessment
- PESTLE Analysis
- Porter's Five Forces Analysis
- Geopolitical Tensions: Market Impact
- Regulatory and Technology Landscape
- Market Dynamics
- Drivers
- Restraints
- Opportunities
- Trends
- Price Trend Analysis, 2020 – 2033
- Region-wise Price Analysis
- Price by Segments
- Price Impact Factors
- Global Electric Drill Market Outlook: Historical (2020 – 2025) and Forecast (2026 – 2033)
- Key Highlights
- Global Electric Drill Market Outlook: Product Type
- Introduction/Key Findings
- Historical Market Size (US$ Bn) and Volume (Units) Analysis by Product Type, 2020-2025
- Current Market Size (US$ Bn) and Volume (Units) Forecast, by Product Type, 2026-2033
- Hammer Drills
- Impact Drills
- Rotary Drills
- Others
- Market Attractiveness Analysis: Product Type
- Global Electric Drill Market Outlook: Power Source
- Introduction/Key Findings
- Historical Market Size (US$ Bn) and Volume (Units) Analysis by Power Source, 2020-2025
- Current Market Size (US$ Bn) and Volume (Units) Forecast, by Power Source, 2026-2033
- AC Powered
- Battery/DC Powered
- Others
- Market Attractiveness Analysis: Power Source
- Global Electric Drill Market Outlook: Price Range
- Introduction/Key Findings
- Historical Market Size (US$ Bn) and Volume (Units) Analysis by Price Range, 2020-2025
- Current Market Size (US$ Bn) and Volume (Units) Forecast, by Price Range, 2026-2033
- Mass
- Premium Range
- Market Attractiveness Analysis: Price Range
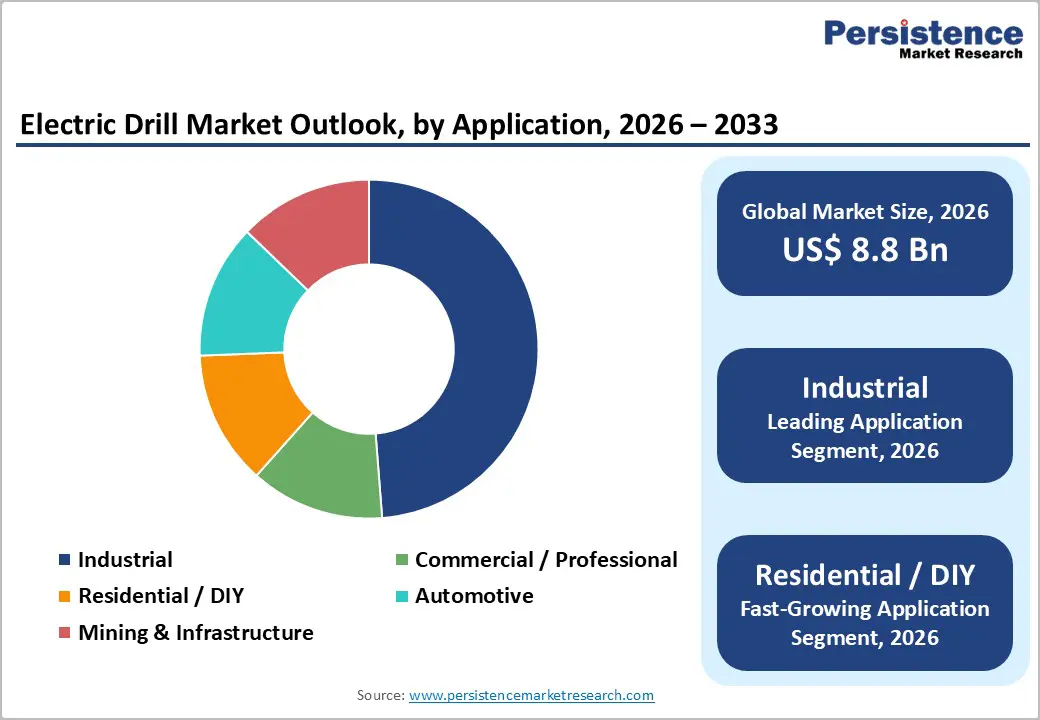
- Global Electric Drill Market Outlook: Application
- Introduction/Key Findings
- Historical Market Size (US$ Bn) and Volume (Units) Analysis by Application, 2020-2025
- Current Market Size (US$ Bn) and Volume (Units) Forecast, by Application, 2026-2033
- Industrial
- Commercial / Professional
- Residential / DIY
- Automotive
- Mining & Infrastructure
- Market Attractiveness Analysis: Application
- Global Electric Drill Market Outlook: Sales Channel
- Introduction/Key Findings
- Historical Market Size (US$ Bn) and Volume (Units) Analysis by Sales Channel, 2020-2025
- Current Market Size (US$ Bn) and Volume (Units) Forecast, by Sales Channel, 2026-2033
- Supermarkets/Hypermarkets
- Specialty Tool Stores
- Hardware Stores
- E-commerce Marketplaces
- Branded Online Stores
- Market Attractiveness Analysis: Sales Channel
- Global Electric Drill Market Outlook: Region
- Key Highlights
- Historical Market Size (US$ Bn) and Volume (Units) Analysis by Region, 2020-2025
- Current Market Size (US$ Bn) and Volume (Units) Forecast, by Region, 2026-2033
- North America
- Europe
- East Asia
- South Asia & Oceania
- Latin America
- Middle East & Africa
- Market Attractiveness Analysis: Region
- North America Electric Drill Market Outlook: Historical (2020 – 2025) and Forecast (2026 – 2033)
- Key Highlights
- Pricing Analysis
- North America Market Size (US$ Bn) and Volume (Units) Forecast, by Country, 2026-2033
- U.S.
- Canada
- North America Market Size (US$ Bn) and Volume (Units) Forecast, by Product Type, 2026-2033
- Hammer Drills
- Impact Drills
- Rotary Drills
- Others
- North America Market Size (US$ Bn) and Volume (Units) Forecast, by Power Source, 2026-2033
- AC Powered
- Battery/DC Powered
- Others
- North America Market Size (US$ Bn) and Volume (Units) Forecast, by Price Range, 2026-2033
- Mass
- Premium Range
- North America Market Size (US$ Bn) and Volume (Units) Forecast, by Application, 2026-2033
- Industrial
- Commercial / Professional
- Residential / DIY
- Automotive
- Mining & Infrastructure
- North America Market Size (US$ Bn) and Volume (Units) Forecast, by Sales Channel, 2026-2033
- Supermarkets/Hypermarkets
- Specialty Tool Stores
- Hardware Stores
- E-commerce Marketplaces
- Branded Online Stores
- Europe Electric Drill Market Outlook: Historical (2020 – 2025) and Forecast (2026 – 2033)
- Key Highlights
- Pricing Analysis
- Europe Market Size (US$ Bn) and Volume (Units) Forecast, by Country, 2026-2033
- Germany
- Italy
- France
- U.K.
- Spain
- Russia
- Rest of Europe
- Europe Market Size (US$ Bn) and Volume (Units) Forecast, by Product Type, 2026-2033
- Hammer Drills
- Impact Drills
- Rotary Drills
- Others
- Europe Market Size (US$ Bn) and Volume (Units) Forecast, by Power Source, 2026-2033
- AC Powered
- Battery/DC Powered
- Others
- Europe Market Size (US$ Bn) and Volume (Units) Forecast, by Price Range, 2026-2033
- Mass
- Premium Range
- Europe Market Size (US$ Bn) and Volume (Units) Forecast, by Application, 2026-2033
- Industrial
- Commercial / Professional
- Residential / DIY
- Automotive
- Mining & Infrastructure
- Europe Market Size (US$ Bn) and Volume (Units) Forecast, by Sales Channel, 2026-2033
- Supermarkets/Hypermarkets
- Specialty Tool Stores
- Hardware Stores
- E-commerce Marketplaces
- Branded Online Stores
- East Asia Electric Drill Market Outlook: Historical (2020 – 2025) and Forecast (2026 – 2033)
- Key Highlights
- Pricing Analysis
- East Asia Market Size (US$ Bn) and Volume (Units) Forecast, by Country, 2026-2033
- China
- Japan
- South Korea
- East Asia Market Size (US$ Bn) and Volume (Units) Forecast, by Product Type, 2026-2033
- Hammer Drills
- Impact Drills
- Rotary Drills
- Others
- East Asia Market Size (US$ Bn) and Volume (Units) Forecast, by Power Source, 2026-2033
- AC Powered
- Battery/DC Powered
- Others
- East Asia Market Size (US$ Bn) and Volume (Units) Forecast, by Price Range, 2026-2033
- Mass
- Premium Range
- East Asia Market Size (US$ Bn) and Volume (Units) Forecast, by Application, 2026-2033
- Industrial
- Commercial / Professional
- Residential / DIY
- Automotive
- Mining & Infrastructure
- East Asia Market Size (US$ Bn) and Volume (Units) Forecast, by Sales Channel, 2026-2033
- Supermarkets/Hypermarkets
- Specialty Tool Stores
- Hardware Stores
- E-commerce Marketplaces
- Branded Online Stores
- South Asia & Oceania Electric Drill Market Outlook: Historical (2020 – 2025) and Forecast (2026 – 2033)
- Key Highlights
- Pricing Analysis
- South Asia & Oceania Market Size (US$ Bn) and Volume (Units) Forecast, by Country, 2026-2033
- India
- Southeast Asia
- ANZ
- Rest of SAO
- South Asia & Oceania Market Size (US$ Bn) and Volume (Units) Forecast, by Product Type, 2026-2033
- Hammer Drills
- Impact Drills
- Rotary Drills
- Others
- South Asia & Oceania Market Size (US$ Bn) and Volume (Units) Forecast, by Power Source, 2026-2033
- AC Powered
- Battery/DC Powered
- Others
- South Asia & Oceania Market Size (US$ Bn) and Volume (Units) Forecast, by Price Range, 2026-2033
- Mass
- Premium Range
- South Asia & Oceania Market Size (US$ Bn) and Volume (Units) Forecast, by Application, 2026-2033
- Industrial
- Commercial / Professional
- Residential / DIY
- Automotive
- Mining & Infrastructure
- South Asia & Oceania Market Size (US$ Bn) and Volume (Units) Forecast, by Sales Channel, 2026-2033
- Supermarkets/Hypermarkets
- Specialty Tool Stores
- Hardware Stores
- E-commerce Marketplaces
- Branded Online Stores
- Latin America Electric Drill Market Outlook: Historical (2020 – 2025) and Forecast (2026 – 2033)
- Key Highlights
- Pricing Analysis
- Latin America Market Size (US$ Bn) and Volume (Units) Forecast, by Country, 2026-2033
- Brazil
- Mexico
- Rest of LATAM
- Latin America Market Size (US$ Bn) and Volume (Units) Forecast, by Product Type, 2026-2033
- Hammer Drills
- Impact Drills
- Rotary Drills
- Others
- Latin America Market Size (US$ Bn) and Volume (Units) Forecast, by Power Source, 2026-2033
- AC Powered
- Battery/DC Powered
- Others
- Latin America Market Size (US$ Bn) and Volume (Units) Forecast, by Price Range, 2026-2033
- Mass
- Premium Range
- Latin America Market Size (US$ Bn) and Volume (Units) Forecast, by Application, 2026-2033
- Industrial
- Commercial / Professional
- Residential / DIY
- Automotive
- Mining & Infrastructure
- Latin America Market Size (US$ Bn) and Volume (Units) Forecast, by Sales Channel, 2026-2033
- Supermarkets/Hypermarkets
- Specialty Tool Stores
- Hardware Stores
- E-commerce Marketplaces
- Branded Online Stores
- Middle East & Africa Electric Drill Market Outlook: Historical (2020 – 2025) and Forecast (2026 – 2033)
- Key Highlights
- Pricing Analysis
- Middle East & Africa Market Size (US$ Bn) and Volume (Units) Forecast, by Country, 2026-2033
- GCC Countries
- South Africa
- Northern Africa
- Rest of MEA
- Middle East & Africa Market Size (US$ Bn) and Volume (Units) Forecast, by Product Type, 2026-2033
- Hammer Drills
- Impact Drills
- Rotary Drills
- Others
- Middle East & Africa Market Size (US$ Bn) and Volume (Units) Forecast, by Power Source, 2026-2033
- AC Powered
- Battery/DC Powered
- Others
- Middle East & Africa Market Size (US$ Bn) and Volume (Units) Forecast, by Price Range, 2026-2033
- Mass
- Premium Range
- Middle East & Africa Market Size (US$ Bn) and Volume (Units) Forecast, by Application, 2026-2033
- Industrial
- Commercial / Professional
- Residential / DIY
- Automotive
- Mining & Infrastructure
- Middle East & Africa Market Size (US$ Bn) and Volume (Units) Forecast, by Sales Channel, 2026-2033
- Supermarkets/Hypermarkets
- Specialty Tool Stores
- Hardware Stores
- E-commerce Marketplaces
- Branded Online Stores
- Competition Landscape
- Market Share Analysis, 2025
- Market Structure
- Competition Intensity Mapping
- Competition Dashboard
- Company Profiles
- Stanely Black & Decker, Inc.
- Company Overview
- Product Portfolio/Offerings
- Key Financials
- SWOT Analysis
- Company Strategy and Key Developments
- Robert Bosch GmbH
- Panasonic Corporation
- Makita Corporation
- Hilti Corporation
- Apex Tool Group
- Emerson Electric Company
- Koki Holdings Company
- Ingersoll-Rand Plc
- Techtronic Industries Company, Ltd.
- Milwaukee Electric Tool Company
- DeWalt Industrial Power Tool Company, Ltd.
- Meterk, Inc.
- Ryobi Limited
- Atlas Copco AB
- Snap-on Incorporated
- Festool GmbH
- Positec Tool Corporation
- Chervon Holdings Limited
- Craftsman
- Bohle GmbH
- Milwaukee Tool
- Stanely Black & Decker, Inc.
- Appendix
- Research Methodology
- Research Assumptions
- Acronyms and Abbreviations

Loading page data
Please wait a moment


