

- Executive Summary
- Global Elder Care Products Market Snapshot, 2025 and 2032
- Market Opportunity Assessment, 2024 – 2032, US$ Bn
- Key Market Trends
- Future Market Projections
- Premium Market Insights
- Industry Developments and Key Market Events
- PMR Analysis and Recommendations
- Market Overview
- Market Scope and Definition
- Market Dynamics
- Drivers
- Restraints
- Opportunity
- Challenges
- Key Trends
- Macro-Economic Factors
- Global Sectorial Outlook
- Global GDP Growth Outlook
- COVID-19 Impact Analysis
- Forecast Factors – Relevance and Impact
- Value Added Insights
- Product Adoption Analysis
- Regulatory Landscape
- Value Chain Analysis
- Key Deals and Mergers
- PESTLE Analysis
- Porter’s Five Force Analysis
- Price Trend Analysis, 2019 – 2032
- Key Highlights
- Key Factors Impacting Product Prices
- Pricing Analysis, By Product Type
- Regional Prices and Product Preferences
- Global Elder Care Products Market Outlook:
- Key Highlights
- Market Volume (Units) Projections
- Market Size (US$ Bn) and Y-o-Y Growth
- Absolute $ Opportunity
- Market Size (US$ Bn) Analysis and Forecast
- Historical Market Size (US$ Bn) Analysis, 2019-2023
- Current Market Size (US$ Bn) Analysis and Forecast, 2024–2032
- Global Elder Care Products Market Outlook: Product Type
- Introduction / Key Findings
- Historical Market Size (US$ Bn) and Volume (Units) Analysis, By Product Type, 2019-2023
- Current Market Size (US$ Bn) and Volume (Units) Analysis and Forecast, By Product Type, 2024–2032
- Incontinence Products
- Consumables
- Assistive devices
- Nutritional Supplements
- Market Attractiveness Analysis: Product Type
- Global Elder Care Products Market Outlook: Type of Care
- Introduction / Key Findings
- Historical Market Size (US$ Bn) Analysis, By Type of Care, 2019-2023
- Current Market Size (US$ Bn) Analysis and Forecast, By Type of Care, 2024–2032
- Home Care
- Chronic Illness Care
- Market Attractiveness Analysis: Type of Care
- Global Elder Care Products Market Outlook: End User
- Introduction / Key Findings
- Historical Market Size (US$ Bn) Analysis, By End User, 2019-2023
- Current Market Size (US$ Bn) Analysis and Forecast, By End User, 2024–2032
- Hospitals
- Nursing Care Facilities
- Home Health Care
- Market Attractiveness Analysis: End User
- Key Highlights
- Global Elder Care Products Market Outlook: Region
- Key Highlights
- Historical Market Size (US$ Bn) and Volume (Units) Analysis, By Region, 2019-2023
- Current Market Size (US$ Bn) and Volume (Units) Analysis and Forecast, By Region, 2024–2032
- North America
- Europe
- East Asia
- South Asia and Oceania
- Latin America
- Middle East & Africa
- Market Attractiveness Analysis: Region
- North America Elder Care Products Market Outlook:
- Key Highlights
- Historical Market Size (US$ Bn) and Volume (Units) Analysis, By Market, 2019-2023
- By Country
- By Product Type
- By Type of Care
- By End User
- Current Market Size (US$ Bn) Analysis and Forecast, By Country, 2024–2032
- U.S.
- Canada
- Current Market Size (US$ Bn) and Volume (Units) Analysis and Forecast, By Product Type, 2024–2032
- Incontinence Products
- Consumables
- Assistive devices
- Nutritional Supplements
- Current Market Size (US$ Bn) Analysis and Forecast, By Type of Care, 2024–2032
- Home Care
- Chronic Illness Care
- Current Market Size (US$ Bn) Analysis and Forecast, By End User, 2024–2032
- Hospitals
- Nursing Care Facilities
- Home Health Care
- Market Attractiveness Analysis
- Europe Elder Care Products Market Outlook:
- Key Highlights
- Historical Market Size (US$ Bn) and Volume (Units) Analysis, By Market, 2019-2023
- By Country
- By Product Type
- By Type of Care
- By End User
- Current Market Size (US$ Bn) Analysis and Forecast, By Country, 2024–2032
- Germany
- France
- U.K.
- Italy
- Spain
- Russia
- Türkiye
- Rest of Europe
- Current Market Size (US$ Bn) and Volume (Units) Analysis and Forecast, By Product Type, 2024–2032
- Incontinence Products
- Consumables
- Assistive devices
- Nutritional Supplements
- Current Market Size (US$ Bn) Analysis and Forecast, By Type of Care, 2024–2032
- Home Care
- Chronic Illness Care
- Current Market Size (US$ Bn) Analysis and Forecast, By End User, 2024–2032
- Hospitals
- Nursing Care Facilities
- Home Health Care
- Market Attractiveness Analysis
- East Asia Elder Care Products Market Outlook:
- Key Highlights
- Historical Market Size (US$ Bn) and Volume (Units) Analysis, By Market, 2019-2023
- By Country
- By Product Type
- By Type of Care
- By End User
- Current Market Size (US$ Bn) Analysis and Forecast, By Country, 2024–2032
- China
- Japan
- South Korea
- Current Market Size (US$ Bn) and Volume (Units) Analysis and Forecast, By Product Type, 2024–2032
- Incontinence Products
- Consumables
- Assistive devices
- Nutritional Supplements
- Current Market Size (US$ Bn) Analysis and Forecast, By Type of Care, 2024–2032
- Home Care
- Chronic Illness Care
- Current Market Size (US$ Bn) Analysis and Forecast, By End User, 2024–2032
- Hospitals
- Nursing Care Facilities
- Home Health Care
- Market Attractiveness Analysis
- South Asia & Oceania Elder Care Products Market Outlook:
- Key Highlights
- Historical Market Size (US$ Bn) and Volume (Units) Analysis, By Market, 2019-2023
- By Country
- By Product Type
- By Type of Care
- By End User
- Current Market Size (US$ Bn) Analysis and Forecast, By Country, 2024–2032
- India
- Southeast Asia
- ANZ
- Rest of South Asia & Oceania
- Current Market Size (US$ Bn) and Volume (Units) Analysis and Forecast, By Product Type, 2024–2032
- Incontinence Products
- Consumables
- Assistive devices
- Nutritional Supplements
- Current Market Size (US$ Bn) Analysis and Forecast, By Type of Care, 2024–2032
- Home Care
- Chronic Illness Care
- Current Market Size (US$ Bn) Analysis and Forecast, By End User, 2024–2032
- Hospitals
- Nursing Care Facilities
- Home Health Care
- Market Attractiveness Analysis
- Latin America Elder Care Products Market Outlook:
- Key Highlights
- Historical Market Size (US$ Bn) and Volume (Units) Analysis, By Market, 2019-2023
- By Country
- By Product Type
- By Type of Care
- By End User
- Current Market Size (US$ Bn) Analysis and Forecast, By Country, 2024–2032
- Brazil
- Mexico
- Rest of Latin America
- Current Market Size (US$ Bn) and Volume (Units) Analysis and Forecast, By Product Type, 2024–2032
- Incontinence Products
- Consumables
- Assistive devices
- Nutritional Supplements
- Current Market Size (US$ Bn) Analysis and Forecast, By Type of Care, 2024–2032
- Home Care
- Chronic Illness Care
- Current Market Size (US$ Bn) Analysis and Forecast, By End User, 2024–2032
- Hospitals
- Nursing Care Facilities
- Home Health Care
- Market Attractiveness Analysis
- Middle East & Africa Elder Care Products Market Outlook:
- Key Highlights
- Historical Market Size (US$ Bn) and Volume (Units) Analysis, By Market, 2019-2023
- By Country
- By Product Type
- By Type of Care
- By End User
- Current Market Size (US$ Bn) Analysis and Forecast, By Country, 2024–2032
- GCC Countries
- Egypt
- South Africa
- Northern Africa
- Rest of Middle East & Africa
- Current Market Size (US$ Bn) and Volume (Units) Analysis and Forecast, By Product Type, 2024–2032
- Incontinence Products
- Consumables
- Assistive devices
- Nutritional Supplements
- Current Market Size (US$ Bn) Analysis and Forecast, By Type of Care, 2024–2032
- Home Care
- Chronic Illness Care
- Current Market Size (US$ Bn) Analysis and Forecast, By End User, 2024–2032
- Hospitals
- Nursing Care Facilities
- Home Health Care
- Market Attractiveness Analysis
- Competition Landscape
- Market Share Analysis, 2024
- Market Structure
- Competition Intensity Mapping By Market
- Competition Dashboard
- Company Profiles (Details – Overview, Financials, Strategy, Recent Developments)
- Thermo Fisher Scientific Inc.
- Overview
- Segments and Product Types
- Key Financials
- Market Developments
- Market Strategy
- Invacare Corporation
- Cardinal Health
- Abbott Laboratories
- 3M company
- B Braun Melsungen AG
- GlaxoSmithKline Limited.
- Bayer AG
- Procter & Gamble
- Stryker Corp
- Koninklijke Philips N.V.
- GE Healthcare (General Electric)
- Mölnlycke Health Care AB
- The Golden Concepts
- Amway Enterprises
- Smiths Group PLC
- Honeywell International Inc.
- McKesson Corporation
- Kimberly-Clark Corporation
- Unicharm
- Thermo Fisher Scientific Inc.
- Appendix
- Research Methodology
- Research Assumptions
- Acronyms and Abbreviations


- Healthcare Services
- Elder Care Products Market
Elder Care Products Market Size, Share, and Growth Forecast for 2025 - 2032
Elder Care Products Market by Product Type (Incontinence Products, Consumables, Assistive devices, Nutritional Supplements), Type of Care (Home Care, Chronic Illness Care), End User (Hospitals, Nursing Care Facilities, Home Health Care) and Regional Analysis
Elder Care Products Market Outlook (2025-2032)
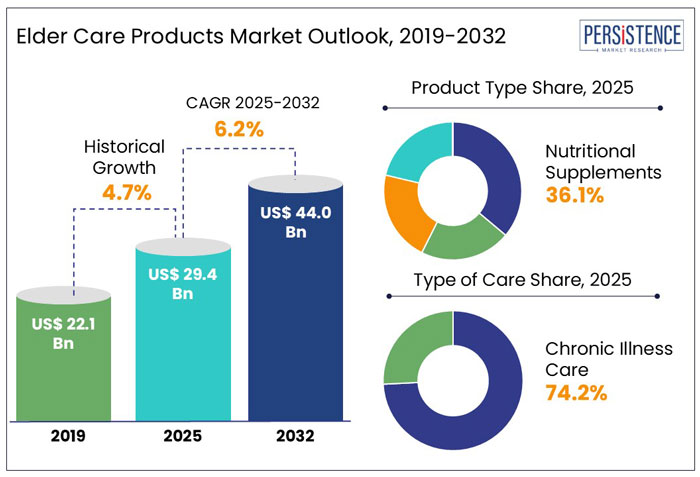
The global elder care products market is set to reach a valuation of US$ 29.4 Bn at the end of 2025. With the market projected to expand at a healthy 6.2% CAGR, global industry valuation is set to reach US$ 45.0 Bn by the end of 2032.
The elder care products market is experiencing significant expansion, driven by aging populations, rising chronic diseases, and increased demand for home healthcare solutions. Innovations in mobility aids, smart monitoring devices, and assistive technologies enhance elderly independence. Government initiatives and improved healthcare infrastructure further support market development across various regions.
|
Attribute |
Key Insights |
|
Elder Care Products Market Size (2025) |
US$ 29.4 Bn |
|
Market Value Forecast (2032F) |
US$ 45.0 Bn |
|
Projected Growth (CAGR 2025-2032) |
6.2% |
|
Historical Market Growth (CAGR 2019 to 2024) |
4.7% |
Sales Analysis of Elder Care Products (2019to 2024) Vs. Market Outlook (2025 to 2032)
The Elder Care Products Market expanded consistently, driven by an aging global population and rising demand for specialized healthcare solutions. From 2019 to 2024, the market recorded a CAGR of 4.7%, supported by advancements in assistive devices, home healthcare products, and mobility aids. Increasing cases of chronic diseases and a growing focus on independent living solutions further contributed to market development during this period.
From 2025 to 2032, the market is projected to grow at a CAGR of 6.2%, driven by technological advancements, higher healthcare spending, and a rising preference for aging-in-place solutions. Demand for smart elder care devices, such as AI-powered monitoring systems and wearable health trackers, is expected to increase. Additionally, supportive government policies and the expansion of home-based care services will contribute to market progression.
The adoption of digital health solutions, along with improvements in robotics and automation, will influence future market trends. Increasing investments in elderly care infrastructure and innovations in mobility aids, hygiene products, and chronic disease management solutions will play a crucial role in sustaining long-term growth.
What Opportunities Lie Ahead for Elder Care Product Manufacturers?
“Initiatives by Governments & NGOs Regarding Elderly Care to Assist Market Growth”
Growing government investments in healthcare infrastructure, quality-driven manufacturing, and technology adoption are significantly enhancing the elder care products market. The World Health Organization (WHO) launched the Decade of Healthy Ageing (2021–2030) to improve healthcare access and quality for seniors, promoting age-friendly environments and integrated care services (WHO).
The healthcare industry experienced steady growth, with government funding playing a crucial role in increasing efficiency, quality, and accessibility. Investments in healthcare facilities are expected to drive the elder care products market over the next decade. Countries like China introduced national plans for dementia care, aiming to establish a comprehensive prevention and control system by 2030.
Governments worldwide are formalizing national health plans focusing on self-care education, risk awareness, and improved living conditions for seniors. NGOs and private entities, such as the Worldwide Hospice Palliative Care Alliance (WHPCA), are actively mobilizing to provide secure health management for the elderly (WHPCA). These initiatives create opportunities for market players to expand their offerings.
How are Sales of Elder Care Products Being Adversely Affected?
“Dearth of Skilled Elderly Care Providers and High Costs of Products”
The dearth of qualified professionals for elderly care is a major restraining factor for the growth of the market. These professionals are offered low wages and face difficult working conditions, with limited recognition, leading to a shortage of good caregivers. To reduce employee shortage, it is essential to improve caregivers’ income, working conditions, and social recognition.
Additionally, it is important to establish a formal caregiver training system, including the development of compressive nursing and medical care for older persons. It has been found in several studies that professional care staff provide proper care according to the required standards but often lack training for acute care settings.
- In terms of health workforce statistics, it is estimated that by 2026, Thailand will have enough healthcare workers to meet demand in most professions, although there will be a shortage of roughly 47,000 nurses. Thailand has limited qualified professionals owing to financial constraints, unattractive career development, and the availability of various alternative jobs.
The high cost associated with products such as assistive devices is another restraining factor for market growth. Overall, the high cost of several elder care devices and equipment, from hospitalization to post-discharge care, is expected to dent the growth of the elder care products market to some extent, which is a limitation that is dominant in most emerging regions.
Region-wise Insights
What Makes North America the Largest Market for Elder Care Products?
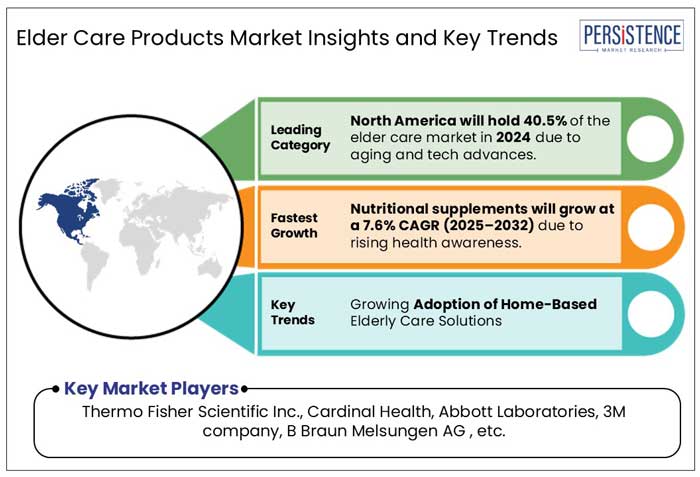
The North America elder care products market dominated the global market with a share of around 40.5% at the end of 2024 and is expected to exhibit high growth going forward as well.
Home-based healthcare facilities are becoming imperative in the U.S, driven by the need for better post-operative care and primary care. Patients who are suffering from chronic illnesses, such as respiratory failure, heart failure, and Alzheimer’s, need continuous care that can be managed at home.
The burden of chronic diseases is growing rapidly in the U.S., with approximately 4.5 million aging individuals suffering from chronic diseases. This makes the U.S. a huge market for elder care as well as elder care products & services.
Why is Europe a Lucrative Market for Elder Care Product Manufacturers?
The Europe market for elder care products accounted for around 30.2%in the global market at the end of 2024.
Leading elder care product manufacturers in the U.K. are developing innovative products as a priority. The current trend in the U.K is using technology and monitoring systems for elderly care. Adoption of incontinence and ostomy products help patients lead better lives.
Technologically advanced products help the elderly population overcome their disabilities and age-related problems. Increased innovation in healthcare has led to the rising adoption of innovative medical devices. This is also helping the elder care products market expand in terms of revenue, in the United Kingdom.
Will the Emerging Elder Care Products Market in Asia Pacific Be Profitable for Market Participants?
Asia Pacific held 21.6% share in the global elder care products market in 2024, which is projected to increase over the decade.
The emerging elder care products market in Asia Pacific presents significant profitability opportunities for market participants. Rapid aging populations in China, Japan, and India are driving demand for elder care products, supported by government initiatives like China’s national dementia plan and India’s SAGE project (Reuters, PIB India).
Increased healthcare investments, rising disposable incomes, and greater awareness of elderly well-being further fuel market growth. These factors position Asia Pacific as a lucrative region for companies to expand their elder care product offerings.
Category-wise Insights
Nutritional supplements accounted for a revenue share of 36.1% in 2024. For most disorders, nutritional supplements are the first medications that are provided to elderly patients. Dysphagia is a serious issue in the elderly population, and the usage of thickening agents has driven the sales of nutritional supplements in elder care.
Furthermore, manufacturers are attempting to meet the growing need for vitamins with powerful elder care goods to drive market growth, especially in developed countries.
Which Type of Elder Care Holds a Significant Share in the Market?
By Type of Care, Chronic Illness Care dominated the global elder care products market, holding a market share of 74.2% in 2024.
Increasing incidence of chronic illnesses in the geriatric population group, rising prevalence of dysphagia, surge in investments in elder care facilities, growing R&D activities in elder care products, and increasing awareness programs, are all factors, wherein, the care for these aspects is covered under the chronic illness segment.
Competitive Landscape
Key suppliers of elder care products are mainly focused on advancing their product offerings through new product launches, renewal of old patented products, and the development of upgraded product lines, to expand their market pipeline, improve accessibility, and gain a high market position globally.
Leading manufacturers such as Thermo Fisher Scientific Inc, Invacare Corporation, and 3M Company are constantly launching new elder care products and are also pursuing collaborations to improve their manufacturing methods.
For example-
- In April 2024, At Home Eldercare, a prominent provider of non-medical senior care, merged with Loyalty Brands. This collaboration combines At Home Eldercare’s 20+ years of industry experience with Loyalty Brands’ 30+ years of franchising expertise, positioning them as a major force in the senior care market.
- In Oct 2023, Age Care Labs, a dedicated elder care platform, secured $11 million in a pre-Series B funding round. The investment was led by Rainmatter Capital, the investment arm of Zerodha, alongside Gruhas, a venture capital fund co-founded by Nikhil Kamath and Abhijeet Pai. Additional backing came from notable investors, including Alok Oberoi, Ajay Srinivasan, and existing investor Lumis Partners.
- In February 2022, HMP Global acquired the Senior Care Marketing & Sales Summit (SMASH) from Senior Care Events. This acquisition resulted in the creation of a dedicated senior care division within HMP Global, further strengthening its presence in the senior care industry.
Companies Covered in Elder Care Products Market
- Thermo Fisher Scientific Inc.
- Invacare Corporation
- Cardinal Health
- Abbott Laboratories
- 3M company
- B Braun Melsungen AG
- GlaxoSmithKline Limited.
- Bayer AG
- Procter & Gamble
- Stryker Corp
- Koninklijke Philips N.V.
- GE Healthcare (General Electric)
- Mölnlycke Health Care AB
- The Golden Concepts
- Amway Enterprises
- Smiths Group PLC
- Honeywell International Inc.
- McKesson Corporation
- Kimberly-Clark Corporation
- Unicharm
Frequently Asked Questions
The global market is estimated to increase from US$ 29.4 Bn in 2025 to US$ 45.0 Bn in 2032.
The global market is driven by rising geriatric populations, increasing chronic diseases, advancements in healthcare technology, growing home care demand, and supportive government policies promoting elderly well-being and independence.
The market is projected to record a CAGR of 6.2% during the forecast period from 2025 to 2032.
Thermo Fisher Scientific Inc., Invacare Corporation, Cardinal Health, Abbott Laboratories, 3M Company among others, are the key players within this market.
By product, nutritional supplements are expected to grow at a CAGR of 7.6% from 2025 to 2032.


