


- Executive Summary
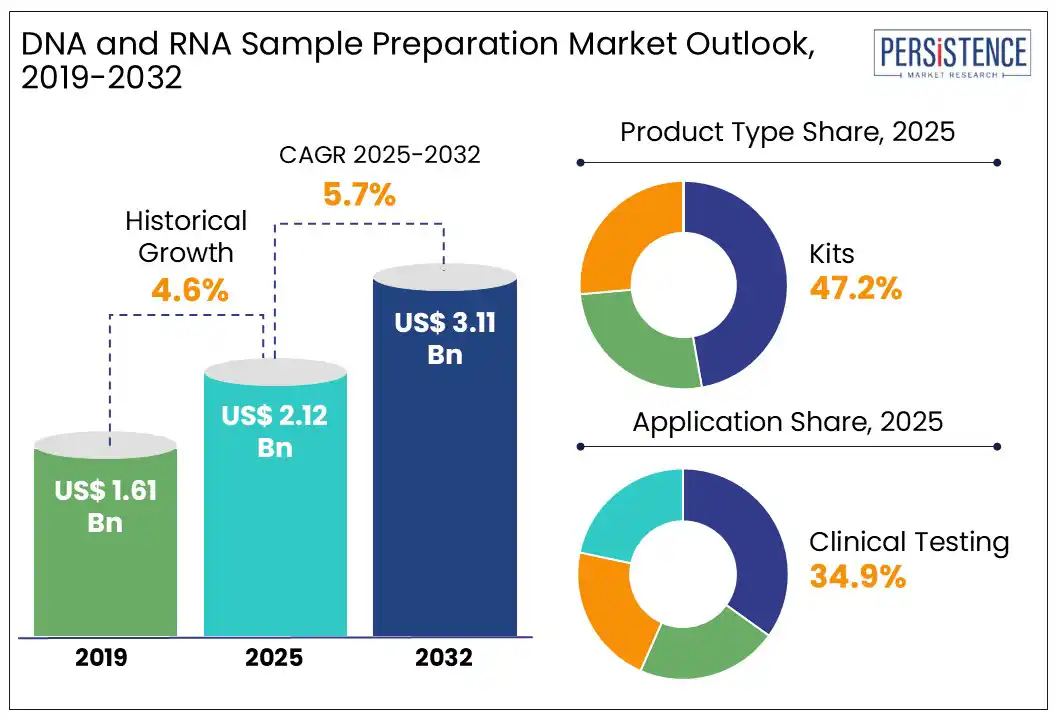
- Global DNA and RNA Sample Preparation Market Outlook
- Market DNA and RNA Sample Preparation Market Outlook: Services
- Introduction/Key Findings
- Historical Market Size (US$ Bn) and Analysis, By Services, 2019 - 2024
- Current Market Size (US$ Bn) and Analysis and Forecast, By Services, 2025 - 2032
- Future Market Projections
- Premium Market Insights
- Industry Developments and Key Market Events
- PMR Analysis and Recommendations
- Market Overview
- Market Scope and Definition
- Market Dynamics
- Drivers
- Restraints
- Opportunity
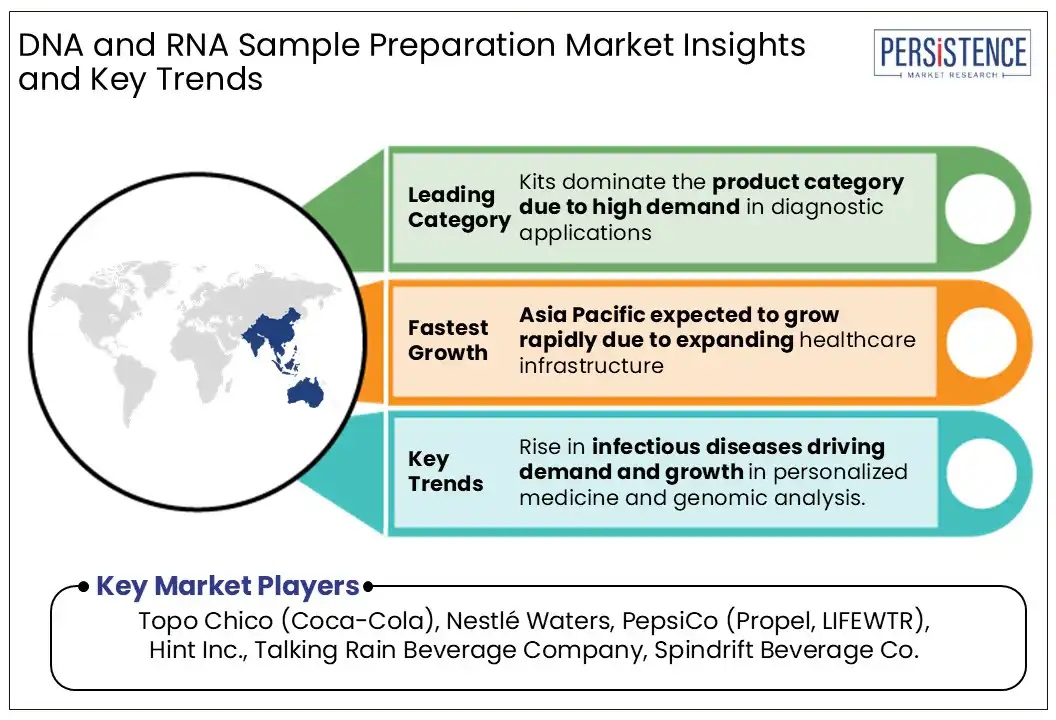
- Key Trends
- Macro-Economic Factors
- Global Sectorial Outlook
- Global GDP Growth Outlook
- COVID-19 Impact Analysis
- Forecast Factors - Relevance and Impact
- Value Added Insights
- Product Adoption Analysis
- Regulatory Landscape
- Value Chain Analysis
- PESTLE Analysis
- Porter’s Five Force Analysis
- Global DNA and RNA Sample Preparation Market Outlook
- Key Highlights
- Market Size (US$ Bn) and Y-o-Y Growth
- Absolute $ Opportunity
- Market Size (US$ Bn) Analysis and Forecast
- Historical Market Size (US$ Bn) Analysis, 2019-2024
- Current Market Size (US$ Bn) Analysis and Forecast, 2025 - 2032
- Global DNA and RNA Sample Preparation Market Outlook: Product
- Introduction / Key Findings
- Historical Market Size (US$ Bn) Analysis, By Product, 2019 - 2024
- Current Market Size (US$ Bn) Analysis and Forecast, By Product, 2025 - 2032
- Workstations
- Kits
- DNA Sample Preparation
- RNA Sample Preparation
- Reagent and Consumables
- Market Attractiveness Analysis: Product
- Global DNA and RNA Sample Preparation Market Outlook: Application
- Introduction / Key Findings
- Historical Market Size (US$ Bn), By Application, 2019 - 2024
- Current Market Size (US$ Bn) Analysis and Forecast, By Application, 2025 - 2032
- Clinical Testing
- Diagnostic Testing
- Research Application
- Others
- Market Attractiveness Analysis: Application
- Global DNA and RNA Sample Preparation Market Outlook: End User
- Introduction / Key Findings
- Historical Market Size (US$ Bn) Analysis, By End User, 2019 - 2024
- Current Market Size (US$ Bn) Analysis and Forecast, By End User, 2025 - 2032
- Hospitals
- Diagnostic Centers
- Forensic Science Laboratories
- Academic & Research Institutions
- Others
- Market Attractiveness Analysis: End User
- Key Highlights
- Global DNA and RNA Sample Preparation Market Outlook: Region
- Key Highlights
- Historical Market Size (US$ Bn) Analysis, By Region, 2019 - 2024
- Current Market Size (US$ Bn) Analysis and Forecast, By Region, 2025 - 2032
- North America
- Europe
- East Asia
- South Asia and Oceania
- Latin America
- Middle East & Africa
- Market Attractiveness Analysis: Region
- North America DNA and RNA Sample Preparation Market Outlook
- Key Highlights
- Historical Market Size (US$ Bn) Analysis, By Market, 2019 - 2024
- By Country
- By Product
- By Application
- By End User
- Current Market Size (US$ Bn) Analysis and Forecast, By Country, 2025 - 2032
- U.S.
- Canada
- Current Market Size (US$ Bn) Analysis and Forecast, By Product, 2025 - 2032
- Workstations
- Kits
- DNA Sample Preparation
- RNA Sample Preparation
- Reagent and Consumables
- Current Market Size (US$ Bn) Analysis and Forecast, By Application, 2025 - 2032
- Clinical Testing
- Diagnostic Testing
- Research Application
- Others
- Current Market Size (US$ Bn) Analysis and Forecast, By End User, 2025 - 2032
- Hospitals
- Diagnostic Centers
- Forensic Science Laboratories
- Academic & Research Institutions
- Others
- Market Attractiveness Analysis
- Europe DNA and RNA Sample Preparation Market Outlook
- Key Highlights
- Historical Market Size (US$ Bn) Analysis, By Market, 2019 - 2024
- By Country
- By Product
- By Application
- By End User
- Current Market Size (US$ Bn) Analysis and Forecast, By Country, 2025 - 2032
- Germany
- France
- U.K.
- Italy
- Spain
- Russia
- Türkiye
- Rest of Europe
- Current Market Size (US$ Bn) Analysis and Forecast, By Product, 2025 - 2032
- Workstations
- Kits
- DNA Sample Preparation
- RNA Sample Preparation
- Reagent and Consumables
- Current Market Size (US$ Bn) Analysis and Forecast, By Application, 2025 - 2032
- Clinical Testing
- Diagnostic Testing
- Research Application
- Others
- Current Market Size (US$ Bn) Analysis and Forecast, By End User, 2025 - 2032
- Hospitals
- Diagnostic Centers
- Forensic Science Laboratories
- Academic & Research Institutions
- Others
- Market Attractiveness Analysis
- East Asia DNA and RNA Sample Preparation Market Outlook
- Key Highlights
- Historical Market Size (US$ Bn) Analysis, By Market, 2019 - 2024
- By Country
- By Product
- By Application
- By End User
- Current Market Size (US$ Bn) Analysis and Forecast, By Country, 2025 - 2032
- China
- Japan
- South Korea
- Current Market Size (US$ Bn) Analysis and Forecast, By Product, 2025 - 2032
- Workstations
- Kits
- DNA Sample Preparation
- RNA Sample Preparation
- Reagent and Consumables
- Current Market Size (US$ Bn) Analysis and Forecast, By Application, 2025 - 2032
- Clinical Testing
- Diagnostic Testing
- Research Application
- Others
- Current Market Size (US$ Bn) Analysis and Forecast, By End User, 2025 - 2032
- Hospitals
- Diagnostic Centers
- Forensic Science Laboratories
- Academic & Research Institutions
- Others
- Market Attractiveness Analysis
- South Asia & Oceania DNA and RNA Sample Preparation Market Outlook
- Key Highlights
- Historical Market Size (US$ Bn) Analysis, By Market, 2019 - 2024
- By Country
- By Product
- By Application
- By End User
- Current Market Size (US$ Bn) Analysis and Forecast, By Country, 2025 - 2032
- India
- Southeast Asia
- ANZ
- Rest of South Asia & Oceania
- Current Market Size (US$ Bn) Analysis and Forecast, By Product, 2025 - 2032
- Workstations
- Kits
- DNA Sample Preparation
- RNA Sample Preparation
- Reagent and Consumables
- Current Market Size (US$ Bn) Analysis and Forecast, By Application, 2025 - 2032
- Clinical Testing
- Diagnostic Testing
- Research Application
- Others
- Current Market Size (US$ Bn) Analysis and Forecast, By End User, 2025 - 2032
- Hospitals
- Diagnostic Centers
- Forensic Science Laboratories
- Academic & Research Institutions
- Others
- Market Attractiveness Analysis
- Latin America DNA and RNA Sample Preparation Market Outlook
- Key Highlights
- Historical Market Size (US$ Bn) Analysis, By Market, 2019 - 2024
- By Country
- By Product
- By Application
- By End User
- Current Market Size (US$ Bn) Analysis and Forecast, By Country, 2025 - 2032
- Brazil
- Mexico
- Rest of Latin America
- Current Market Size (US$ Bn) Analysis and Forecast, By Product, 2025 - 2032
- Workstations
- Kits
- DNA Sample Preparation
- RNA Sample Preparation
- Reagent and Consumables
- Current Market Size (US$ Bn) Analysis and Forecast, By Application, 2025 - 2032
- Clinical Testing
- Diagnostic Testing
- Research Application
- Others
- Current Market Size (US$ Bn) Analysis and Forecast, By End User, 2025 - 2032
- Hospitals
- Diagnostic Centers
- Forensic Science Laboratories
- Academic & Research Institutions
- Others
- Market Attractiveness Analysis
- Middle East & Africa DNA and RNA Sample Preparation Market Outlook
- Key Highlights
- Historical Market Size (US$ Bn) Analysis, By Market, 2019 - 2024
- By Country
- By Product
- By Application
- By End User
- Current Market Size (US$ Bn) Analysis and Forecast, By Country, 2025 - 2032
- GCC Countries
- Egypt
- South Africa
- Northern Africa
- Rest of Middle East & Africa
- Current Market Size (US$ Bn) Analysis and Forecast, By Product, 2025 - 2032
- Workstations
- Kits
- DNA Sample Preparation
- RNA Sample Preparation
- Reagent and Consumables
- Current Market Size (US$ Bn) Analysis and Forecast, By Application, 2025 - 2032
- Clinical Testing
- Diagnostic Testing
- Research Application
- Others
- Current Market Size (US$ Bn) Analysis and Forecast, By End User, 2025 - 2032
- Hospitals
- Diagnostic Centers
- Forensic Science Laboratories
- Academic & Research Institutions
- Others
- Market Attractiveness Analysis
- Competition Landscape
- Market Share Analysis, 2025
- Market Structure
- Competition Intensity Mapping By Market
- Competition Dashboard
- Company Profiles (Details - Overview, Financials, Strategy, Recent Developments)
- Thermo Fisher Scientific Inc.
- Overview
- Segments and Products
- Key Financials
- Market Developments
- Market Strategy
- Isogen Lifescience B.V.
- MP Biomedicals
- Minerva Biolabs GmbH
- QIAGEN
- Bio-Rad Laboratories, Inc
- Merck KGaA
- Agilent Technologies, Inc.
- c-LEcta GmbH
- Beckman Coulter, Inc.
- Bioresearch Technologies
- Promega Corporation
- Illumina, Inc.
- Aurora Biomed Inc.
- Hygiena LLC
- Tecan Trading AG
- MACHEREY-NAGEL GmbH & Co. KG
- Ahlstrom
- Nanodigmbio (Nanjing) Biotechnology Co., Ltd.
- Bionano Genomics, Inc.
- Revvity
- F. Hoffmann-La Roche Ltd
- New England Biolabs
- Thermo Fisher Scientific Inc.
- Appendix
- Research Methodology
- Research Assumptions
- Acronyms and Abbreviations

Loading page data
Please wait a moment


