

- Executive Summary
- Global Dental Preventive Supplies Market Snapshot 2026 and 2033
- Market Opportunity Assessment, 2026-2033, US$ Bn
- Key Market Trends
- Industry Developments and Key Market Events
- Demand Side and Supply-Side Analysis
- PMR Analysis and Recommendations
- Market Overview
- Market Scope and Definitions
- Market Dynamics
- Driver
- Restraint
- Opportunities
- Trends
- Macro-Economic Factors
- Global GDP Outlook
- Global Prison Growth Outlook
- Global Prison Population by Country
- Global Private Prison Market Growth Outlook
- Forecast Factors – Relevance and Impact
- COVID-19 Impact Assessment
- Value Added Insights
- Value Chain analysis
- Key Market Players
- Product Adoption Analysis
- Key Promotional Strategies by key players
- PESTLE Analysis
- Porter's Five Forces Analysis
- Regulatory and Technology Landscape
- Global Dental Preventive Supplies Market Outlook: Historical (2020 – 2025) and Forecast (2026 – 2033)
- Key Highlights
- Global Dental Preventive Supplies Market Outlook: Product Type
- Introduction/Key Findings
- Historical Market Size (US$ Bn) Analysis by Product Type, 2020-2025
- Current Market Size (US$ Bn) Forecast, by Product Type, 2026-2033
- Sealants & Fluorides
- Prophylaxis
- Pastes
- Cups
- Brushes
- Disposables
- Barriers
- Tips
- PPE
- Others
- Market Attractiveness Analysis: Product Type
- Global Dental Preventive Supplies Market Outlook: Distribution Channel
- Introduction/Key Findings
- Historical Market Size (US$ Bn) Analysis by Distribution Channel, 2020-2025
- Current Market Size (US$ Bn) Forecast, by Distribution Channel, 2026-2033
- Distributor
- Direct/Online
- Others
- Market Attractiveness Analysis: Distribution Channel
- Global Dental Preventive Supplies Market Outlook: End User
- Introduction/Key Findings
- Historical Market Size (US$ Bn) Analysis by End User, 2020-2025
- Current Market Size (US$ Bn) Forecast, by End User, 2026-2033
- Dental Clinics
- Hospitals
- Academic & Others
- Others
- Market Attractiveness Analysis: End User
- Global Dental Preventive Supplies Market Outlook: Region
- Key Highlights
- Historical Market Size (US$ Bn) Analysis by Region, 2020-2025
- Current Market Size (US$ Bn) Forecast, by Region, 2026-2033
- North America
- Europe
- East Asia
- South Asia & Oceania
- Latin America
- Middle East & Africa
- Market Attractiveness Analysis: Region
- North America Dental Preventive Supplies Market Outlook: Historical (2020 – 2025) and Forecast (2026 – 2033)
- Key Highlights
- North America Market Size (US$ Bn) Forecast, by Country, 2026-2033
- U.S.
- Canada
- North America Market Size (US$ Bn) Forecast, by Product Type, 2026-2033
- Sealants & Fluorides
- Prophylaxis
- Pastes
- Cups
- Brushes
- Disposables
- Barriers
- Tips
- PPE
- Others
- North America Market Size (US$ Bn) Forecast, by Distribution Channel, 2026-2033
- Distributor
- Direct/Online
- Others
- North America Market Size (US$ Bn) Forecast, by End User, 2026-2033
- Dental Clinics
- Hospitals
- Academic & Others
- Others
- Europe Dental Preventive Supplies Market Outlook: Historical (2020 – 2025) and Forecast (2026 – 2033)
- Key Highlights
- Europe Market Size (US$ Bn) Forecast, by Country, 2026-2033
- Germany
- Italy
- France
- U.K.
- Spain
- Russia
- Rest of Europe
- Europe Market Size (US$ Bn) Forecast, by Product Type, 2026-2033
- Sealants & Fluorides
- Prophylaxis
- Pastes
- Cups
- Brushes
- Disposables
- Barriers
- Tips
- PPE
- Others
- Europe Market Size (US$ Bn) Forecast, by Distribution Channel, 2026-2033
- Distributor
- Direct/Online
- Others
- Europe Market Size (US$ Bn) Forecast, by End User, 2026-2033
- Dental Clinics
- Hospitals
- Academic & Others
- Others
- East Asia Dental Preventive Supplies Market Outlook: Historical (2020 – 2025) and Forecast (2026 – 2033)
- Key Highlights
- East Asia Market Size (US$ Bn) Forecast, by Country, 2026-2033
- China
- Japan
- South Korea
- East Asia Market Size (US$ Bn) Forecast, by Product Type, 2026-2033
- Sealants & Fluorides
- Prophylaxis
- Pastes
- Cups
- Brushes
- Disposables
- Barriers
- Tips
- PPE
- Others
- East Asia Market Size (US$ Bn) Forecast, by Distribution Channel, 2026-2033
- Distributor
- Direct/Online
- Others
- East Asia Market Size (US$ Bn) Forecast, by End User, 2026-2033
- Dental Clinics
- Hospitals
- Academic & Others
- Others
- South Asia & Oceania Dental Preventive Supplies Market Outlook: Historical (2020 – 2025) and Forecast (2026 – 2033)
- Key Highlights
- South Asia & Oceania Market Size (US$ Bn) Forecast, by Country, 2026-2033
- India
- Southeast Asia
- ANZ
- Rest of SAO
- South Asia & Oceania Market Size (US$ Bn) Forecast, by Product Type, 2026-2033
- Sealants & Fluorides
- Prophylaxis
- Pastes
- Cups
- Brushes
- Disposables
- Barriers
- Tips
- PPE
- Others
- South Asia & Oceania Market Size (US$ Bn) Forecast, by Distribution Channel, 2026-2033
- Distributor
- Direct/Online
- Others
- South Asia & Oceania Market Size (US$ Bn) Forecast, by End User, 2026-2033
- Dental Clinics
- Hospitals
- Academic & Others
- Others
- Latin America Dental Preventive Supplies Market Outlook: Historical (2020 – 2025) and Forecast (2026 – 2033)
- Key Highlights
- Latin America Market Size (US$ Bn) Forecast, by Country, 2026-2033
- Brazil
- Mexico
- Rest of LATAM
- Latin America Market Size (US$ Bn) Forecast, by Product Type, 2026-2033
- Sealants & Fluorides
- Prophylaxis
- Pastes
- Cups
- Brushes
- Disposables
- Barriers
- Tips
- PPE
- Others
- Latin America Market Size (US$ Bn) Forecast, by Distribution Channel, 2026-2033
- Distributor
- Direct/Online
- Others
- Latin America Market Size (US$ Bn) Forecast, by End User, 2026-2033
- Dental Clinics
- Hospitals
- Academic & Others
- Others
- Middle East & Africa Dental Preventive Supplies Market Outlook: Historical (2020 – 2025) and Forecast (2026 – 2033)
- Key Highlights
- Middle East & Africa Market Size (US$ Bn) Forecast, by Country, 2026-2033
- GCC Countries
- South Africa
- Northern Africa
- Rest of MEA
- Middle East & Africa Market Size (US$ Bn) Forecast, by Product Type, 2026-2033
- Sealants & Fluorides
- Prophylaxis
- Pastes
- Cups
- Brushes
- Disposables
- Barriers
- Tips
- PPE
- Others
- Middle East & Africa Market Size (US$ Bn) Forecast, by Distribution Channel, 2026-2033
- Distributor
- Direct/Online
- Others
- Middle East & Africa Market Size (US$ Bn) Forecast, by End User, 2026-2033
- Dental Clinics
- Hospitals
- Academic & Others
- Others
- Competition Landscape
- Market Share Analysis, 2025
- Market Structure
- Competition Intensity Mapping
- Competition Dashboard
- Company Profiles
- 3M Company
- Company Overview
- Product Portfolio/Offerings
- Key Financials
- SWOT Analysis
- Company Strategy and Key Developments
- Tepe oral hygiene products Ltd .
- Kavo Kerr Corporation
- Dentsply Sirona
- Ivoclar vivadent AG
- Preventive Technologies , Inc .
- Dental Technologies , Inc.
- Young Innovations , Inc .
- GC Corporation
- Cantel Medical
- Others
- 3M Company
- Appendix
- Research Methodology
- Research Assumptions
- Acronyms and Abbreviations


- Medical Devices
- Dental Preventive Supplies Market
Dental Preventive Supplies Market Size, Share, and Growth Forecast 2026 - 2033
Dental Preventive Supplies Market by Product Type (Sealants & Fluorides, Prophylaxis (Pastes, Cups, Brushes), Disposables (Barriers, Tips, PPE), Others), by Distribution Channel (Distributor, Direct/Online, Others), by End User, by Regional Analysis, 2026-2033
Dental Preventive Supplies Market Size and Trend Analysis
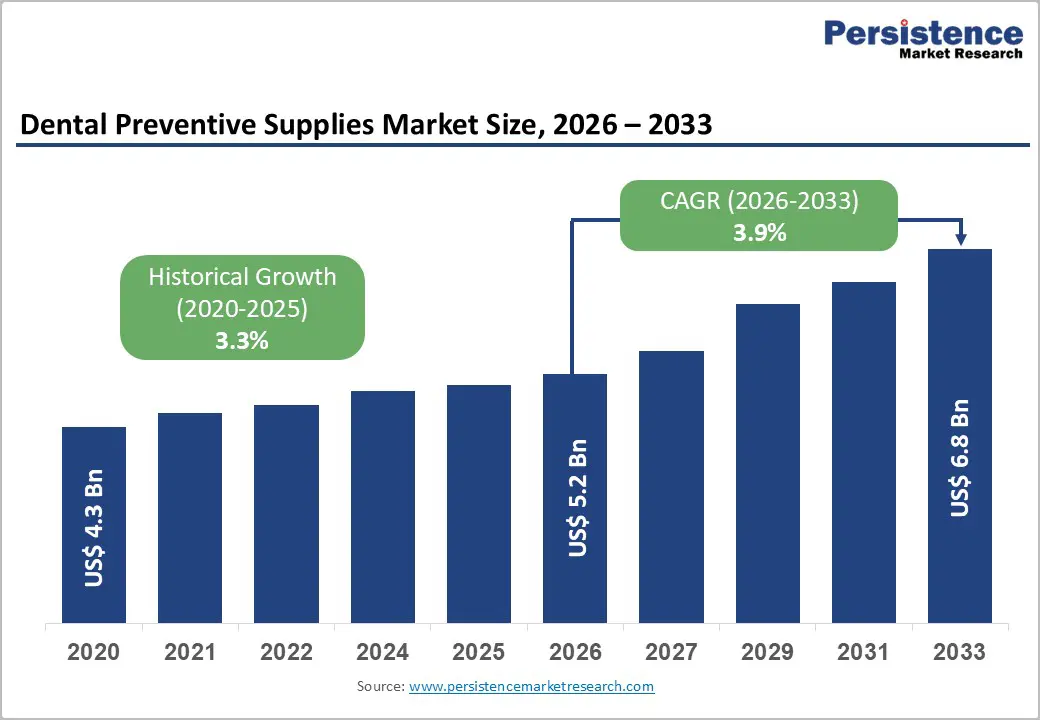
The global dental preventive supplies market size is expected to be valued at US$ 5.2 billion in 2026 and projected to reach US$ 6.8 billion by 2033, growing at a CAGR of 3.9% between 2026 and 2033.
The dental preventive supplies market focuses on products designed to prevent oral diseases and maintain long-term dental health, including sealants, fluorides, prophylaxis products, and disposables. Rising prevalence of dental caries and periodontal diseases, along with increasing awareness of preventive oral care, is driving market growth. Preventive dentistry is increasingly prioritized to reduce treatment costs and improve patient outcomes.
Key market trends include growing adoption of sealants and fluoride treatments, increased use of disposable products for infection control, and expanding preventive care programs in emerging economies. Technological advancements and rising dental visits continue to support steady market expansion globally.
Key Market highlights
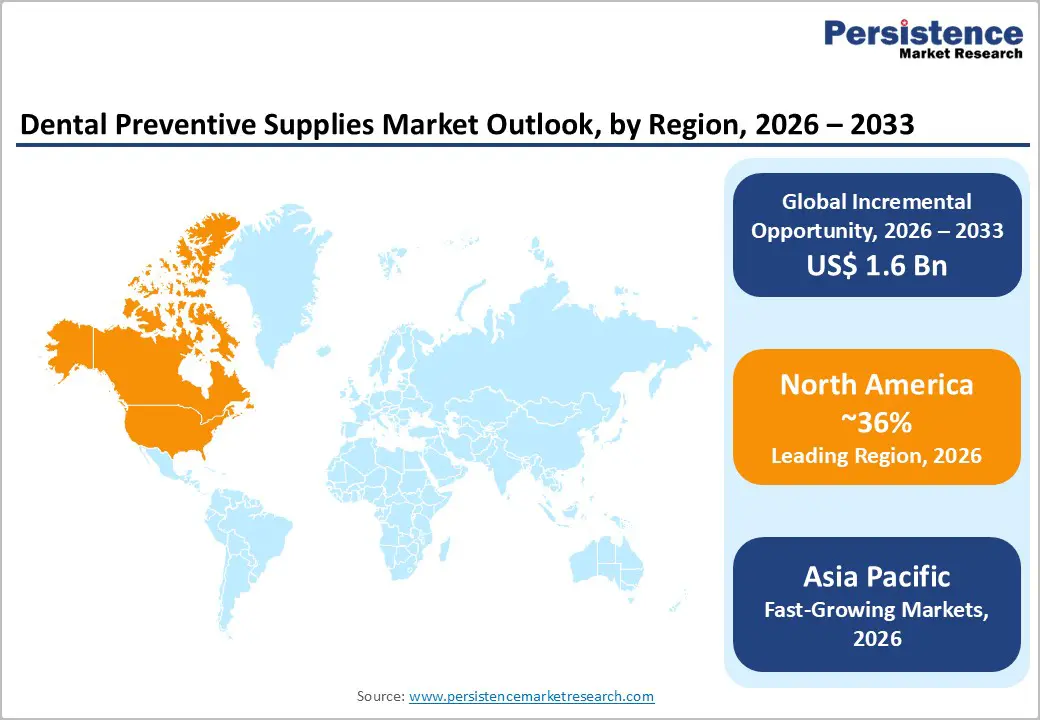
- Leading Region: North America leads with ~36% share, supported by high oral care awareness, advanced dental infrastructure, and preventive dentistry adoption.
- Fastest Growing Region: Asia Pacific is the fastest-growing region, driven by rising dental visits, expanding clinic networks, and improving oral health awareness.
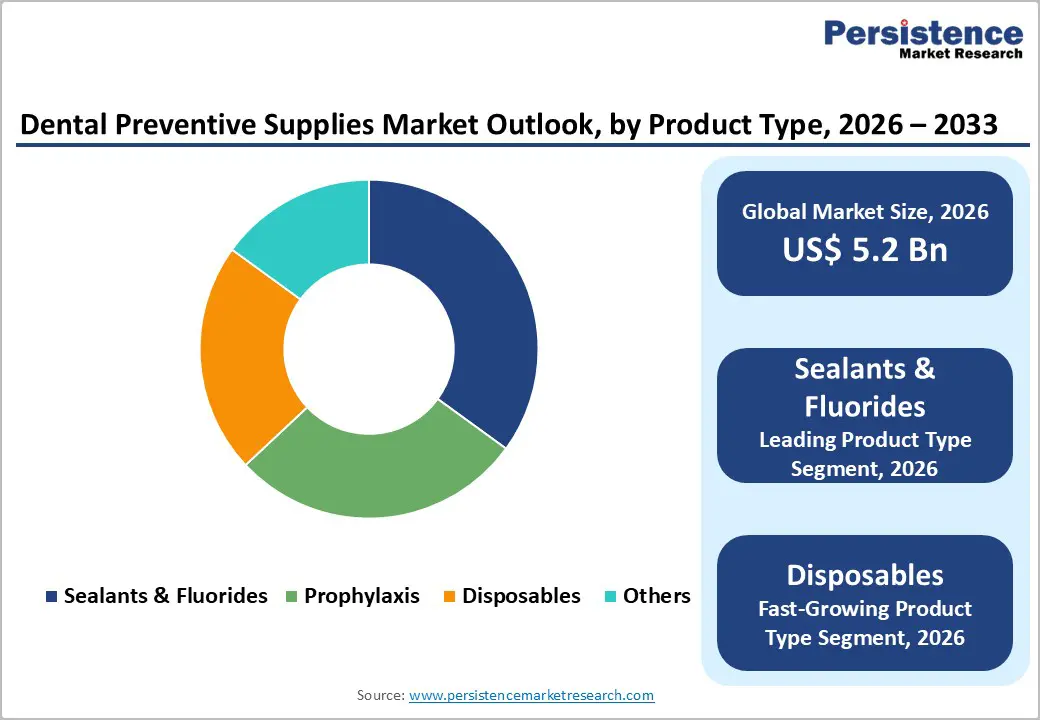
- Dominant Segment: Sealants & fluorides dominate with ~35% share, owing to strong effectiveness in caries prevention across pediatric and adult populations.
- Fastest Growing Segment: Disposables are the fastest-growing segment, supported by strict infection control norms, hygiene focus, and increased single-use adoption in dental practices.
| Report Attribute | Details |
|---|---|
|
Dental Preventive Supplies Market Size (2026E) |
US$ 5.2 billion |
|
Market Value Forecast (2033F) |
US$ 6.8 billion |
|
Projected Growth CAGR (2026-2033) |
3.9% |
|
Historical Market Growth (2020-2025) |
3.3% |
Market Dynamics
Driver- Focus on Prevention of Oral Diseases
Focus on the prevention of oral diseases has become a priority throughout the world. Advanced research and increased knowledge about the oral diseases are the major factors responsible for an increase in the growth of dental Preventive supplies market.
There are various activities and programs related to oral hygiene which reduces the oral disease burden and in turn , increases the demand of oral preventive products driving the market of dental preventive supplies in the forecast period .
Increase in the number of dental clinics in developed countries and the growth of dental clinics play a significant role in the growth of dental preventive supplies market. A significant increase in the prevalence of dental caries mainly due to unhealthy lifestyle, smoking, and excessive consumption of alcohol among the young populations increases the demand of dental products.
There is also an increase in the adoption of various prevention products through increased awareness regarding the oral disease. These factors which will further increase the demand for dental preventive supplies market in the forecast period.
Restraint- Reimbursement Challenges
Reimbursement limitations represent a key restraint for the dental preventive supplies market, particularly in cost-sensitive and developing regions. In many countries, preventive dental procedures such as fluoride applications, sealants, and routine prophylaxis are either partially reimbursed or not covered at all under public or private insurance plans. This lack of comprehensive coverage often shifts the financial burden to patients, discouraging regular preventive visits and reducing demand for preventive supplies. Even in developed markets, reimbursement policies frequently prioritize curative treatments over preventive care, limiting adoption despite strong clinical benefits.
Additionally, reimbursement rates for preventive dental services are often low, impacting the willingness of dental clinics to invest in advanced or premium preventive products. Variations in insurance coverage across regions further create inconsistencies in product utilization. Smaller clinics and rural practices are particularly affected, as limited reimbursement restricts purchasing power. These financial constraints slow the uptake of preventive dental supplies and may hinder market growth, despite increasing awareness of the long-term cost savings associated with preventive oral healthcare.
Opportunity- Rising Demand for Preventive Dental Care Products
Increase in the prevalence of dental decay and increase in the populations will increase the usage of preventive care products which drive the market of dental preventive supplies in future.
Wide use of fluoride gels and sealants especially in the younger population for the prevention of dental caries further increases the demand of preventive dental products such as fluoride gels, antimicrobial varnish, sealants, mouth gel etc. which can drive the market of dental preventive supplies in the forecast period.
The development of various new products and innovation in the already existing dental care products will further spur the market of dental preventive supplies market.
Apart from these factors, an increase in the spending on dental care and growing disposal income further increased demand of dental preventive supplies in the developing countries which drive the market of dental preventive supplies market soon.
Category-wise Insights
Product Type Analysis
Sealants and fluorides dominate the dental preventive supplies market, accounting for the largest share due to their proven effectiveness in preventing dental caries and strengthening enamel. These products are widely used in routine preventive dentistry for both pediatric and adult populations. Sealants are extensively applied to occlusal surfaces to protect teeth from decay, while fluoride varnishes and gels are routinely recommended to reduce cavity risk and enhance remineralization. Growing awareness of preventive oral care and strong recommendations from dental associations further support the widespread adoption of this segment.
Disposables represent the fastest-growing product type, driven by increasing emphasis on hygiene, infection control, and patient safety in dental practices. Single-use items such as barriers, applicators, suction tips, and protective accessories are increasingly preferred to minimize cross-contamination. Post-pandemic infection control protocols and stricter regulatory guidelines have accelerated the shift toward disposable preventive supplies, supporting rapid growth of this segment globally.
End Use Analysis
Dental clinics constitute the largest end-user segment in the dental preventive supplies market, owing to the high volume of routine check-ups, cleanings, and preventive procedures performed in these settings. Clinics serve as the primary point of care for preventive dentistry, including sealant application, fluoride treatments, and prophylaxis procedures. The increasing number of private dental practices, along with growing patient preference for regular preventive visits, continues to drive strong demand from this segment.
Hospitals and specialty dental centers also contribute significantly to market growth, particularly for advanced preventive care and pediatric dentistry. These facilities often manage higher patient loads and complex cases, requiring consistent use of preventive supplies. Additionally, rising dental tourism, expansion of multi-specialty hospitals, and integration of dental departments within healthcare facilities are supporting end-user diversification. Overall, expanding access to dental care and a preventive-focused treatment approach are sustaining demand across all end-user segments.
Regional Insights
North America Dental Preventive Supplies Market Trends and Insights
North America dominates the global dental preventive supplies market, driven primarily by high dental care awareness, advanced healthcare infrastructure, and significant investments in oral health. The U.S. accounts for the largest share, supported by widespread use of sealants, fluoride treatments, and disposables in routine dental practice. Rising prevalence of dental caries and periodontal diseases, coupled with increasing dental visits and preventive care initiatives, fuels consistent demand for dental preventive products. Regulatory guidelines and professional standards from organizations such as the American Dental Association (ADA) further reinforce product adoption in clinics and hospitals.
The market also benefits from the presence of established players such as 3M, Dentsply Sirona, and KaVo Kerr, which offer a wide range of innovative preventive solutions. Technological advancements, including minimally invasive sealants, improved fluoride varnishes, and ergonomic disposable products, are contributing to market growth. Additionally, growing focus on pediatric and geriatric oral health, coupled with insurance coverage for preventive treatments, continues to drive demand, maintaining North America’s leadership position in the dental preventive supplies market.
Asia Pacific Dental Preventive Supplies Market Trends and Insights
The Asia Pacific region is the fastest-growing market for dental preventive supplies, led by countries such as China, India, Japan, and Southeast Asian nations. Market growth is driven by rising oral health awareness, increasing disposable income, and expanding access to modern dental care facilities. Preventive dental procedures, including fluoride treatments, sealants, and prophylaxis, are increasingly adopted in urban and semi-urban areas to address the growing prevalence of dental caries and periodontal diseases. Expanding dental insurance coverage and government oral health initiatives further support product demand.
Emerging economies in the region are witnessing rapid growth in dental clinics, specialty practices, and educational programs promoting preventive oral care. The market is also supported by local manufacturing hubs in China, Malaysia, and Thailand, offering cost-effective products and improving supply chain efficiency. Growing adoption of advanced and minimally invasive products, coupled with increasing consumer preference for disposable and hygienic dental supplies, is fueling sales. Overall, the Asia Pacific market is expected to maintain strong growth due to rising healthcare investment and expanding preventive dental care practices.
Competitive Landscape
Market Structure Analysis
The dental preventive supplies market is moderately consolidated, dominated by several global leaders alongside regional and specialized manufacturers. Key players include 3M Company, KaVo Kerr (Danaher), Dentsply Sirona, Ivoclar Vivadent AG, Preventive Technologies Inc., Dental Technologies Inc., Young Innovations Inc., GC Corporation, Cantel Medical, and TePe Oral Hygiene Products Ltd. These companies differentiate themselves through extensive product portfolios, advanced technologies, and strategic marketing approaches. Market structure is segmented by product type (sealants & fluorides, prophylaxis, disposables, others) and end use (dental clinics, hospitals, specialty practices). Leading manufacturers focus on innovation, sales force optimization, and expansion in developing economies to increase market share. Geographic diversification and strategic partnerships remain key strategies, enabling companies to enhance distribution networks, improve accessibility, and maintain competitive advantage in the growing global dental preventive supplies market.?
Key Market Developments
- In September 2025, Clove Oral Care introduced a new range of toothpaste and toothbrush products.
Companies Covered in Dental Preventive Supplies Market
- 3M Company
- Tepe oral hygiene products Ltd.
- Kavo Kerr Corporation
- Dentsply Sirona
- Ivoclar vivadent AG
- Preventive Technologies, Inc.
- Dental Technologies, Inc.
- Young Innovations, Inc.
- GC Corporation
- Cantel Medical
- Others
Frequently Asked Questions
The global dental preventive supplies market reaches US$ 5.2 billion in 2026.
Rising dental disease prevalence, increasing oral hygiene awareness, growing dental visits, and adoption of preventive care products drive market demand.
North America leads with 36% share in 2025.
Expansion in emerging markets and development of advanced, minimally invasive preventive products like sealants, fluorides, and disposables offer growth potential.
Top 3M Company, Tepe oral hygiene products Ltd., Kavo Kerr Corporation, Dentsply Sirona, and Ivoclar vivadent AG.


