


- Executive Summary
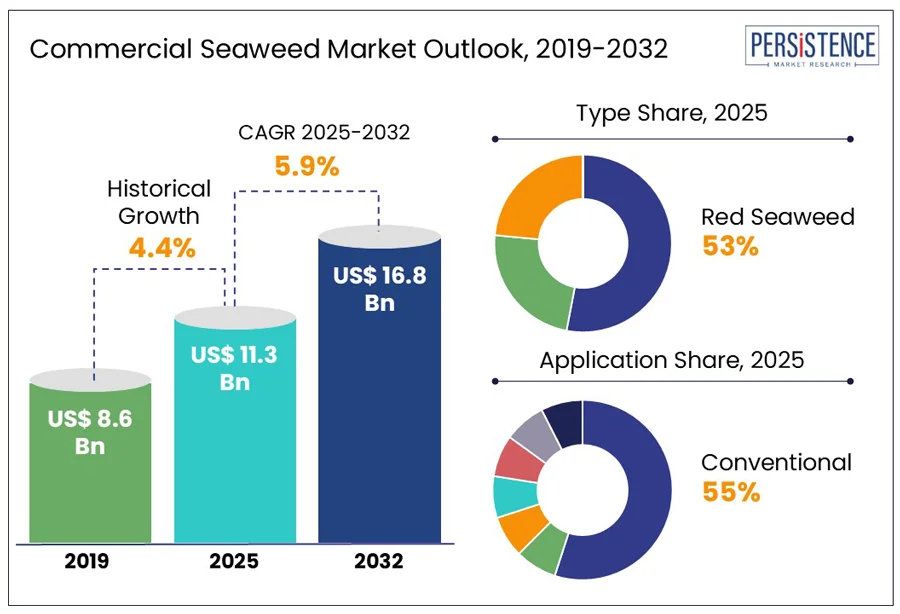
- Global Commercial Seaweed Market Snapshot, 2025 and 2032
- Market Opportunity Assessment, 2025 - 2032, US$ Bn
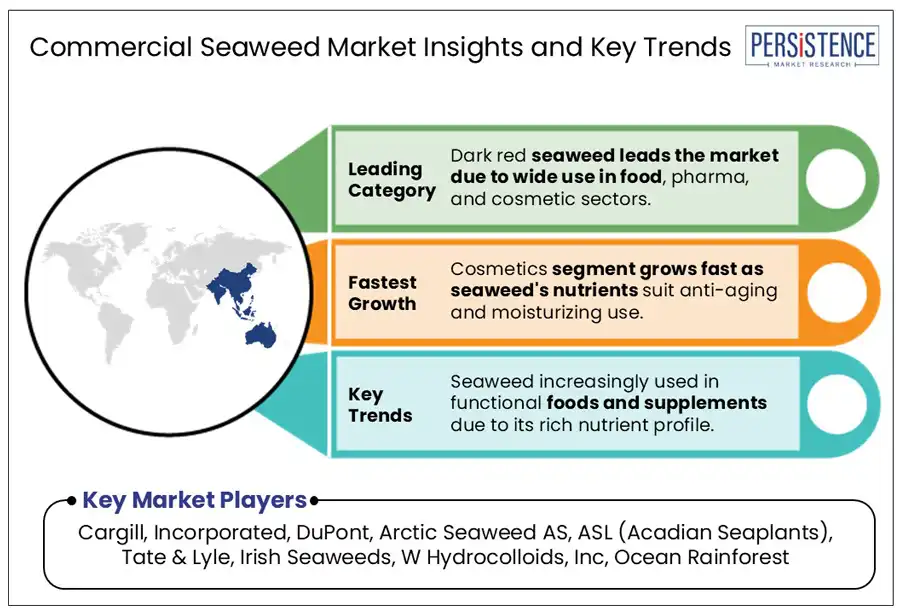
- Key Market Trends
- Future Market Projections
- Premium Market Insights
- Industry Developments and Key Market Events
- PMR Analysis and Recommendations
- Market Overview
- Market Scope and Definition
- Market Dynamics
- Drivers
- Restraints
- Opportunity
- Challenges
- Key Trends
- COVID-19 Impact Analysis
- Forecast Factors - Relevance and Impact
- Value Added Insights
- Value Chain Analysis
- Key Market Players
- Regulatory Landscape
- PESTLE Analysis
- Porter’s Five Force Analysis
- Price Trend Analysis, 2019 - 2032
- Key Factors Impacting Product Prices
- Pricing Analysis, By Type
- Regional Prices and Product Preferences
- Global Commercial Seaweed Market Outlook
- Key Highlights
- Market Volume (Tons) Projections
- Market Size (US$ Bn) and Y-o-Y Growth
- Absolute $ Opportunity
- Market Size (US$ Bn) Analysis and Forecast
- Historical Market Size (US$ Bn) Analysis, 2019-2024
- Market Size (US$ Bn) Analysis and Forecast, 2025-2032
- Global Commercial Seaweed Market Outlook: Type
- Historical Market Size (US$ Bn) and Volume (Tons) Analysis, By Type, 2019-2024
- Market Size (US$ Bn) and Volume (Tons) Analysis and Forecast, By Type, 2025-2032
- Red Seaweed
- Brown Seaweed
- Green Seaweed
- Market Attractiveness Analysis: Type
- Global Commercial Seaweed Market Outlook: Form
- Historical Market Size (US$ Bn) and Volume (Tons) Analysis, By Form, 2019-2024
- Market Size (US$ Bn) and Volume (Tons) Analysis and Forecast, By Form, 2025-2032
- Powder
- Flake
- Liquid
- Market Attractiveness Analysis: Form
- Global Commercial Seaweed Market Outlook: Application
- Historical Market Size (US$ Bn) and Volume (Tons) Analysis, By Application, 2019-2024
- Market Size (US$ Bn) and Volume (Tons) Analysis and Forecast, By Application, 2025-2032
- Food & Beverage
- Animal Feed & Aquaculture
- Agriculture
- Pharmaceuticals
- Cosmetics & Personal Care
- Biofuels & Biomass
- Others
- Market Attractiveness Analysis: Application
- Key Highlights
- Global Commercial Seaweed Market Outlook: Region
- Historical Market Size (US$ Bn) and Volume (Tons) Analysis, By Region, 2019-2024
- Market Size (US$ Bn) and Volume (Tons) Analysis and Forecast, By Region, 2025-2032
- North America
- Latin America
- Europe
- East Asia
- South Asia and Oceania
- Middle East & Africa
- Market Attractiveness Analysis: Region
- North America Commercial Seaweed Market Outlook
- Historical Market Size (US$ Bn) and Volume (Tons) Analysis, By Market, 2019-2024
- By Country
- By Type
- By Form
- By Application
- Market Size (US$ Bn) and Volume (Tons) Analysis and Forecast, By Country, 2025-2032
- U.S.
- Canada
- Market Size (US$ Bn) and Volume (Tons) Analysis and Forecast, By Type, 2025-2032
- Red Seaweed
- Brown Seaweed
- Green Seaweed
- Market Size (US$ Bn) and Volume (Tons) Analysis and Forecast, By Form, 2025-2032
- Powder
- Flake
- Liquid
- Market Size (US$ Bn) and Volume (Tons) Analysis and Forecast, By Application, 2025-2032
- Food & Beverage
- Animal Feed & Aquaculture
- Agriculture
- Pharmaceuticals
- Cosmetics & Personal Care
- Biofuels & Biomass
- Others
- Market Attractiveness Analysis
- Historical Market Size (US$ Bn) and Volume (Tons) Analysis, By Market, 2019-2024
- Europe Commercial Seaweed Market Outlook
- Historical Market Size (US$ Bn) and Volume (Tons) Analysis, By Market, 2019-2024
- By Country
- By Type
- By Form
- By Application
- Market Size (US$ Bn) and Volume (Tons) Analysis and Forecast, By Country, 2025-2032
- Germany
- France
- U.K.
- Denmark
- Spain
- Russia
- Rest of Europe
- Market Size (US$ Bn) and Volume (Tons) Analysis and Forecast, By Type, 2025-2032
- Red Seaweed
- Brown Seaweed
- Green Seaweed
- Market Size (US$ Bn) and Volume (Tons) Analysis and Forecast, By Form, 2025-2032
- Powder
- Flake
- Liquid
- Market Size (US$ Bn) and Volume (Tons) Analysis and Forecast, By Application, 2025-2032
- Food & Beverage
- Animal Feed & Aquaculture
- Agriculture
- Pharmaceuticals
- Cosmetics & Personal Care
- Biofuels & Biomass
- Others
- Market Attractiveness Analysis
- Historical Market Size (US$ Bn) and Volume (Tons) Analysis, By Market, 2019-2024
- East Asia Commercial Seaweed Market Outlook
- Historical Market Size (US$ Bn) and Volume (Tons) Analysis, By Market, 2019-2024
- By Country
- By Type
- By Form
- By Application
- Market Size (US$ Bn) and Volume (Tons) Analysis and Forecast, By Country, 2025-2032
- China
- Japan
- South Korea
- Market Size (US$ Bn) and Volume (Tons) Analysis and Forecast, By Type, 2025-2032
- Red Seaweed
- Brown Seaweed
- Green Seaweed
- Market Size (US$ Bn) and Volume (Tons) Analysis and Forecast, By Form, 2025-2032
- Powder
- Flake
- Liquid
- Market Size (US$ Bn) and Volume (Tons) Analysis and Forecast, By Application, 2025-2032
- Food & Beverage
- Animal Feed & Aquaculture
- Agriculture
- Pharmaceuticals
- Cosmetics & Personal Care
- Biofuels & Biomass
- Others
- Market Attractiveness Analysis
- Historical Market Size (US$ Bn) and Volume (Tons) Analysis, By Market, 2019-2024
- South Asia & Oceania Commercial Seaweed Market Outlook
- Historical Market Size (US$ Bn) and Volume (Tons) Analysis, By Market, 2019-2024
- By Country
- By Type
- By Form
- By Application
- Market Size (US$ Bn) and Volume (Tons) Analysis and Forecast, By Country, 2025-2032
- India
- Indonesia
- Thailand
- The Philippines
- ANZ
- Rest of South Asia & Oceania
- Market Size (US$ Bn) and Volume (Tons) Analysis and Forecast, By Type, 2025-2032
- Red Seaweed
- Brown Seaweed
- Green Seaweed
- Market Size (US$ Bn) and Volume (Tons) Analysis and Forecast, By Form, 2025-2032
- Powder
- Flake
- Liquid
- Market Size (US$ Bn) and Volume (Tons) Analysis and Forecast, By Application, 2025-2032
- Food & Beverage
- Animal Feed & Aquaculture
- Agriculture
- Pharmaceuticals
- Cosmetics & Personal Care
- Biofuels & Biomass
- Others
- Market Attractiveness Analysis
- Historical Market Size (US$ Bn) and Volume (Tons) Analysis, By Market, 2019-2024
- Latin America Commercial Seaweed Market Outlook
- Historical Market Size (US$ Bn) and Volume (Tons) Analysis, By Market, 2019-2024
- By Country
- By Type
- By Form
- By Application
- Market Size (US$ Bn) and Volume (Tons) Analysis and Forecast, By Country, 2025-2032
- Brazil
- Mexico
- Rest of Latin America
- Market Size (US$ Bn) and Volume (Tons) Analysis and Forecast, By Type, 2025-2032
- Red Seaweed
- Brown Seaweed
- Green Seaweed
- Market Size (US$ Bn) and Volume (Tons) Analysis and Forecast, By Form, 2025-2032
- Powder
- Flake
- Liquid
- Market Size (US$ Bn) and Volume (Tons) Analysis and Forecast, By Application, 2025-2032
- Food & Beverage
- Animal Feed & Aquaculture
- Agriculture
- Pharmaceuticals
- Cosmetics & Personal Care
- Biofuels & Biomass
- Others
- Market Attractiveness Analysis
- Historical Market Size (US$ Bn) and Volume (Tons) Analysis, By Market, 2019-2024
- Middle East & Africa Commercial Seaweed Market Outlook
- Historical Market Size (US$ Bn) and Volume (Tons) Analysis, By Market, 2019-2024
- By Country
- By Type
- By Form
- By Application
- Market Size (US$ Bn) and Volume (Tons) Analysis and Forecast, By Country, 2025-2032
- GCC Countries
- Egypt
- South Africa
- Northern Africa
- Rest of Middle East & Africa
- Market Size (US$ Bn) and Volume (Tons) Analysis and Forecast, By Type, 2025-2032
- Red Seaweed
- Brown Seaweed
- Green Seaweed
- Market Size (US$ Bn) and Volume (Tons) Analysis and Forecast, By Form, 2025-2032
- Powder
- Flake
- Liquid
- Market Size (US$ Bn) and Volume (Tons) Analysis and Forecast, By Application, 2025-2032
- Food & Beverage
- Animal Feed & Aquaculture
- Agriculture
- Pharmaceuticals
- Cosmetics & Personal Care
- Biofuels & Biomass
- Others
- Market Attractiveness Analysis
- Historical Market Size (US$ Bn) and Volume (Tons) Analysis, By Market, 2019-2024
- Competition Landscape
- Market Share Analysis, 2024
- Market Structure
- Competition Intensity Mapping By Market
- Competition Dashboard
- Company Profiles (Details - Overview, Financials, Strategy, Recent Developments)
- Cargill, Incorporated
- Overview
- Segments and Type
- Key Financials
- Market Developments
- Market Strategy
- DuPont
- Arctic Seaweed AS
- ASL (Acadian Seaplants)
- Tate & Lyle
- Irish Seaweeds
- W Hydrocolloids, Inc
- Ocean Rainforest
- The Seaweed Company
- Gelymar S.A
- Thorverk hf.
- Ocean's Balance
- Seakura
- Seaweed & Co.
- ClimaCrew Pvt Ltd
- Pacific Harvest Seaweeds
- Others
- Cargill, Incorporated
- Appendix
- Research Methodology
- Research Assumptions
- Acronyms and Abbreviations

Loading page data
Please wait a moment


