

- Executive Summary
- Global Chondroitin Sulfate Market Snapshot 2026 and 2033
- Market Opportunity Assessment, 2026-2033, US$ Mn
- Key Market Trends
- Industry Developments and Key Market Events
- Demand Side and Supply-Side Analysis
- PMR Analysis and Recommendations
- Market Overview
- Market Scope and Definitions
- Market Dynamics
- Driver
- Restraint
- Opportunities
- Trends
- Macro-Economic Factors
- Global GDP Growth Outlook
- Global Economic Outlook
- Global Food Security Index
- Global Urbanization Growth Outlook
- Forecast Factors – Relevance and Impact
- COVID-19 Impact Assessment
- Value Added Insights
- Value Chain analysis
- Key Market Players
- Product Adoption Analysis
- Key Promotional Strategies by key players
- PESTLE Analysis
- Porter's Five Forces Analysis
- Regulatory and Technology Landscape
- Global Chondroitin Sulfate Market Outlook: Historical (2020 – 2025) and Forecast (2026 – 2033)
- Key Highlights
- Global Chondroitin Sulfate Market Outlook: Source
- Introduction/Key Findings
- Historical Market Size (US$ Mn) Analysis by Source, 2020-2025
- Current Market Size (US$ Mn) Forecast, by Source, 2026-2033
- Bovine
- Porcine
- Poultry
- Fish, Shark & Crocodiles
- Others
- Market Attractiveness Analysis: Source
- Global Chondroitin Sulfate Market Outlook: Form
- Introduction/Key Findings
- Historical Market Size (US$ Mn) Analysis by Form, 2020-2025
- Current Market Size (US$ Mn) Forecast, by Form, 2026-2033
- Powder
- Tablet
- Capsules
- Market Attractiveness Analysis: Form
- Global Chondroitin Sulfate Market Outlook: End Use
- Introduction/Key Findings
- Historical Market Size (US$ Mn) Analysis by End Use, 2020-2025
- Current Market Size (US$ Mn) Forecast, by End Use, 2026-2033
- Cosmetics & Personal Care
- Pharmaceutical and Nutraceutical
- Aqua feed
- Pet food and veterinary supplements
- Market Attractiveness Analysis: End Use
- Global Chondroitin Sulfate Market Outlook: Distribution Channel
- Introduction/Key Findings
- Historical Market Size (US$ Mn) Analysis by Distribution Channel, 2020-2025
- Current Market Size (US$ Mn) Forecast, by Distribution Channel, 2026-2033
- Business to Business
- Business to Consumer
- Market Attractiveness Analysis: Distribution Channel
- Global Chondroitin Sulfate Market Outlook: Region
- Key Highlights
- Historical Market Size (US$ Mn) Analysis by Region, 2020-2025
- Current Market Size (US$ Mn) Forecast by Region, 2026-2033
- North America
- Europe
- East Asia
- South Asia & Oceania
- Latin America
- Middle East & Africa
- Market Attractiveness Analysis: Region
- North America Chondroitin Sulfate Market Outlook: Historical (2020 – 2025) and Forecast (2026 – 2033)
- Key Highlights
- North America Market Size (US$ Mn) Forecast, by Country, 2026-2033
- U.S.
- Canada
- North America Market Size (US$ Mn) Forecast, by Source, 2026-2033
- Bovine
- Porcine
- Poultry
- Fish, Shark & Crocodiles
- Others
- North America Market Size (US$ Mn) Forecast, by Form, 2026-2033
- Powder
- Tablet
- Capsules
- North America Market Size (US$ Mn) Forecast, by End Use, 2026-2033
- Cosmetics & Personal Care
- Pharmaceutical and Nutraceutical
- Aqua feed
- Pet food and veterinary supplements
- North America Market Size (US$ Mn) Forecast, by Distribution Channel, 2026-2033
- Business to Business
- Business to Consumer
- Europe Chondroitin Sulfate Market Outlook: Historical (2020 – 2025) and Forecast (2026 – 2033)
- Key Highlights
- Europe Market Size (US$ Mn) Forecast, by Country, 2026-2033
- Germany
- Italy
- France
- U.K.
- Spain
- Russia
- Rest of Europe
- Europe Market Size (US$ Mn) Forecast, by Source, 2026-2033
- Bovine
- Porcine
- Poultry
- Fish, Shark & Crocodiles
- Others
- Europe Market Size (US$ Mn) Forecast, by Form, 2026-2033
- Powder
- Tablet
- Capsules
- Europe Market Size (US$ Mn) Forecast, by End Use, 2026-2033
- Cosmetics & Personal Care
- Pharmaceutical and Nutraceutical
- Aqua feed
- Pet food and veterinary supplements
- Europe Market Size (US$ Mn) Forecast, by Distribution Channel, 2026-2033
- Business to Business
- Business to Consumer
- East Asia Chondroitin Sulfate Market Outlook: Historical (2020 – 2025) and Forecast (2026 – 2033)
- Key Highlights
- East Asia Market Size (US$ Mn) Forecast, by Country, 2026-2033
- China
- Japan
- South Korea
- East Asia Market Size (US$ Mn) Forecast, by Source, 2026-2033
- Bovine
- Porcine
- Poultry
- Fish, Shark & Crocodiles
- Others
- East Asia Market Size (US$ Mn) Forecast, by Form, 2026-2033
- Powder
- Tablet
- Capsules
- East Asia Market Size (US$ Mn) Forecast, by End Use, 2026-2033
- Cosmetics & Personal Care
- Pharmaceutical and Nutraceutical
- Aqua feed
- Pet food and veterinary supplements
- East Asia Market Size (US$ Mn) Forecast, by Distribution Channel, 2026-2033
- Business to Business
- Business to Consumer
- South Asia & Oceania Chondroitin Sulfate Market Outlook: Historical (2020 – 2025) and Forecast (2026 – 2033)
- Key Highlights
- South Asia & Oceania Market Size (US$ Mn) Forecast, by Country, 2026-2033
- India
- Southeast Asia
- ANZ
- Rest of SAO
- South Asia & Oceania Market Size (US$ Mn) Forecast, by Source, 2026-2033
- Bovine
- Porcine
- Poultry
- Fish, Shark & Crocodiles
- Others
- South Asia & Oceania Market Size (US$ Mn) Forecast, by Form, 2026-2033
- Powder
- Tablet
- Capsules
- South Asia & Oceania Market Size (US$ Mn) Forecast, by End Use, 2026-2033
- Cosmetics & Personal Care
- Pharmaceutical and Nutraceutical
- Aqua feed
- Pet food and veterinary supplements
- South Asia & Oceania Market Size (US$ Mn) Forecast, by Distribution Channel, 2026-2033
- Business to Business
- Business to Consumer
- Latin America Chondroitin Sulfate Market Outlook: Historical (2020 – 2025) and Forecast (2026 – 2033)
- Key Highlights
- Latin America Market Size (US$ Mn) Forecast, by Country, 2026-2033
- Brazil
- Mexico
- Rest of LATAM
- Latin America Market Size (US$ Mn) Forecast, by Source, 2026-2033
- Bovine
- Porcine
- Poultry
- Fish, Shark & Crocodiles
- Others
- Latin America Market Size (US$ Mn) Forecast, by Form, 2026-2033
- Powder
- Tablet
- Capsules
- Latin America Market Size (US$ Mn) Forecast, by End Use, 2026-2033
- Cosmetics & Personal Care
- Pharmaceutical and Nutraceutical
- Aqua feed
- Pet food and veterinary supplements
- Latin America Market Size (US$ Mn) Forecast, by Distribution Channel, 2026-2033
- Business to Business
- Business to Consumer
- Middle East & Africa Chondroitin Sulfate Market Outlook: Historical (2020 – 2025) and Forecast (2026 – 2033)
- Key Highlights
- Middle East & Africa Market Size (US$ Mn) Forecast, by Country, 2026-2033
- GCC Countries
- South Africa
- Northern Africa
- Rest of MEA
- Middle East & Africa Market Size (US$ Mn) Forecast, by Source, 2026-2033
- Bovine
- Porcine
- Poultry
- Fish, Shark & Crocodiles
- Others
- Middle East & Africa Market Size (US$ Mn) Forecast, by Form, 2026-2033
- Powder
- Tablet
- Capsules
- Middle East & Africa Market Size (US$ Mn) Forecast, by End Use, 2026-2033
- Cosmetics & Personal Care
- Pharmaceutical and Nutraceutical
- Aqua feed
- Pet food and veterinary supplements
- Middle East & Africa Market Size (US$ Mn) Forecast, by Distribution Channel, 2026-2033
- Business to Business
- Business to Consumer
- Competition Landscape
- Market Share Analysis, 2025
- Market Structure
- Competition Intensity Mapping
- Competition Dashboard
- Company Profiles
- TSI Group Ltd.,
- Company Overview
- Product Portfolio/Offerings
- Key Financials
- SWOT Analysis
- Company Strategy and Key Developments
- Solabia Group
- AcerChem International Inc.
- Seikagaku Corporation
- Jiaxing Hengjie Biopharmaceutical Co., Ltd
- Aoxing Biotechnology Intl Co., Limited
- Stanford Chemicals
- Shanghai JBiChem International Trading Co.,Ltd.
- Sioux Pharm, Inc.
- Pacific Rainbow International, Inc.
- Synutra, Inc
- Zeria Pharmaceutical Co., Ltd.
- Summit Nutritionals International, Inc.
- Yantai Ruikangda Biochemical Products Co., Ltd.
- Others
- TSI Group Ltd.,
- Appendix
- Research Methodology
- Research Assumptions
- Acronyms and Abbreviations


- Nutraceuticals & Functional Foods
- Chondroitin Sulfate Market
Chondroitin Sulfate Market Size, Share, and Growth Forecast 2026 - 2033
Chondroitin Sulfate Market by Source (Bovine, Porcine, Poultry, Fish, Shark & Crocodiles, Others), by Form (Powder, Tablet, Capsules), by End Use (Cosmetics & Personal Care, Pharmaceutical and Nutraceutical, Aqua feed, Pet food and veterinary supplements), by Distribution Channel, by Regional Analysis, 2026-2033
Chondroitin Sulfate Market Size and Trends Analysis
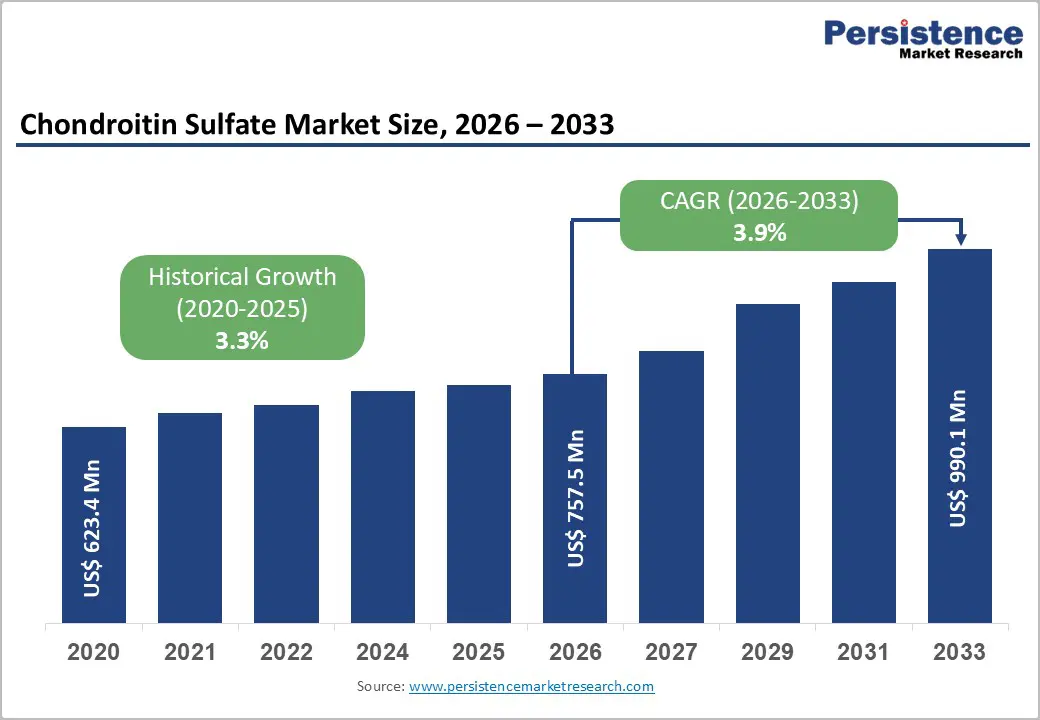
The global chondroitin sulfate market size is expected to be valued at US$ 757.5 million in 2026 and projected to reach US$ 990.1 million by 2033, growing at a CAGR of 3.9% between 2026 and 2033.
The global chondroitin sulfate market is witnessing significant growth due to its widespread use as a bioactive supplement for osteoarthritis, joint pain, and inflammation management. Derived from bovine, porcine, marine, and other sources, chondroitin sulfate is increasingly incorporated in pharmaceuticals, nutraceuticals, pet food, and cosmetic applications. Its combination with glucosamine enhances joint-health benefits, making it a preferred ingredient for dietary supplements and therapeutic formulations.
Market trends indicate rising demand from the aging population, growing health awareness, and the expanding pet care and veterinary industries. Additionally, cosmetic and personal care sectors are adopting chondroitin sulfate for its moisturizing, anti-inflammatory, and skin-repair properties, further diversifying applications and driving global market expansion.
Key Industry Highlights
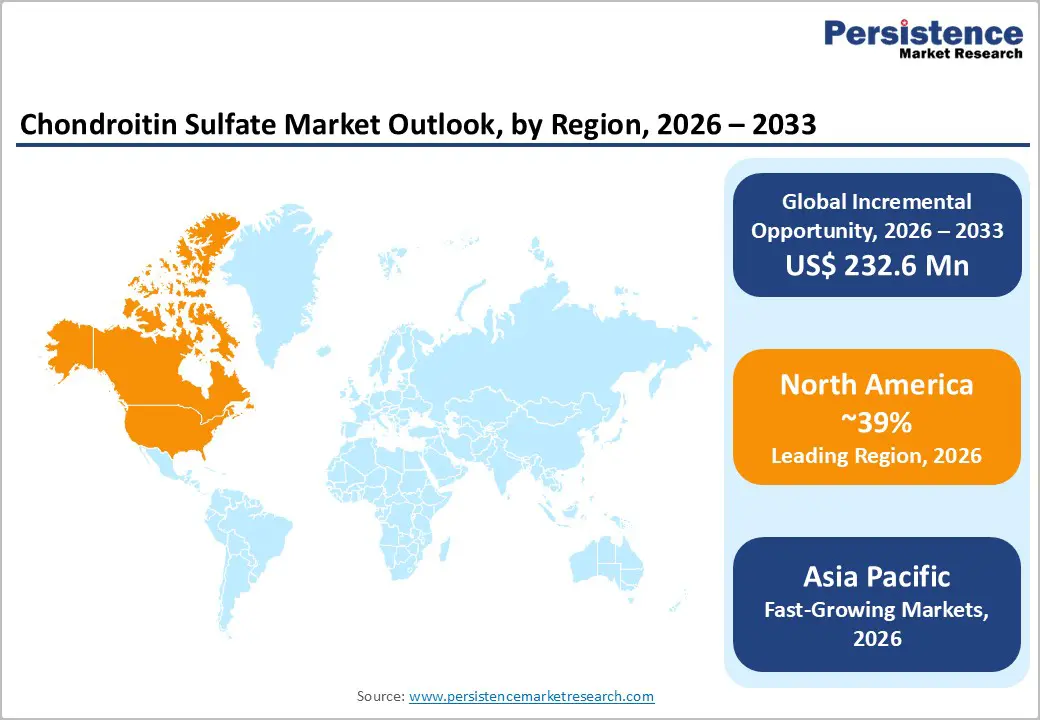
- Leading Region: North America leads the chondroitin sulfate market, supported by a large aging population, high prevalence of osteoarthritis, strong pharmaceutical and nutraceutical industries, and widespread adoption of dietary supplements.
- Fastest Growing Region: Asia Pacific is the fastest-growing region, driven by increasing health awareness, rising joint-health issues, growing pet care and veterinary industries, and expanding nutraceutical and cosmetic applications.
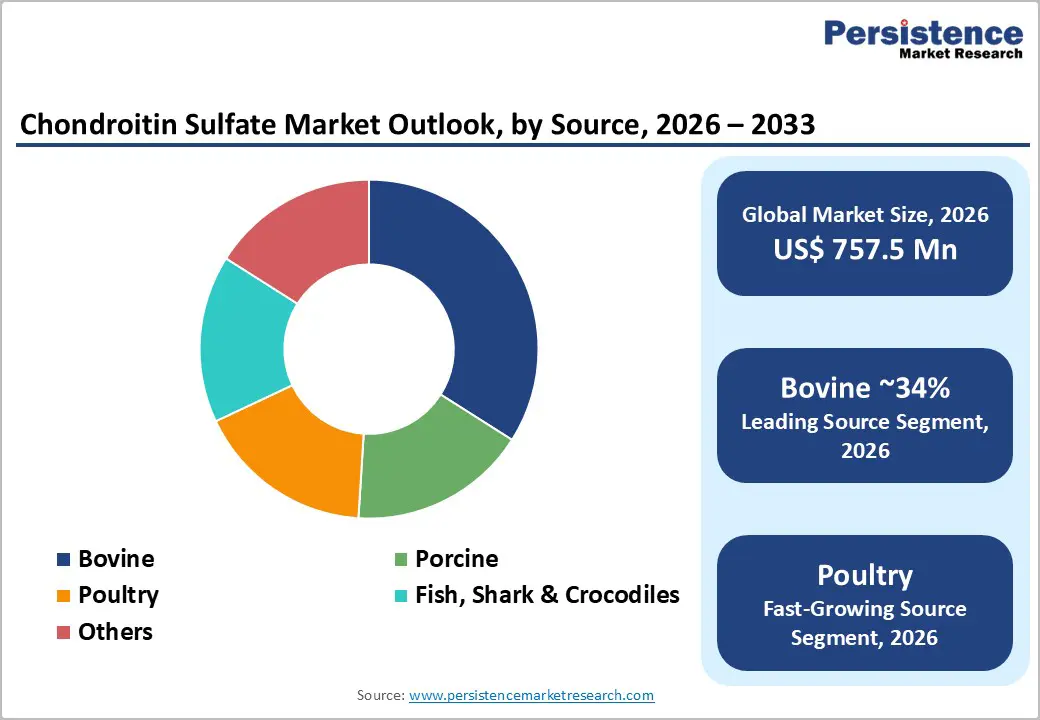
- Dominant Segment: End-use in pharmaceuticals and nutraceuticals dominates the market due to high demand for joint-health supplements, combination formulations with glucosamine, and therapeutic applications for osteoarthritis and inflammation.
- Fastest Growing Segment: Pet food and veterinary supplements are the fastest-growing segment, fueled by increasing pet adoption, awareness of joint care in animals, and rising functional ingredient incorporation in pet nutrition products.
| Key Insights | Details |
|---|---|
| Chondroitin Sulfate Market Size (2026E) | US$ 757.5 Mn |
| Market Value Forecast (2033F) | US$ 990.1 Mn |
| Projected Growth (CAGR 2026 to 2033) | 3.9% |
| Historical Market Growth (CAGR 2020 to 2025) | 3.3% |
Market Dynamics
Driver – Gaining Prominence as a Bioactive Supplement for Osteoarthritis Patients
The rising prevalence of osteoarthritis, particularly among the aging population, is a key driver for the chondroitin sulfate market. Women are more susceptible than men, and incidence increases with age, leading to greater consumption of joint-health supplements. Chondroitin sulfate is widely recognized for its ability to reduce joint pain, inflammation, and improve mobility, making it a preferred alternative or adjunct therapy. Commercial products often combine chondroitin sulfate with glucosamine to enhance efficacy. Its therapeutic versatility extends beyond joint care, including ophthalmic applications such as eye drops and veterinary uses, which further reinforces market adoption. According to Arthritis Research UK, by 2035, approximately 8.3 million people aged 45 and above may be affected by knee osteoarthritis, highlighting a large potential consumer base for chondroitin sulfate supplements.
Growing Pet Food Industry Demand
The booming pet care and veterinary industry is driving additional market growth. Chondroitin sulfate is used in pet food and veterinary supplements to prevent joint problems, arthritis, and hip dysplasia, supporting overall mobility and health. Companies such as Zeria Group provide multiple grades of chondroitin sulfate to meet varying manufacturer requirements. Increasing awareness among pet owners about functional nutrition is boosting demand, especially in developed markets where pet wellness products are a priority. The growing integration of chondroitin sulfate into pet food formulations positions it as a key functional ingredient, driving overall market expansion.
Restraints – Supply Chain and Purity Concerns
One of the major restraints affecting the chondroitin sulfate market is the inconsistency in purity and quality across different sources. Adulteration and the presence of low-grade chondroitin sulfate (below 85% purity) reduce the efficacy of supplements and therapeutic formulations, leading to diminished consumer trust. While regulatory standards such as the United States Pharmacopeia (USP) mandate an assay range of 90–105%, significant variability still exists in products sourced from non-certified or unregulated suppliers. This lack of standardization poses challenges for manufacturers in ensuring consistent product quality, especially in bulk nutraceutical and pharmaceutical applications, limiting broader market adoption.
Safety concerns related to bovine-derived chondroitin sulfate further restrain market growth. Although scientific studies have demonstrated minimal risk, potential transmission of bovine spongiform encephalopathy (BSE) continues to influence consumer perception and regulatory caution. These supply chain challenges and purity concerns collectively undermine confidence among end users, physicians, and supplement manufacturers. As a result, market expansion is hindered, particularly in regions with stringent safety regulations or high awareness of product quality and sourcing transparency.
Opportunity – Expansion in Cosmetics and Personal Care Applications
Chondroitin sulfate is increasingly being adopted in the cosmetic and personal care sectors due to its moisturizing, soothing, and anti-inflammatory properties. It helps reinforce the intercellular matrix, contributing to healthier skin and hair. Beauty and personal care product manufacturers are gradually incorporating chondroitin sulfate into natural and functional formulations. Zeria Group, for example, launched ScanDroitin for the cosmetic industry, highlighting the product’s growing relevance beyond pharmaceuticals. Rising consumer preference for natural, bioactive ingredients presents an opportunity for manufacturers to diversify product offerings and capture market share in skincare and haircare segments.
Multi-Industry Applications Driving Market Expansion
Chondroitin sulfate’s compatibility with other ingredients such as glucosamine, N-acetyl glucosamine, and manganese ascorbate broadens its applicability across multiple sectors. Its use in osteoarthritis treatment represents the core functional segment, while expanding adoption in cosmetics, personal care, veterinary supplements, and pet food creates cross-industry growth opportunities. This versatility allows manufacturers to develop innovative, multifunctional products, meeting diverse consumer needs. Increasing demand across these industries, coupled with rising awareness of health, wellness, and preventive care, is expected to accelerate the overall growth of the chondroitin sulfate market in the coming years.
Category-wise Analysis
By Source Analysis
The chondroitin sulfate market is segmented by source into bovine, porcine, fish, shark & crocodile, poultry, and other emerging biological or synthetic origins. Among these, bovine and porcine sources dominate global production due to their wide availability, established slaughterhouse supply chains, scalable extraction technologies, and long-standing regulatory acceptance in pharmaceutical and nutraceutical manufacturing. These sources support consistent quality and volume requirements for joint-health supplements and therapeutic formulations, making them preferred by large manufacturers. Their cost efficiency and proven safety profiles further strengthen their commercial leadership across developed and emerging markets.
Marine-derived chondroitin, sourced from fish, shark, and crocodile cartilage, is gaining traction as consumers seek alternative origins for cultural, dietary, or sustainability reasons, particularly in Asia-Pacific countries. Poultry-based chondroitin remains a smaller segment but is being evaluated for supply diversification and lower processing costs. Meanwhile, emerging biological or synthetic sources are attracting research interest aimed at reducing dependence on livestock, improving purity levels, and ensuring long-term raw-material security, positioning this segment for gradual expansion over the forecast period.
By Distribution Channel Analysis
Based on sales channels, the chondroitin sulfate market is divided into direct sales (business-to-business) and indirect sales (business-to-consumer). Direct sales remain crucial for large-volume buyers such as pharmaceutical manufacturers, supplement brands, cosmetic formulators, and aquaculture producers, where long-term supply contracts, quality certification, and regulatory compliance are decisive purchasing factors. These transactions typically involve customized grades, bulk packaging, and stable pricing agreements to ensure uninterrupted production cycles.
Indirect sales channels primarily serve end consumers and are further segmented into drug stores & pharmacies, e-commerce platforms, and other outlets such as specialty nutrition stores and general retailers. Pharmacies continue to play an important role due to professional recommendations and consumer trust in joint-health products. However, e-commerce is rapidly gaining traction, supported by digital marketing, subscription models, cross-border sales, and rising health-conscious populations. Specialty stores and wellness retailers also contribute to market visibility by offering premium and targeted formulations.
Region-wise Insights
North America Chondroitin Sulfate Market Trends
North America dominated the global chondroitin sulfate market in 2026 with an estimated revenue share of about 39%, supported by a strong pharmaceutical manufacturing base in the United States and regulatory approvals from the FDA for products containing sodium chondroitin sulfate. Demand is further strengthened by the rising prevalence of osteoarthritis, expanding use in cholesterol management, cataract surgery preparations, and ophthalmic formulations such as eye drops. Beyond pharmaceuticals, chondroitin sulfate also finds applications across cosmetics, culinary products, pet food, and veterinary supplements, reflecting its broad functional profile and well-established safety perception among consumers.
In the United States specifically, bovine-derived chondroitin sulfate remains the preferred source, widely used for managing osteoarthritis, cardiovascular conditions, HIV-related complications, and elevated cholesterol levels. A rapidly aging population, combined with growing consumer inclination toward dietary supplements for joint and heart health, continues to stimulate market expansion. Increasing emphasis on preventive healthcare, wellness products, and active aging lifestyles is expected to sustain long-term growth across the region’s nutraceutical and pharmaceutical sectors.
Europe Chondroitin Sulfate Market Trends
Europe’s chondroitin sulfate market is expanding steadily, driven by rising incorporation of sodium chondroitin sulfate into pharmaceuticals and nutraceutical formulations. The compound is commonly utilized to manage osteoarthritis, relieve joint pain, address cardiovascular issues, reduce excessive cholesterol, and produce ophthalmic solutions. Strong healthcare systems, aging demographics, and increasing preference for evidence-based supplements have encouraged manufacturers to broaden product portfolios containing chondroitin sulfate across Western and Central Europe.
Germany represents a major national market, where high osteoarthritis prevalence has led to significant therapeutic use of chondroitin sulfate, alongside growing incorporation in dietary supplements and functional foods. Spain has also emerged as an important hub, particularly for nutraceutical research and development, with companies investing heavily in innovative formulations infused with chondroitin sulfate. Focus on product differentiation, premium wellness offerings, and clinical validation is expected to further strengthen demand in both countries. Collectively, supportive regulatory environments, expanding elderly populations, and strong R&D activity position Europe as a key contributor to global market revenues.
Asia Pacific Chondroitin Sulfate Market Trends
Asia Pacific is projected to record the fastest growth in the chondroitin sulfate market, with an expected CAGR of around 4.6% between 2026 and 2033. This acceleration is fueled by expanding nutraceutical, pharmaceutical, cosmetic, and personal-care industries, alongside rising domestic production and export activity from countries such as China and Japan. Growing health awareness, increasing disposable incomes, and rapid urbanization are encouraging consumption of joint-health supplements and functional ingredients across the region.
China hosts a highly fragmented production landscape with more than 200 manufacturers, where raw-material costs represent a significant portion of final product pricing. Despite regulatory challenges related to quality scrutiny in export markets, strong overseas demand from the United States and Europe continues to support shipments. In Japan, chondroitin sulfate is widely used in pharmaceutical and cosmetic applications, supported by a rapidly aging population and increasing osteoarthritis prevalence. Its use in eye drops, functional foods, and metabolic therapies is expected to further stimulate regional demand.
Market Competitive Landscape
Demand for chondroitin sulfate continues to rise and the number of new entrants in this market is also increasing with growing production clusters in China. Hence, established players in the market are facing tough competition from new players. The study indicates that more than 20% market share is held by multinational players in the market. Rising demand for chondroitin sulfate and increasing number of new market players are hindering the market growth of top business ventures in the chondroitin sulfate market.
Key Industry Developments:
- In April 2025, Gnosis by Lesaffre revealed a rebranding of its chondroitin sulfate product, renaming Mythocondro to MyCondro to better highlight its effectiveness to consumers and introducing a new logo.
- In April 2024, Borsch Med Pte Ltd, a health and nutrition-focused company, announced a collaboration with Zeria Pharmaceutical Co. Ltd., appointing Zeria as the authorized distributor of its chondroitin-based products in Singapore.
- In May 2024, BRF SA, a major biopharmaceutical and nutraceutical producer of chondroitin sulfate, signed a strategic supply agreement with the Saudi Agricultural and Livestock Investment Company (SALIC), granting SALIC the option to source up to 200,000 pounds of products annually to strengthen Saudi Arabia’s emergency food security efforts.
Companies Covered in Chondroitin Sulfate Market
- TSI Group Ltd.,
- Solabia Group
- AcerChem International Inc.
- Seikagaku Corporation
- Jiaxing Hengjie Biopharmaceutical Co., Ltd
- Aoxing Biotechnology Intl Co., Limited
- Stanford Chemicals
- Shanghai JBiChem International Trading Co.,Ltd.
- Sioux Pharm, Inc.
- Pacific Rainbow International, Inc.
- Synutra, Inc
- Zeria Pharmaceutical Co., Ltd.
- Summit Nutritionals International, Inc.
- Yantai Ruikangda Biochemical Products Co., Ltd.
- Others
Frequently Asked Questions
The market is estimated to be valued at US$ 757.5 Mn in 2026.
Rising osteoarthritis prevalence, aging populations, dietary supplement demand, pharmaceutical applications, sports nutrition growth, and joint-health awareness.
The global market is expected to witness a CAGR of 4.4% between 2026 and 2033.
The top players are TSI Group Ltd. Synutra, Inc., Bioiberica, Sanxin Group, Sino Siam Biotechnique Co., Ltd.
North America is the leading region in the global chondroitin sulfate market.


