

- Executive Summary
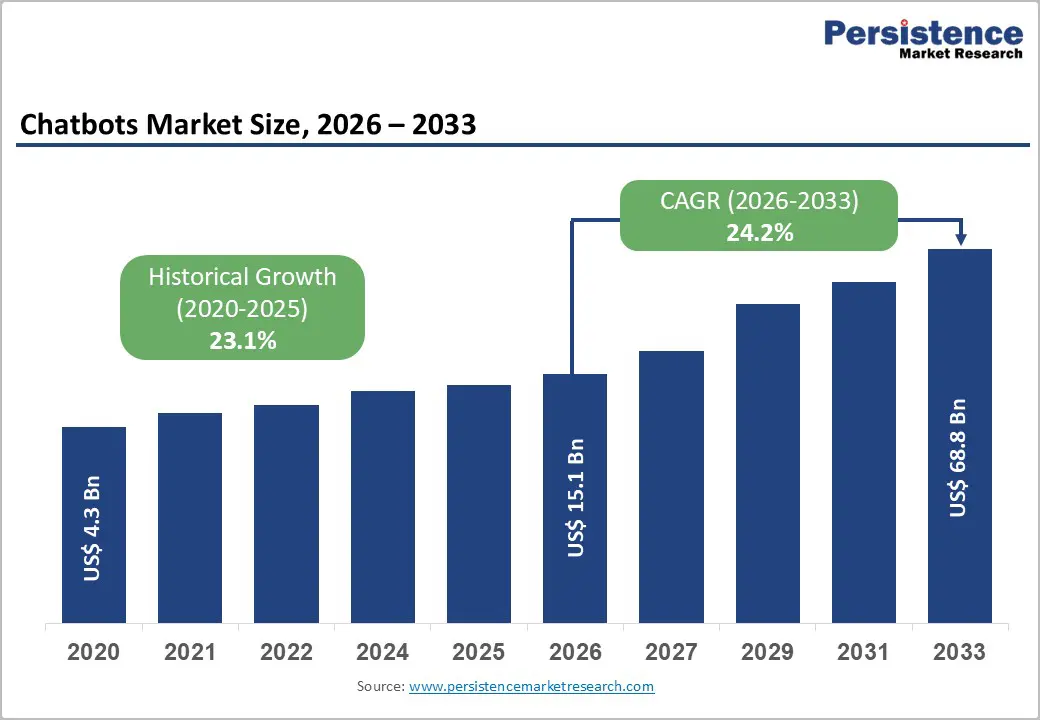
- Global Chatbots Market Snapshot 2026 and 2033
- Market Opportunity Assessment, 2026-2033, US$ Bn
- Key Market Trends
- Industry Developments and Key Market Events
- Demand Side and Supply Side Analysis
- PMR Analysis and Recommendations
- Market Overview
- Market Scope and Definitions
- Market Dynamics
- Driver
- Restraint
- Opportunities
- Trends
- Macro-Economic Factors
- Global GDP Outlook
- Global Prison Growth Outlook
- Global Crime Rates by Country
- Global Prison Population by Country
- Global Private Prison Market Growth Outlook
- Other Macro-economic Factors
- Forecast Factors – Relevance and Impact
- COVID-19 Impact Assessment
- Value Added Insights
- Value Chain analysis
- Key Market Players
- Product Adoption Analysis
- Key Promotional Strategies by key players
- PESTLE Analysis
- Porter's Five Forces Analysis
- Regulatory and Technology Landscape
- Price Trend Analysis, 2025
- Region-wise Price Analysis
- Price by Segments
- Price Impact Factors
- Global Chatbots Market Outlook: Historical (2020 – 2025) and Forecast (2026 – 2033)
- Key Highlights
- Global Chatbots Market Outlook: Component
- Introduction/Key Findings
- Historical Market Size (US$ Bn) and Volume (Units) Analysis by Component, 2020-2025
- Current Market Size (US$ Bn) and Volume (Units) Forecast, by Component, 2026-2033
- Solutions
- Standalone Chatbot Platforms
- Web‑based Chatbot Solutions
- Messaging‑based Chatbot Solutions
- Voicebot / Video Chatbot Solutions
- Services
- Professional Services
- Managed Services
- Support & Maintenance
- Solutions
- Market Attractiveness Analysis: Component
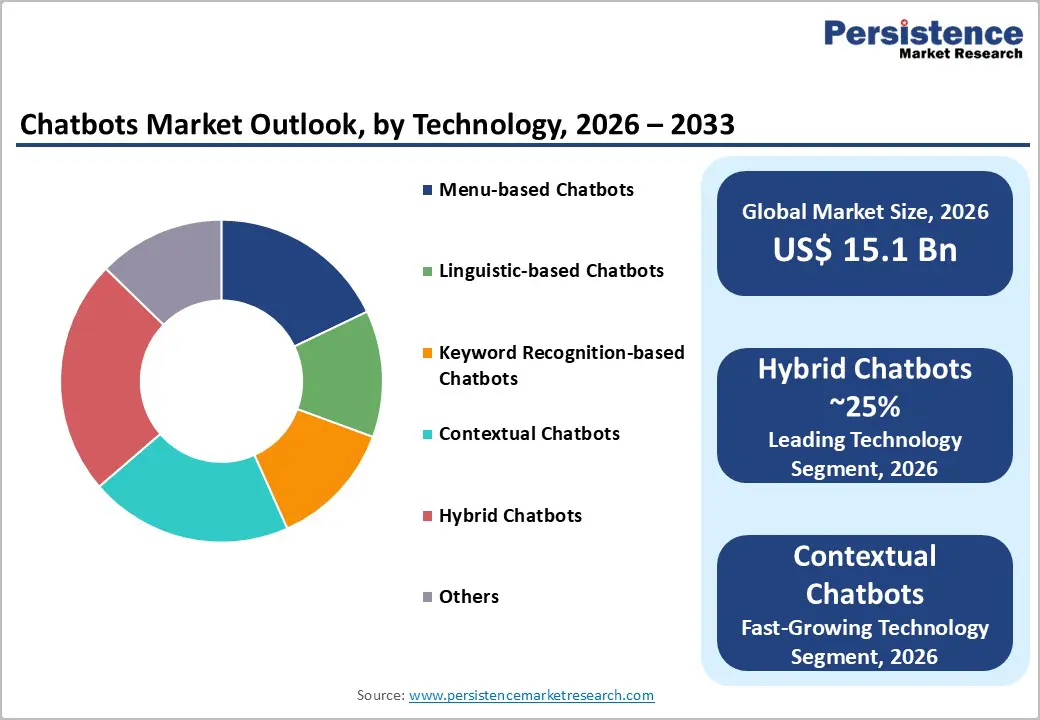
- Global Chatbots Market Outlook: Technology
- Introduction/Key Findings
- Historical Market Size (US$ Bn) and Volume (Units) Analysis by Technology, 2020-2025
- Current Market Size (US$ Bn) and Volume (Units) Forecast, by Technology, 2026-2033
- Menu‑based Chatbots
- Linguistic‑based Chatbots
- Keyword Recognition‑based Chatbots
- Contextual Chatbots
- Hybrid Chatbots
- Others
- Market Attractiveness Analysis: Technology
- Global Chatbots Market Outlook: Application
- Introduction/Key Findings
- Historical Market Size (US$ Bn) and Volume (Units) Analysis by Application, 2020-2025
- Current Market Size (US$ Bn) and Volume (Units) Forecast, by Application, 2026-2033
- Websites
- Mobile Applications
- Contact Centers
- Social Media Platforms
- Enterprise Messaging Apps
- Market Attractiveness Analysis: Application
- Global Chatbots Market Outlook: Enterprise Size
- Introduction/Key Findings
- Historical Market Size (US$ Bn) and Volume (Units) Analysis by Enterprise Size, 2020-2025
- Current Market Size (US$ Bn) and Volume (Units) Forecast, by Enterprise Size, 2026-2033
- Large Enterprises
- Small & Medium Enterprises (SMEs)
- Market Attractiveness Analysis: Enterprise Size
- Global Chatbots Market Outlook: Industry Vertical
- Introduction/Key Findings
- Historical Market Size (US$ Bn) and Volume (Units) Analysis by Industry Vertical, 2020-2025
- Current Market Size (US$ Bn) and Volume (Units) Forecast, by Industry Vertical, 2026-2033
- BFSI (Banking, Financial Services & Insurance)
- Retail & eCommerce
- Information Technology & Telecom
- Healthcare & Life Sciences
- Travel & Hospitality
- Media & Entertainment
- Government & Public Sector
- Others
- Market Attractiveness Analysis: Industry Vertical
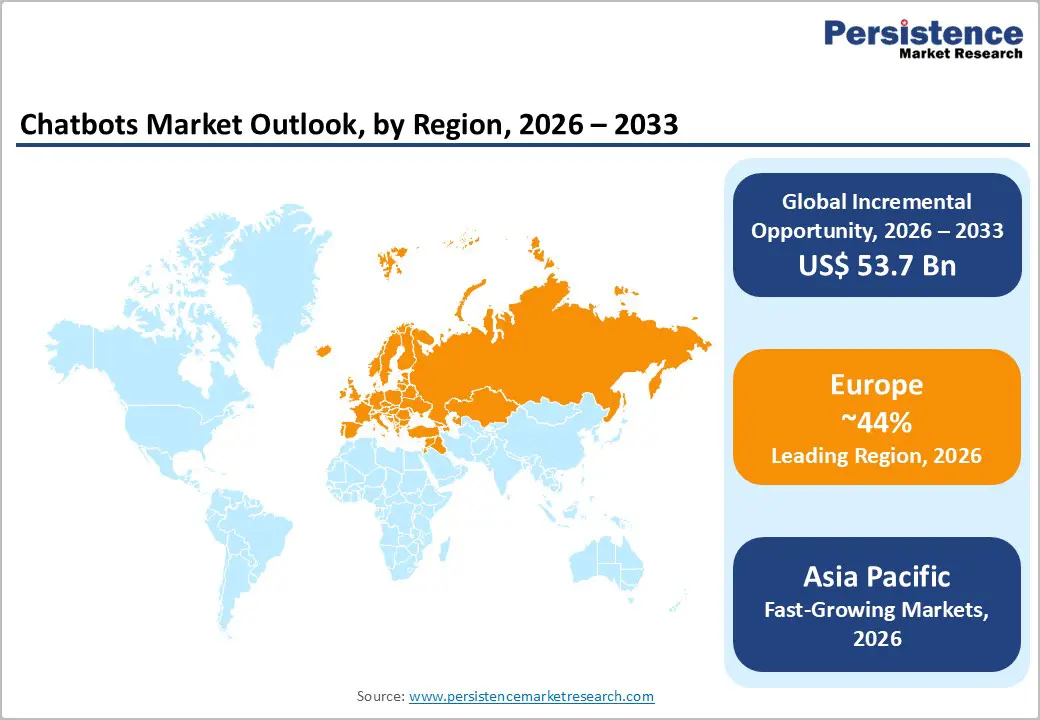
- Global Chatbots Market Outlook: Region
- Key Highlights
- Historical Market Size (US$ Bn) and Volume (Units) Analysis by Region, 2020-2025
- Current Market Size (US$ Bn) and Volume (Units) Forecast, by Region, 2026-2033
- North America
- Europe
- East Asia
- South Asia & Oceania
- Latin America
- Middle East & Africa
- Market Attractiveness Analysis: Region
- North America Chatbots Market Outlook: Historical (2020 – 2025) and Forecast (2026 – 2033)
- Key Highlights
- Pricing Analysis
- North America Market Size (US$ Bn) and Volume (Units) Forecast, by Country, 2026-2033
- U.S.
- Canada
- North America Market Size (US$ Bn) and Volume (Units) Forecast, by Component, 2026-2033
- Solutions
- Standalone Chatbot Platforms
- Web‑based Chatbot Solutions
- Messaging‑based Chatbot Solutions
- Voicebot / Video Chatbot Solutions
- Services
- Professional Services
- Managed Services
- Support & Maintenance
- Solutions
- North America Market Size (US$ Bn) and Volume (Units) Forecast, by Technology, 2026-2033
- Menu‑based Chatbots
- Linguistic‑based Chatbots
- Keyword Recognition‑based Chatbots
- Contextual Chatbots
- Hybrid Chatbots
- Others
- North America Market Size (US$ Bn) and Volume (Units) Forecast, by Application, 2026-2033
- Websites
- Mobile Applications
- Contact Centers
- Social Media Platforms
- Enterprise Messaging Apps
- North America Market Size (US$ Bn) and Volume (Units) Forecast, by Enterprise Size, 2026-2033
- Large Enterprises
- Small & Medium Enterprises (SMEs)
- North America Market Size (US$ Bn) and Volume (Units) Forecast, by Industry Vertical, 2026-2033
- BFSI (Banking, Financial Services & Insurance)
- Retail & eCommerce
- Information Technology & Telecom
- Healthcare & Life Sciences
- Travel & Hospitality
- Media & Entertainment
- Government & Public Sector
- Others
- Europe Chatbots Market Outlook: Historical (2020 – 2025) and Forecast (2026 – 2033)
- Key Highlights
- Pricing Analysis
- Europe Market Size (US$ Bn) and Volume (Units) Forecast, by Country, 2026-2033
- Germany
- Italy
- France
- U.K.
- Spain
- Russia
- Rest of Europe
- Europe Market Size (US$ Bn) and Volume (Units) Forecast, by Component, 2026-2033
- Solutions
- Standalone Chatbot Platforms
- Web‑based Chatbot Solutions
- Messaging‑based Chatbot Solutions
- Voicebot / Video Chatbot Solutions
- Services
- Professional Services
- Managed Services
- Support & Maintenance
- Solutions
- Europe Market Size (US$ Bn) and Volume (Units) Forecast, by Technology, 2026-2033
- Menu‑based Chatbots
- Linguistic‑based Chatbots
- Keyword Recognition‑based Chatbots
- Contextual Chatbots
- Hybrid Chatbots
- Others
- Europe Market Size (US$ Bn) and Volume (Units) Forecast, by Application, 2026-2033
- Websites
- Mobile Applications
- Contact Centers
- Social Media Platforms
- Enterprise Messaging Apps
- Europe Market Size (US$ Bn) and Volume (Units) Forecast, by Enterprise Size, 2026-2033
- Large Enterprises
- Small & Medium Enterprises (SMEs)
- Europe Market Size (US$ Bn) and Volume (Units) Forecast, by Industry Vertical, 2026-2033
- BFSI (Banking, Financial Services & Insurance)
- Retail & eCommerce
- Information Technology & Telecom
- Healthcare & Life Sciences
- Travel & Hospitality
- Media & Entertainment
- Government & Public Sector
- Others
- East Asia Chatbots Market Outlook: Historical (2020 – 2025) and Forecast (2026 – 2033)
- Key Highlights
- Pricing Analysis
- East Asia Market Size (US$ Bn) and Volume (Units) Forecast, by Country, 2026-2033
- China
- Japan
- South Korea
- East Asia Market Size (US$ Bn) and Volume (Units) Forecast, by Component, 2026-2033
- Solutions
- Standalone Chatbot Platforms
- Web‑based Chatbot Solutions
- Messaging‑based Chatbot Solutions
- Voicebot / Video Chatbot Solutions
- Services
- Professional Services
- Managed Services
- Support & Maintenance
- Solutions
- East Asia Market Size (US$ Bn) and Volume (Units) Forecast, by Technology, 2026-2033
- Menu‑based Chatbots
- Linguistic‑based Chatbots
- Keyword Recognition‑based Chatbots
- Contextual Chatbots
- Hybrid Chatbots
- Others
- East Asia Market Size (US$ Bn) and Volume (Units) Forecast, by Application, 2026-2033
- Websites
- Mobile Applications
- Contact Centers
- Social Media Platforms
- Enterprise Messaging Apps
- East Asia Market Size (US$ Bn) and Volume (Units) Forecast, by Enterprise Size, 2026-2033
- Large Enterprises
- Small & Medium Enterprises (SMEs)
- East Asia Market Size (US$ Bn) and Volume (Units) Forecast, by Industry Vertical, 2026-2033
- BFSI (Banking, Financial Services & Insurance)
- Retail & eCommerce
- Information Technology & Telecom
- Healthcare & Life Sciences
- Travel & Hospitality
- Media & Entertainment
- Government & Public Sector
- Others
- South Asia & Oceania Chatbots Market Outlook: Historical (2020 – 2025) and Forecast (2026 – 2033)
- Key Highlights
- Pricing Analysis
- South Asia & Oceania Market Size (US$ Bn) and Volume (Units) Forecast, by Country, 2026-2033
- India
- Southeast Asia
- ANZ
- Rest of SAO
- South Asia & Oceania Market Size (US$ Bn) and Volume (Units) Forecast, by Component, 2026-2033
- Solutions
- Standalone Chatbot Platforms
- Web‑based Chatbot Solutions
- Messaging‑based Chatbot Solutions
- Voicebot / Video Chatbot Solutions
- Services
- Professional Services
- Managed Services
- Support & Maintenance
- Solutions
- South Asia & Oceania Market Size (US$ Bn) and Volume (Units) Forecast, by Technology, 2026-2033
- Menu‑based Chatbots
- Linguistic‑based Chatbots
- Keyword Recognition‑based Chatbots
- Contextual Chatbots
- Hybrid Chatbots
- Others
- South Asia & Oceania Market Size (US$ Bn) and Volume (Units) Forecast, by Application, 2026-2033
- Websites
- Mobile Applications
- Contact Centers
- Social Media Platforms
- Enterprise Messaging Apps
- South Asia & Oceania Market Size (US$ Bn) and Volume (Units) Forecast, by Enterprise Size, 2026-2033
- Large Enterprises
- Small & Medium Enterprises (SMEs)
- South Asia & Oceania Market Size (US$ Bn) and Volume (Units) Forecast, by Industry Vertical, 2026-2033
- BFSI (Banking, Financial Services & Insurance)
- Retail & eCommerce
- Information Technology & Telecom
- Healthcare & Life Sciences
- Travel & Hospitality
- Media & Entertainment
- Government & Public Sector
- Others
- Latin America Chatbots Market Outlook: Historical (2020 – 2025) and Forecast (2026 – 2033)
- Key Highlights
- Pricing Analysis
- Latin America Market Size (US$ Bn) and Volume (Units) Forecast, by Country, 2026-2033
- Brazil
- Mexico
- Rest of LATAM
- Latin America Market Size (US$ Bn) and Volume (Units) Forecast, by Component, 2026-2033
- Solutions
- Standalone Chatbot Platforms
- Web‑based Chatbot Solutions
- Messaging‑based Chatbot Solutions
- Voicebot / Video Chatbot Solutions
- Services
- Professional Services
- Managed Services
- Support & Maintenance
- Solutions
- Latin America Market Size (US$ Bn) and Volume (Units) Forecast, by Technology, 2026-2033
- Menu‑based Chatbots
- Linguistic‑based Chatbots
- Keyword Recognition‑based Chatbots
- Contextual Chatbots
- Hybrid Chatbots
- Others
- Latin America Market Size (US$ Bn) and Volume (Units) Forecast, by Application, 2026-2033
- Websites
- Mobile Applications
- Contact Centers
- Social Media Platforms
- Enterprise Messaging Apps
- Latin America Market Size (US$ Bn) and Volume (Units) Forecast, by Enterprise Size, 2026-2033
- Large Enterprises
- Small & Medium Enterprises (SMEs)
- Latin America Market Size (US$ Bn) and Volume (Units) Forecast, by Industry Vertical, 2026-2033
- BFSI (Banking, Financial Services & Insurance)
- Retail & eCommerce
- Information Technology & Telecom
- Healthcare & Life Sciences
- Travel & Hospitality
- Media & Entertainment
- Government & Public Sector
- Others
- Middle East & Africa Chatbots Market Outlook: Historical (2020 – 2025) and Forecast (2026 – 2033)
- Key Highlights
- Pricing Analysis
- Middle East & Africa Market Size (US$ Bn) and Volume (Units) Forecast, by Country, 2026-2033
- GCC Countries
- South Africa
- Northern Africa
- Rest of MEA
- Middle East & Africa Market Size (US$ Bn) and Volume (Units) Forecast, by Component, 2026-2033
- Solutions
- Standalone Chatbot Platforms
- Web‑based Chatbot Solutions
- Messaging‑based Chatbot Solutions
- Voicebot / Video Chatbot Solutions
- Services
- Professional Services
- Managed Services
- Support & Maintenance
- Solutions
- Middle East & Africa Market Size (US$ Bn) and Volume (Units) Forecast, by Technology, 2026-2033
- Menu‑based Chatbots
- Linguistic‑based Chatbots
- Keyword Recognition‑based Chatbots
- Contextual Chatbots
- Hybrid Chatbots
- Others
- Middle East & Africa Market Size (US$ Bn) and Volume (Units) Forecast, by Application, 2026-2033
- Websites
- Mobile Applications
- Contact Centers
- Social Media Platforms
- Enterprise Messaging Apps
- Middle East & Africa Market Size (US$ Bn) and Volume (Units) Forecast, by Enterprise Size, 2026-2033
- Large Enterprises
- Small & Medium Enterprises (SMEs)
- Middle East & Africa Market Size (US$ Bn) and Volume (Units) Forecast, by Industry Vertical, 2026-2033
- BFSI (Banking, Financial Services & Insurance)
- Retail & eCommerce
- Information Technology & Telecom
- Healthcare & Life Sciences
- Travel & Hospitality
- Media & Entertainment
- Government & Public Sector
- Others
- Competition Landscape
- Market Share Analysis, 2025
- Market Structure
- Competition Intensity Mapping
- Competition Dashboard
- Company Profiles
- OpenAI
- Company Overview
- Product Portfolio/Offerings
- Key Financials
- SWOT Analysis
- Company Strategy and Key Developments
- Microsoft
- Amazon Web Services (AWS)
- IBM
- Salesforce
- Meta
- Baidu
- Oracle
- LivePerson
- Yellow.ai
- Kore.ai
- Intercom
- ManyChat
- Aivo
- OpenAI
- Appendix
- Research Methodology
- Research Assumptions
- Acronyms and Abbreviations


