

- Executive Summary
- Global Bulletproof Security Glass Market Snapshot 2025 and 2032
- Market Opportunity Assessment, 2025-2032, US$ Bn
- Key Market Trends
- Industry Developments and Key Market Events
- Demand Side and Supply Side Analysis
- PMR Analysis and Recommendations
- Market Overview
- Market Scope and Definitions
- Value Chain Analysis
- Macro-Economic Factors
- Global GDP Outlook
- Global Automotive Industry Overview
- Global Defense & Military Sales by Vehicle Type
- Forecast Factors – Relevance and Impact
- COVID-19 Impact Assessment
- PESTLE Analysis
- Porter's Five Forces Analysis
- Geopolitical Tensions: Market Impact
- Regulatory and Technology Landscape
- Market Dynamics
- Drivers
- Restraints
- Opportunities
- Trends
- Price Trend Analysis, 2019 – 2032
- Region-wise Price Analysis
- Price by Segments
- Price Impact Factors
- Global Bulletproof Security Glass Market Outlook:
- Key Highlights
- Global Bulletproof Security Glass Market Outlook: Glass Type
- Introduction/Key Findings
- Historical Market Size (US$ Bn) and Volume (Units) Analysis by Glass Type, 2019-2023
- Current Market Size (US$ Bn) and Volume (Units) Analysis and Forecast, by Glass Type, 2025-2032
- Acrylic
- Polycarbonate
- Glass-clad polycarbonate
- Laminated glass
- Ballistic glass
- Market Attractiveness Analysis: Glass Type
- Global Bulletproof Security Glass Market Outlook: Protection Level
- Introduction/Key Findings
- Historical Market Size (US$ Bn) and Volume (Units) Analysis by Protection Level, 2019-2023
- Current Market Size (US$ Bn) and Volume (Units) Analysis and Forecast, by Protection Level, 2025-2032
- Level I–III
- Level IV and above
- Market Attractiveness Analysis: Protection Level
- Global Bulletproof Security Glass Market Outlook: Industry
- Introduction/Key Findings
- Historical Market Size (US$ Bn) and Volume (Units) Analysis by Industry, 2019-2023
- Current Market Size (US$ Bn) and Volume (Units) Analysis and Forecast, by Industry, 2025-2032
- Defense & Military
- Banking & Finance
- Automotive
- Building & Construction
- Transportation & Infrastructure
- Others
- Market Attractiveness Analysis: Industry
- Global Bulletproof Security Glass Market Outlook: Region
- Key Highlights
- Historical Market Size (US$ Bn) and Volume (Units) Analysis by Region, 2019-2023
- Current Market Size (US$ Bn) and Volume (Units) Analysis and Forecast, by Region, 2025-2032
- North America
- Europe
- East Asia
- South Asia & Oceania
- Latin America
- Middle East & Africa
- Market Attractiveness Analysis: Region
- North America Bulletproof Security Glass Market Outlook:
- Key Highlights
- Pricing Analysis
- North America Market Size (US$ Bn) and Volume (Units) Analysis and Forecast, by Country, 2025-2032
- U.S.
- Canada
- North America Market Size (US$ Bn) and Volume (Units) Analysis and Forecast, by Glass Type, 2025-2032
- Acrylic
- Polycarbonate
- Glass-clad polycarbonate
- Laminated glass
- Ballistic glass
- North America Market Size (US$ Bn) and Volume (Units) Analysis and Forecast, by Protection Level, 2025-2032
- Level I–III
- Level IV and above
- North America Market Size (US$ Bn) and Volume (Units) Analysis and Forecast, by Industry, 2025-2032
- Defense & Military
- Banking & Finance
- Automotive
- Building & Construction
- Transportation & Infrastructure
- Others
- Europe Bulletproof Security Glass Market Outlook:
- Key Highlights
- Pricing Analysis
- Europe Market Size (US$ Bn) and Volume (Units) Analysis and Forecast, by Country, 2025-2032
- Germany
- Italy
- France
- U.K.
- Spain
- Russia
- Rest of Europe
- Europe Market Size (US$ Bn) and Volume (Units) Analysis and Forecast, by Glass Type, 2025-2032
- Acrylic
- Polycarbonate
- Glass-clad polycarbonate
- Laminated glass
- Ballistic glass
- Europe Market Size (US$ Bn) and Volume (Units) Analysis and Forecast, by Protection Level, 2025-2032
- Level I–III
- Level IV and above
- Europe Market Size (US$ Bn) and Volume (Units) Analysis and Forecast, by Industry, 2025-2032
- Defense & Military
- Banking & Finance
- Automotive
- Building & Construction
- Transportation & Infrastructure
- Others
- East Asia Bulletproof Security Glass Market Outlook:
- Key Highlights
- Pricing Analysis
- East Asia Market Size (US$ Bn) and Volume (Units) Analysis and Forecast, by Country, 2025-2032
- China
- Japan
- South Korea
- East Asia Market Size (US$ Bn) and Volume (Units) Analysis and Forecast, by Glass Type, 2025-2032
- Acrylic
- Polycarbonate
- Glass-clad polycarbonate
- Laminated glass
- Ballistic glass
- East Asia Market Size (US$ Bn) and Volume (Units) Analysis and Forecast, by Protection Level, 2025-2032
- Level I–III
- Level IV and above
- East Asia Market Size (US$ Bn) and Volume (Units) Analysis and Forecast, by Industry, 2025-2032
- Defense & Military
- Banking & Finance
- Automotive
- Building & Construction
- Transportation & Infrastructure
- Others
- South Asia & Oceania Bulletproof Security Glass Market Outlook:
- Key Highlights
- Pricing Analysis
- South Asia & Oceania Market Size (US$ Bn) and Volume (Units) Analysis and Forecast, by Country, 2025-2032
- India
- Southeast Asia
- ANZ
- Rest of SAO
- South Asia & Oceania Market Size (US$ Bn) and Volume (Units) Analysis and Forecast, by Glass Type, 2025-2032
- Acrylic
- Polycarbonate
- Glass-clad polycarbonate
- Laminated glass
- Ballistic glass
- South Asia & Oceania Market Size (US$ Bn) and Volume (Units) Analysis and Forecast, by Protection Level, 2025-2032
- Level I–III
- Level IV and above
- South Asia & Oceania Market Size (US$ Bn) and Volume (Units) Analysis and Forecast, by Industry, 2025-2032
- Defense & Military
- Banking & Finance
- Automotive
- Building & Construction
- Transportation & Infrastructure
- Others
- Latin America Bulletproof Security Glass Market Outlook:
- Key Highlights
- Pricing Analysis
- Latin America Market Size (US$ Bn) and Volume (Units) Analysis and Forecast, by Country, 2025-2032
- Brazil
- Mexico
- Rest of LATAM
- Latin America Market Size (US$ Bn) and Volume (Units) Analysis and Forecast, by Glass Type, 2025-2032
- Acrylic
- Polycarbonate
- Glass-clad polycarbonate
- Laminated glass
- Ballistic glass
- Latin America Market Size (US$ Bn) and Volume (Units) Analysis and Forecast, by Protection Level, 2025-2032
- Level I–III
- Level IV and above
- Latin America Market Size (US$ Bn) and Volume (Units) Analysis and Forecast, by Industry, 2025-2032
- Defense & Military
- Banking & Finance
- Automotive
- Building & Construction
- Transportation & Infrastructure
- Others
- Middle East & Africa Bulletproof Security Glass Market Outlook:
- Key Highlights
- Pricing Analysis
- Middle East & Africa Market Size (US$ Bn) and Volume (Units) Analysis and Forecast, by Country, 2025-2032
- GCC Countries
- South Africa
- Northern Africa
- Rest of MEA
- Middle East & Africa Market Size (US$ Bn) and Volume (Units) Analysis and Forecast, by Glass Type, 2025-2032
- Acrylic
- Polycarbonate
- Glass-clad polycarbonate
- Laminated glass
- Ballistic glass
- Middle East & Africa Market Size (US$ Bn) and Volume (Units) Analysis and Forecast, by Protection Level, 2025-2032
- Level I–III
- Level IV and above
- Middle East & Africa Market Size (US$ Bn) and Volume (Units) Analysis and Forecast, by Industry, 2025-2032
- Defense & Military
- Banking & Finance
- Automotive
- Building & Construction
- Transportation & Infrastructure
- Others
- Competition Landscape
- Market Share Analysis, 2025
- Market Structure
- Competition Intensity Mapping
- Competition Dashboard
- Company Profiles
- Insulgard Security Products
- Company Overview
- Product Portfolio/Offerings
- Key Financials
- SWOT Analysis
- Company Strategy and Key Developments
- Nippon Sheet Glass Co., Ltd
- SILATEC GmbH
- DefenseLite
- Essar Sons
- Armortex
- Qinhuangdao LianYiDing Glass Co., Ltd
- Glasswerks
- Marvel Glass Private Limited
- Jersey Tempered Glass, Inc.
- Vetrotech Saint-Gobain International AG.
- Rider Glass Company Limited
- armass glass
- Liaoning EO Technology Co.,Ltd
- United States Bullet Proofing, Inc. A23:A35
- Insulgard Security Products
- Appendix
- Research Methodology
- Research Assumptions
- Acronyms and Abbreviations


- Advanced Materials
- Bulletproof Security Glass Market
Bulletproof Security Glass Market Trends, Size, Share, Growth, and Forecasts, 2025 - 2032
Bulletproof Security Glass Market by Glass Type (Acrylic, Polycarbonate, Glass-clad polycarbonate, Laminated glass, Ballistic glass), By Protection Level (Level I–III, Level IV and above), By Industry (Defense & Military, Banking & Finance, Automotive, Building & Construction, Transportation & Infrastructure, Others), and Regional Analysis for 2025 - 2032
Bulletproof Security Glass Market Share and Trends Analysis
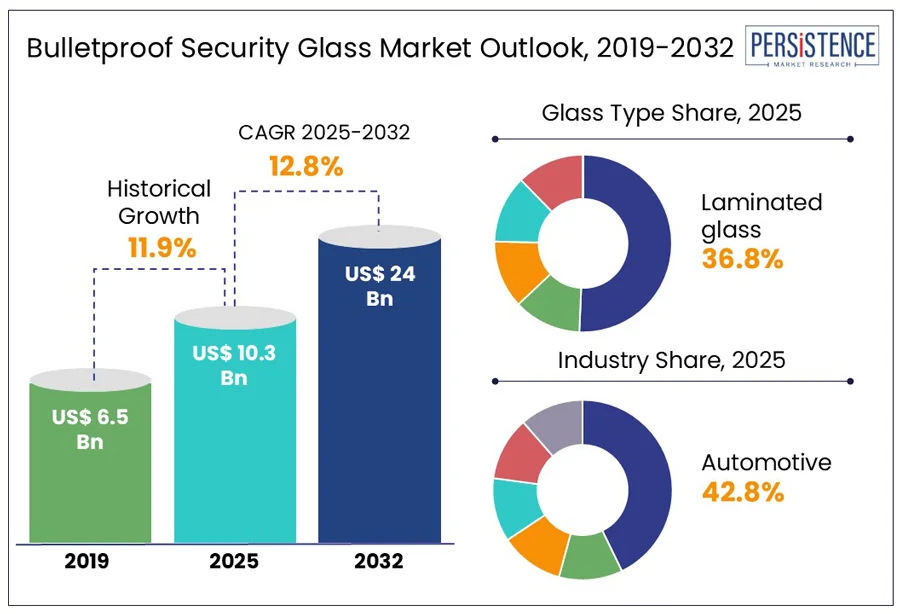
The global bulletproof security glass market size is projected to grow from US$ 10.3 billion in 2025 to US$ 24.0 billion, achieving a CAGR of 12.8% by 2032. According to the Persistence Market Research report, the global industry is gaining significant attention due to the rise in VIP culture in metro cities and emphasis on personal safety of VIPs. Bulletproof glass, also known as ballistic or security glass, is designed to resist penetration from bullets and other high-velocity projectiles, providing essential protection in both civilian and military settings. This type of glass is used in a variety of applications, including automotive, construction, defense, and public infrastructure, where the safety of personnel and assets is crucial.
Factors such as urbanization, rising geopolitical tensions, and a growing threat from terrorism and violent crime have heightened the demand for advanced security solutions. Technological advancements in glass manufacturing have improved the durability, clarity, and weight of bulletproof glass, making it suitable for a wider range of uses. As both governments and the private sectors focus on protective measures, innovation and safety applications drives demand. The increasing focus on integrating smart security features positions bulletproof glass as a vital component in modern safety architectures around the globe.
Key Industry Highlights
- Bulletproof glass is extensively utilized in the automotive, construction, defense, and public infrastructure sectors to provide enhanced protection.
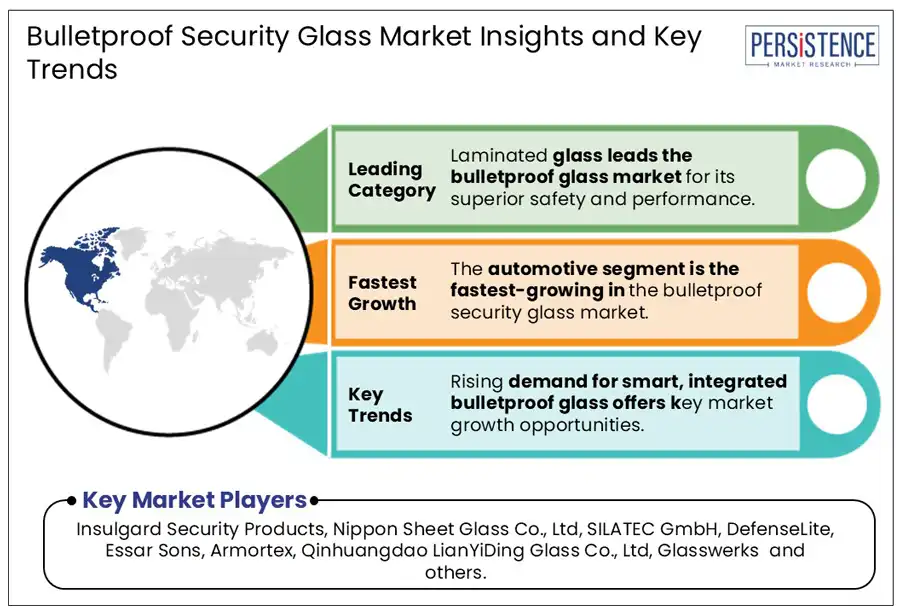
- Laminated glass remains the top choice due to its superior multi-layered ballistic resistance and durability.
- Increasing geopolitical tensions and civil unrest are driving a global demand for advanced security glazing solutions.
- Europe is prioritizing anti-terrorism initiatives, which is accelerating the integration of bulletproof glass in public transit hubs and government buildings.
- Technological advancements are leading to the development of lighter, more transparent, and stronger variants of bulletproof glass.
- The automotive sector is the fastest-growing segment, fueled by the rising use of bulletproof glass in armored vehicles and luxury cars.
- Collaborations between glass manufacturers and defense contractors are intensifying to create next-generation security glazing solutions.
|
Global Market Attribute |
Details |
|
Bulletproof Security Glass Market Size (2025E) |
US$ 10.3 Bn |
|
Market Value Forecast (2032F) |
US$ 24.0 Bn |
|
Projected Growth (CAGR 2025 to 2032) |
12.8% |
|
Historical Market Growth (CAGR 2019 to 2024) |
11.9% |
Market Dynamics
Drivers - Rising global geopolitical tensions and civil unrest fuel the need for advanced security glazing solutions
Rising global geopolitical tensions and civil unrest have been recognized as key drivers of increased demand for advanced security glazing solutions. Heightened conflicts and social disturbances have necessitated the implementation of enhanced protective measures across sectors such as government facilities, financial institutions, and public infrastructure. As a result, bulletproof security glass has been increasingly adopted to ensure safety against ballistic threats. Security concerns have been prioritized by organizations and authorities worldwide, prompting the widespread integration of these glazing solutions to protect personnel and assets from potential violence.
In 2025, Insulgard Security Products launched its Armor-Gard® SP412 and SP412-IG bullet-resistant glass-clad polycarbonate products to address rising needs. Engineered to withstand high-caliber threats, including .30 caliber rifle rounds, the SP412 series carries a UL 752 Level 4 rating, making it suitable for high-risk environments. These innovations reflect the industry's commitment to enhancing security infrastructure amid the ongoing global climate of instability and unrest.
Restraints - Complex installation requirements and retrofitting limitations in older buildings
Complex installation requirements and retrofitting limitations in older buildings are considered major restraints affecting the adoption of bulletproof security glass. Due to the heavy weight and thickness of ballistic glass, significant structural modifications are often required, which complicates the installation process. Additionally, many existing buildings lack the necessary framework to support such materials without extensive reinforcement.
This leads to prolonged installation timelines and increased project complexity, discouraging widespread use. Preservation regulations for heritage or historic structures further restrict the extent of modifications permitted, limiting retrofitting possibilities. Consequently, these technical and regulatory challenges have been identified as barriers that slow the integration of bulletproof security glazing, especially in older infrastructures, thereby hindering overall market expansion despite rising security demands.
Opportunity - Exponential demand for smart, integrated bulletproof glass in smart cities
The expanding demand for smart, integrated bulletproof glass has been recognized as a significant opportunity within the bulletproof-security-glass market. With the global implementation of smart city initiatives, the integration of advanced security features into building infrastructure has been increasingly prioritized. Bulletproof glass embedded with sensors and connected technologies is being developed to enhance real-time threat detection and response capabilities. Such innovations are being widely adopted to improve public safety in urban environments, including transportation hubs, hotels, and government facilities.
In 2025, Vetrotech Saint-Gobain’s VETROGARD Bullet product line, which offers customizable ballistic glass designed for high-risk areas. Compliant with India’s Bureau of Civil Aviation Security (BCAS) Aerocity norms, these solutions are being utilized to bolster security in locations such as airport-adjacent hotels. This convergence of safety and smart technology has been seen as a catalyst for product development, positioning market players like Vetrotech as leaders in delivering comprehensive protective solutions for modern urban infrastructures.
Category Wise Insights
Glass Type Insights
Laminated glass has been widely adopted as the leading segment in the bulletproof-security-glass market due to its superior performance and safety characteristics. Engineered by bonding multiple layers of glass with interlayers such as polyvinyl butyral (PVB) or ethylene-vinyl acetate (EVA), it is recognized for its enhanced ballistic resistance and ability to retain structural integrity upon impact. Its effectiveness in absorbing and dispersing energy from high-velocity projectiles has made it a preferred choice for both commercial and governmental security applications.
In 2025, Armortex, a leading manufacturer of bullet-resistant solutions, highlights the critical role of laminated glass in high-security settings. Their innovative approach underscores how vital this technology is for enhancing safety in vulnerable environments. Their laminated glass solutions are being implemented in courthouses, police stations, schools, corporate offices, military bases, and government buildings to provide durable, shatter-resistant protection. The continued adoption of these multi-layered systems has been driven by benefits such as sound insulation, UV protection, and long-term durability, solidifying laminated glass as a cornerstone of advanced security infrastructure.
End-use Insights
The automotive segment has emerged as the fastest-growing area within the bulletproof security glass market. This growth has been driven by increased demand for armored vehicles across military, law enforcement, and high-net-worth individual transport sectors. Bullet-resistant glass has been widely installed in both commercial and specialty vehicles to protect occupants from ballistic threats, riots, and targeted attacks. Rising geopolitical instability and global security concerns have accelerated the production of armored vehicles.
In 2025, Armass Glass, a manufacturer providing advanced bullet-resistant solutions tailored to various protection levels, from EN 1063 BR2 NS to BR7 NS. Their products have been discreetly integrated into models such as the LC300 and LX600, maintaining design aesthetics while ensuring high-level security. Enhanced optical clarity and material strength have been prioritized to deliver effective protection without compromising visibility or appearance, addressing evolving market demands.
Regional Insights
North America Bulletproof Security Glass Market Trends
In North America, the U.S. Bulletproof Security Glass Market has seen significant growth in demand for armored vehicles, largely driven by increased private sector investments in VIP and executive protection. Rising concerns over personal safety and targeted attacks have led high-net-worth individuals, corporate executives, and celebrities to prioritize enhanced security measures. Consequently, the customization of vehicles with advanced ballistic protection—such as bulletproof glass, armored panels, and blast-resistant features—has been widely adopted.
In 2025, INSULGARD Security Products offers UL-rated bullet-resistant windows and doors that have been integrated into custom armored vehicles, providing superior ballistic resistance and durability. These products have been rigorously tested to meet or exceed industry standards, ensuring optimal safety for high-profile clients. Companies specializing in luxury armored vehicles have increasingly offered bespoke solutions tailored to individual needs, reflecting a broader market shift toward personalized security. Insulgard’s commitment to quality and innovation has positioned it as a trusted partner in developing secure transportation for executives and dignitaries.
Europe Bulletproof Security Glass Market Trends
In Europe, the adoption of bulletproof glass in public transit hubs has been accelerated by increasing anti-terrorism initiatives in major cities. Unbreakable glass solutions, such as those developed by Hammerglass, have been widely installed in transportation infrastructures including bus shelters and train stations. Designed to withstand significant impacts, these products have been implemented to enhance security and ensure the protection of commuters and transit personnel.
By 2025, the trend of integrating advanced protective measures into urban infrastructure has reflected a growing commitment to fortifying public spaces against potential threats. The use of bullet-resistant glass has been recognized as a critical component in safeguarding high-traffic areas, aligning with broader regional strategies focused on urban safety and resilience. Hammerglass’s contribution to this initiative has exemplified the industry's response to evolving security needs, positioning their solutions as vital elements in Europe’s proactive approach to mitigating risks in densely populated environments.
Asia Pacific Bulletproof Security Glass Market Trends
In Asia Pacific, heightened border tensions have resulted in the increased deployment of ballistic glass across defense outposts and military vehicles. In India, the Border Security Force introduced a portable bulletproof bunker equipped with periscopic surveillance and constructed using thick armor and ballistic glass, allowing for flexible and fortified border vigilance. In 2025, the Republic of Korea Army has integrated bulletproof glass into its CS/VP3 Mine-Resistant Ambush Protected (MRAP) vehicles. These vehicles have been outfitted with multiple bulletproof windows and firing ports to ensure both personnel safety and operational effectiveness in high-risk areas.
Such advancements illustrate the region’s proactive response to the rise in geopolitical uncertainties. Investments in advanced security infrastructure have been prioritized to safeguard critical defense installations and personnel. These initiatives underscore a broader regional trend toward strengthening national security capabilities through the adoption of robust, mobile, and technologically enhanced ballistic protection solutions.
Competitive Landscape
The global bulletproof security glass market is characterized by a competitive landscape featuring several key players. Leading companies such as Saint-Gobain S.A., Nippon Sheet Glass Co., Ltd., and Asahi Glass Co., Ltd. dominate the market, leveraging their extensive experience and technological advancements to offer a wide range of bullet-resistant glass solutions. These manufacturers focus on product innovation, enhancing the strength, transparency, and weight of bulletproof glass to meet the evolving demands of various industries, including automotive, construction, and defense.
Strategic partnerships, mergers, and acquisitions are common strategies employed to expand market reach and diversify product offerings. For instance, Allegion plc's acquisition of Unicel Architectural Corp. in 2024 enriched its architectural solutions portfolio, potentially broadening its offerings in bulletproof glass. Additionally, companies are investing in research and development to create eco-friendly and cost-effective solutions, addressing both environmental concerns and market demand for sustainable products. This dynamic competitive environment fosters continuous innovation and growth within the bulletproof security glass sector.
Key Industry Developments
- In August 2024, U.S. Bullet Proofing has launched the BulletShield retrofit ballistic glazing system. This system is designed to be installed over existing windows, offering enhanced protection against ballistic threats without requiring full window replacements.
- In May 2024, DefenseLite has launched the BulletShield retrofit ballistic glazing system. This system is designed to be installed over existing windows, providing enhanced protection against ballistic threats without requiring full window replacements.
Companies Covered in Bulletproof Security Glass Market
- Insulgard Security Products
- Nippon Sheet Glass Co., Ltd
- SILATEC GmbH
- DefenseLite
- Essar Sons
- Armortex
- Qinhuangdao LianYiDing Glass Co., Ltd
- Glasswerks
- Marvel Glass Private Limited
- Jersey Tempered Glass, Inc.
- Vetrotech Saint-Gobain International AG.
- Rider Glass Company Limited
- armass glass
- Liaoning EO Technology Co.,Ltd
- United States Bullet Proofing, Inc.
Frequently Asked Questions
The global Bulletproof Security Glass Market is projected to be valued at 10.3 bn in 2025.
The Bulletproof Security Glass Market is driven by the rising global geopolitical tensions and civil unrest are boosting demand for advanced security glazing solutions.
The Bulletproof Security Glass Market is poised to witness a CAGR of 12.8% from 2025 to 2032.
Expanding demand for smart, integrated bulletproof glass in smart cities presents a lucrative opportunity is the key market opportunity.
Major players in the Bulletproof Security Glass Market include Insulgard Security Products, Nippon Sheet Glass Co., Ltd, SILATEC GmbH, DefenseLite, Essar Sons, Armortex, Qinhuangdao LianYiDing Glass Co., Ltd, Glasswerks, and others.


