


- Executive Summary
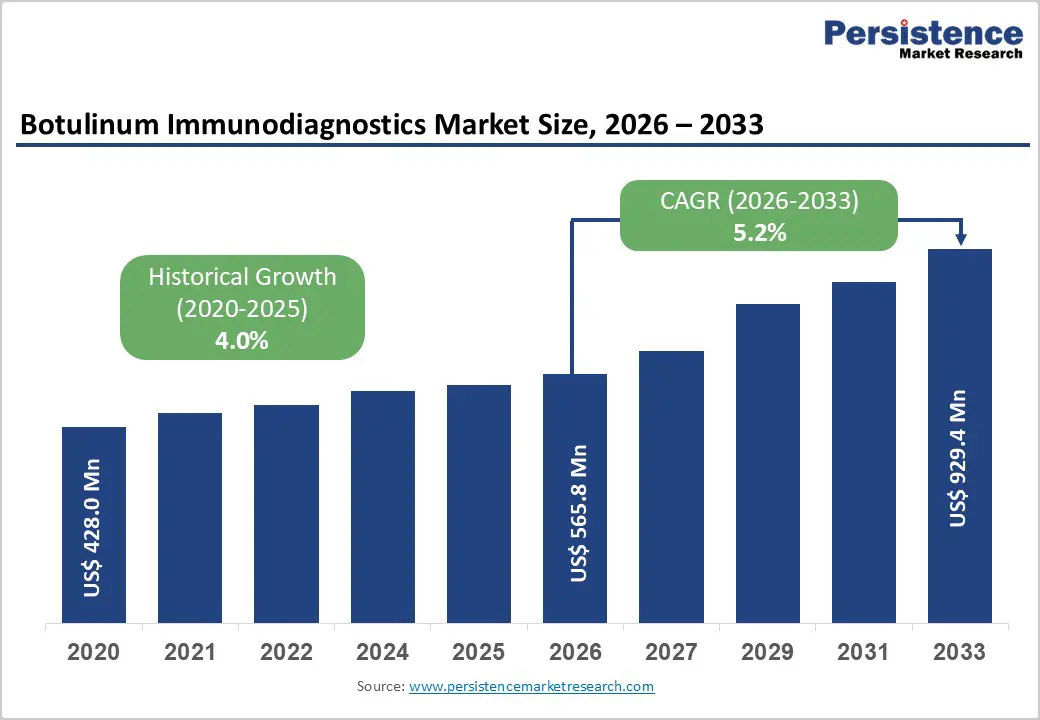
- Global Botulinum Immunodiagnostics Market Snapshot, 2026 and 2033
- Market Opportunity Assessment, 2026 – 2033, US$ Mn
- Key Market Trends
- Future Market Projections
- Premium Market Insights
- Industry Developments and Key Market Events
- PMR Analysis and Recommendations
- Market Overview
- Market Scope and Definition
- Market Dynamics
- Drivers
- Restraints
- Opportunity
- Key Trends
- Macro-Economic Factors
- Global Sectorial Outlook
- Global GDP Growth Outlook
- COVID-19 Impact Analysis
- Forecast Factors – Relevance and Impact
- Value Added Insights
- Product Adoption Analysis
- Recent Product Launches
- Regulatory Landscape
- Value Chain Analysis
- Key Deals and Mergers
- PESTLE Analysis
- Porter’s Five Force Analysis
- Price Trend Analysis, 2020 - 2033
- Key Highlights
- Key Factors Impacting Product Prices
- Pricing Analysis, By Product Technology
- Regional Prices and Product Preferences
- Global Botulinum Immunodiagnostics Market Outlook:
- Key Highlights
- Market Size (US$ Mn) and Y-o-Y Growth
- Absolute $ Opportunity
- Market Size (US$ Mn) Analysis and Forecast
- Historical Market Size (US$ Mn) Analysis, 2020-2025
- Market Size (US$ Mn) Analysis and Forecast, 2026–2033
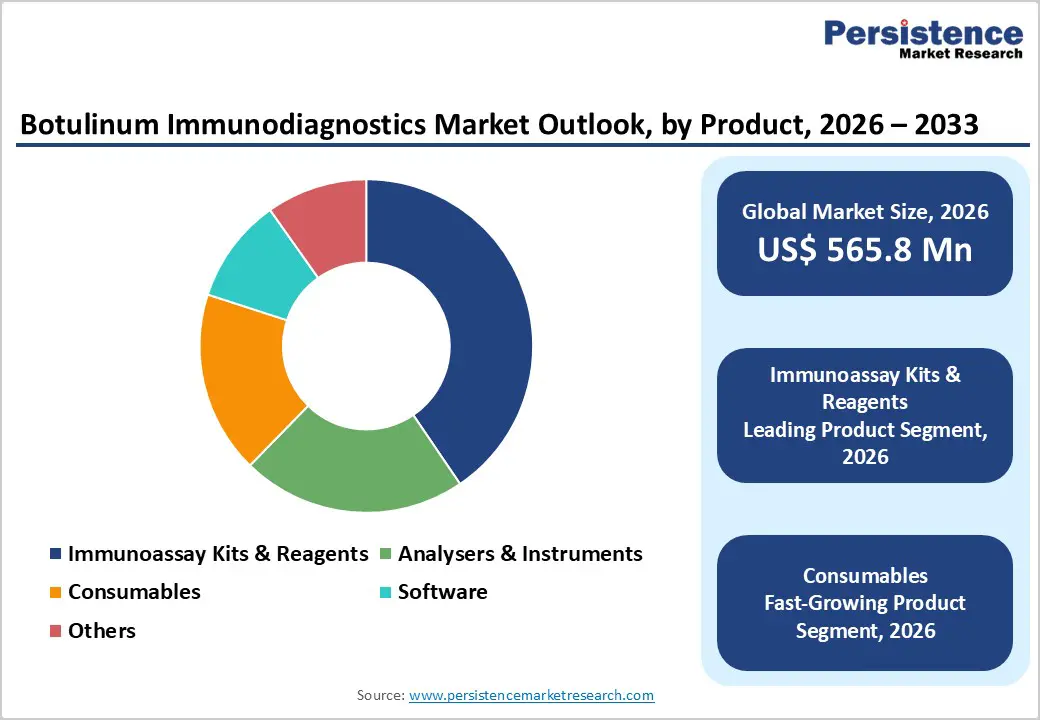
- Global Botulinum Immunodiagnostics Market Outlook: Product
- Introduction / Key Findings
- Historical Market Size (US$ Mn) Analysis and Volume (Units) Analysis, By Product, 2020 – 2025
- Market Size (US$ Mn) Analysis and Volume (Units) Analysis and Forecast, By Product, 2026 – 2033
- Immunoassay Kits & Reagents
- Analysers & Instruments
- Consumables
- Software
- Others
- Market Attractiveness Analysis: Product
- Global Botulinum Immunodiagnostics Market Outlook: Application
- Introduction / Key Findings
- Historical Market Size (US$ Mn) Analysis, By Application, 2020 – 2025
- Market Size (US$ Mn) Analysis and Forecast, By Application, 2026 – 2033
- Clinical Diagnostics
- Veterinary Diagnostics
- Environmental Testing
- Research & Development
- Others
- Market Attractiveness Analysis: Application
- Global Botulinum Immunodiagnostics Market Outlook: End User
- Introduction / Key Findings
- Historical Market Size (US$ Mn) Analysis, By End User, 2020 – 2025
- Market Size (US$ Mn) Analysis and Forecast, By End User, 2026 – 2033
- Hospitals
- Clinical Laboratories
- Veterinary Clinics
- Others
- Market Attractiveness Analysis: End User
- Key Highlights
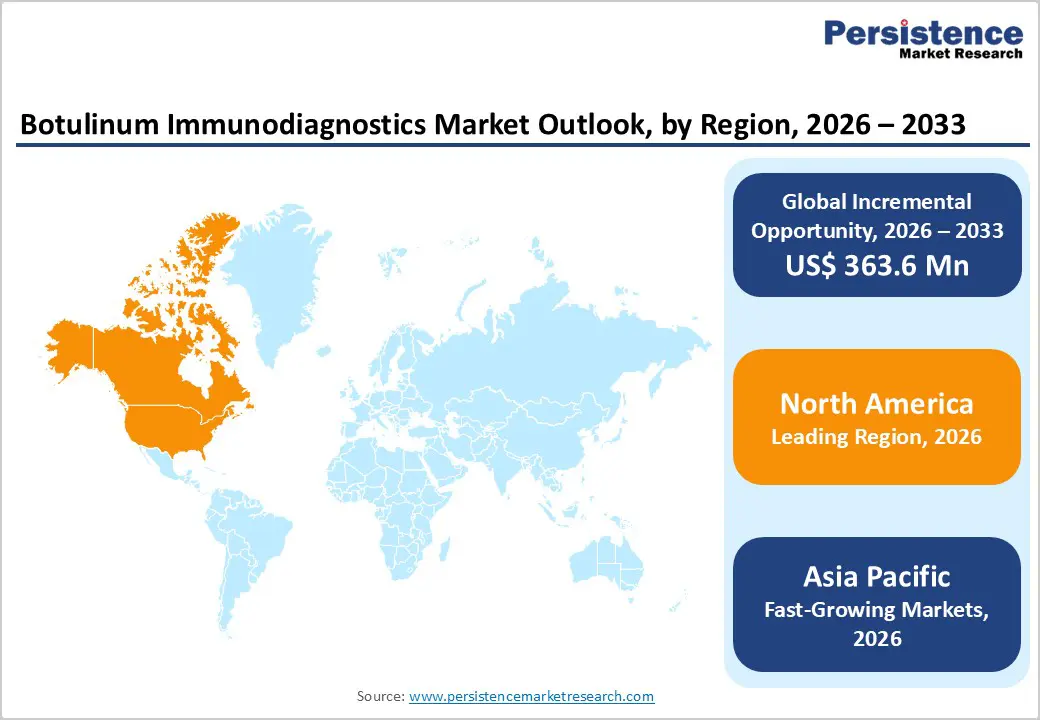
- Global Botulinum Immunodiagnostics Market Outlook: Region
- Key Highlights
- Historical Market Size (US$ Mn) Analysis, By Region, 2020 – 2025
- Market Size (US$ Mn) Analysis and Forecast, By Region, 2026 – 2033
- North America
- Europe
- East Asia
- South Asia and Oceania
- Latin America
- Middle East & Africa
- Market Attractiveness Analysis: Region
- North America Botulinum Immunodiagnostics Market Outlook:
- Key Highlights
- Historical Market Size (US$ Mn) Analysis, By Market, 2020 – 2025
- By Country
- By Product
- By Application
- By End User
- Market Size (US$ Mn) Analysis and Forecast, By Country, 2026 – 2033
- U.S.
- Canada
- Market Size (US$ Mn) Analysis and Volume (Units) Analysis and Forecast, By Product, 2026 – 2033
- Immunoassay Kits & Reagents
- Analysers & Instruments
- Consumables
- Software
- Others
- Market Size (US$ Mn) Analysis and Forecast, By Application, 2026 – 2033
- Clinical Diagnostics
- Veterinary Diagnostics
- Environmental Testing
- Research & Development
- Others
- Market Size (US$ Mn) Analysis and Forecast, By End User, 2026 – 2033
- Hospitals
- Clinical Laboratories
- Veterinary Clinics
- Others
- Market Attractiveness Analysis
- Europe Botulinum Immunodiagnostics Market Outlook:
- Key Highlights
- Historical Market Size (US$ Mn) Analysis, By Market, 2020 – 2025
- By Country
- By Product
- By Application
- By End User
- Market Size (US$ Mn) Analysis and Forecast, By Country, 2026 – 2033
- Germany
- France
- U.K.
- Italy
- Spain
- Russia
- Rest of Europe
- Market Size (US$ Mn) Analysis and Volume (Units) Analysis and Forecast, By Product, 2026 – 2033
- Immunoassay Kits & Reagents
- Analysers & Instruments
- Consumables
- Software
- Others
- Market Size (US$ Mn) Analysis and Forecast, By Application, 2026 – 2033
- Clinical Diagnostics
- Veterinary Diagnostics
- Environmental Testing
- Research & Development
- Others
- Market Size (US$ Mn) Analysis and Forecast, By End User, 2026 – 2033
- Hospitals
- Clinical Laboratories
- Veterinary Clinics
- Others
- Market Attractiveness Analysis
- East Asia Botulinum Immunodiagnostics Market Outlook:
- Key Highlights
- Historical Market Size (US$ Mn) Analysis, By Market, 2020 – 2025
- By Country
- By Product
- By Application
- By End User
- Market Size (US$ Mn) Analysis and Forecast, By Country, 2026 – 2033
- China
- Japan
- South Korea
- Market Size (US$ Mn) Analysis and Volume (Units) Analysis and Forecast, By Product, 2026 – 2033
- Immunoassay Kits & Reagents
- Analysers & Instruments
- Consumables
- Software
- Others
- Market Size (US$ Mn) Analysis and Forecast, By Application, 2026 – 2033
- Clinical Diagnostics
- Veterinary Diagnostics
- Environmental Testing
- Research & Development
- Others
- Market Size (US$ Mn) Analysis and Forecast, By End User, 2026 – 2033
- Hospitals
- Clinical Laboratories
- Veterinary Clinics
- Others
- Market Attractiveness Analysis
- South Asia & Oceania Botulinum Immunodiagnostics Market Outlook:
- Key Highlights
- Historical Market Size (US$ Mn) Analysis, By Market, 2020 – 2025
- By Country
- By Product
- By Application
- By End User
- Market Size (US$ Mn) Analysis and Forecast, By Country, 2026 – 2033
- India
- Southeast Asia
- ANZ
- Rest of South Asia & Oceania
- Market Size (US$ Mn) Analysis and Volume (Units) Analysis and Forecast, By Product, 2026 – 2033
- Immunoassay Kits & Reagents
- Analysers & Instruments
- Consumables
- Software
- Others
- Market Size (US$ Mn) Analysis and Forecast, By Application, 2026 – 2033
- Clinical Diagnostics
- Veterinary Diagnostics
- Environmental Testing
- Research & Development
- Others
- Market Size (US$ Mn) Analysis and Forecast, By End User, 2026 – 2033
- Hospitals
- Clinical Laboratories
- Veterinary Clinics
- Others
- Market Attractiveness Analysis
- Latin America Botulinum Immunodiagnostics Market Outlook:
- Key Highlights
- Historical Market Size (US$ Mn) Analysis, By Market, 2020 – 2025
- By Country
- By Product
- By Application
- By End User
- Market Size (US$ Mn) Analysis and Forecast, By Country, 2026 – 2033
- Brazil
- Mexico
- Rest of Latin America
- Market Size (US$ Mn) Analysis and Volume (Units) Analysis and Forecast, By Product, 2026 – 2033
- Immunoassay Kits & Reagents
- Analysers & Instruments
- Consumables
- Software
- Others
- Market Size (US$ Mn) Analysis and Forecast, By Application, 2026 – 2033
- Clinical Diagnostics
- Veterinary Diagnostics
- Environmental Testing
- Research & Development
- Others
- Market Size (US$ Mn) Analysis and Forecast, By End User, 2026 – 2033
- Hospitals
- Clinical Laboratories
- Veterinary Clinics
- Others
- Market Attractiveness Analysis
- Middle East & Africa Botulinum Immunodiagnostics Market Outlook:
- Key Highlights
- Historical Market Size (US$ Mn) Analysis, By Market, 2020 – 2025
- By Country
- By Product
- By Application
- By End User
- Market Size (US$ Mn) Analysis and Forecast, By Country, 2026 – 2033
- GCC Countries
- Egypt
- South Africa
- Northern Africa
- Rest of Middle East & Africa
- Market Size (US$ Mn) Analysis and Volume (Units) Analysis and Forecast, By Product, 2026 – 2033
- Immunoassay Kits & Reagents
- Analysers & Instruments
- Consumables
- Software
- Others
- Market Size (US$ Mn) Analysis and Forecast, By Application, 2026 – 2033
- Clinical Diagnostics
- Veterinary Diagnostics
- Environmental Testing
- Research & Development
- Others
- Market Size (US$ Mn) Analysis and Forecast, By End User, 2026 – 2033
- Hospitals
- Clinical Laboratories
- Veterinary Clinics
- Others
- Market Attractiveness Analysis
- Competition Landscape
- Market Structure
- Competition Intensity Mapping By Market
- Competition Dashboard
- Company Profiles (Details – Overview, Recent Developments)
- Thermo Fisher Scientific Inc.
- Overview
- Segments and Product & End User
- Key Financials
- Market Developments
- Market Strategy
- Bio-Techne
- BioChek
- AdVnt Biotechnologies
- Response Biomedical
- New Horizons Diagnostic Corporation
- Bio-Rad Laboratories, Inc.
- Antech Diagnostics, Inc
- Beckman Coulter, Inc.
- AbbVie Inc.
- Revance Therapeutics, Inc.
- Eisai Co., Ltd.
- Galderma S.A.
- Others
- Thermo Fisher Scientific Inc.
- Market Structure
- Appendix
- Research Methodology
- Research Assumptions
- Acronyms and Abbreviations

Loading page data
Please wait a moment


