

- Executive Summary
- Global Blood and Fluid Warmer Devices Market Snapshot, 2026 and 2033
- Market Opportunity Assessment, 2026 – 2033, US$ Mn
- Key Market Trends
- Future Market Projections
- Premium Market Insights
- Industry Developments and Key Market Events
- PMR Analysis and Recommendations
- Market Overview
- Market Scope and Definition
- Market Dynamics
- Drivers
- Restraints
- Opportunity
- Challenges
- Key Trends
- Macro-Economic Factors
- Global Sectorial Outlook
- Global GDP Growth Outlook
- COVID-19 Impact Analysis
- Forecast Factors – Relevance and Impact
- Value Added Insights
- Product Adoption Analysis
- Regulatory Landscape
- Value Chain Analysis
- Key Deals and Mergers
- PESTLE Analysis
- Porter’s Five Force Analysis
- Price Trend Analysis, 2020 – 2033
- Key Highlights
- Key Factors Impacting Product Prices
- Pricing Analysis, By Product Type
- Regional Prices and Product Preferences
- Global Blood and Fluid Warmer Devices Market Outlook:
- Key Highlights
- Market Volume (Units) Projections
- Market Size (US$ Mn) and Y-o-Y Growth
- Absolute $ Opportunity
- Market Size (US$ Mn) Analysis and Forecast
- Historical Market Size (US$ Mn) Analysis, 2020-2025
- Market Size (US$ Mn) Analysis and Forecast, 2026–2033
- Global Blood and Fluid Warmer Devices Market Outlook: Product Type
- Introduction / Key Findings
- Historical Market Size (US$ Mn) and Volume (Units) Analysis, By Product Type, 2020-2025
- Market Size (US$ Mn) and Volume (Units) Analysis and Forecast, By Product Type, 2026–2033
- Intravenous Warming Systems
- Surface Warming Systems
- Infusion Warmers
- Market Attractiveness Analysis: Product Type
- Global Blood and Fluid Warmer Devices Market Outlook: Application
- Introduction / Key Findings
- Historical Market Size (US$ Mn) Analysis, By Application, 2020-2025
- Market Size (US$ Mn) Analysis and Forecast, By Application, 2026–2033
- Surgery
- Newborn Care
- Acute Care
- Homecare
- Others
- Market Attractiveness Analysis: Application
- Global Blood and Fluid Warmer Devices Market Outlook: End User
- Introduction / Key Findings
- Historical Market Size (US$ Mn) Analysis, By End User, 2020-2025
- Market Size (US$ Mn) Analysis and Forecast, By End User, 2026–2033
- Hospitals/Clinics
- Ambulatory Services
- Others
- Market Attractiveness Analysis: End User
- Key Highlights
- Global Blood and Fluid Warmer Devices Market Outlook: Region
- Key Highlights
- Historical Market Size (US$ Mn) and Volume (Units) Analysis, By Region, 2020-2025
- Market Size (US$ Mn) and Volume (Units) Analysis and Forecast, By Region, 2026–2033
- North America
- Europe
- East Asia
- South Asia and Oceania
- Latin America
- Middle East & Africa
- Market Attractiveness Analysis: Region
- North America Blood and Fluid Warmer Devices Market Outlook:
- Key Highlights
- Historical Market Size (US$ Mn) and Volume (Units) Analysis, By Market, 2020-2025
- By Country
- By Product Type
- By Application
- By End User
- Market Size (US$ Mn) Analysis and Forecast, By Country, 2026–2033
- U.S.
- Canada
- Market Size (US$ Mn) and Volume (Units) Analysis and Forecast, By Product Type, 2026–2033
- Intravenous Warming Systems
- Surface Warming Systems
- Infusion Warmers
- Market Size (US$ Mn) Analysis and Forecast, By Application, 2026–2033
- Surgery
- Newborn Care
- Acute Care
- Homecare
- Others
- Market Size (US$ Mn) Analysis and Forecast, By End User, 2026–2033
- Hospitals/Clinics
- Ambulatory Services
- Others
- Market Attractiveness Analysis
- Europe Blood and Fluid Warmer Devices Market Outlook:
- Key Highlights
- Historical Market Size (US$ Mn) and Volume (Units) Analysis, By Market, 2020-2025
- By Country
- By Product Type
- By Application
- By End User
- Market Size (US$ Mn) Analysis and Forecast, By Country, 2026–2033
- Germany
- France
- U.K.
- Italy
- Spain
- Russia
- Rest of Europe
- Market Size (US$ Mn) and Volume (Units) Analysis and Forecast, By Product Type, 2026–2033
- Intravenous Warming Systems
- Surface Warming Systems
- Infusion Warmers
- Market Size (US$ Mn) Analysis and Forecast, By Application, 2026–2033
- Surgery
- Newborn Care
- Acute Care
- Homecare
- Others
- Market Size (US$ Mn) Analysis and Forecast, By End User, 2026–2033
- Hospitals/Clinics
- Ambulatory Services
- Others
- Market Attractiveness Analysis
- East Asia Blood and Fluid Warmer Devices Market Outlook:
- Key Highlights
- Historical Market Size (US$ Mn) and Volume (Units) Analysis, By Market, 2020-2025
- By Country
- By Product Type
- By Application
- By End User
- Market Size (US$ Mn) Analysis and Forecast, By Country, 2026–2033
- China
- Japan
- South Korea
- Market Size (US$ Mn) and Volume (Units) Analysis and Forecast, By Product Type, 2026–2033
- Intravenous Warming Systems
- Surface Warming Systems
- Infusion Warmers
- Market Size (US$ Mn) Analysis and Forecast, By Application, 2026–2033
- Surgery
- Newborn Care
- Acute Care
- Homecare
- Others
- Market Size (US$ Mn) Analysis and Forecast, By End User, 2026–2033
- Hospitals/Clinics
- Ambulatory Services
- Others
- Market Attractiveness Analysis
- South Asia & Oceania Blood and Fluid Warmer Devices Market Outlook:
- Key Highlights
- Historical Market Size (US$ Mn) and Volume (Units) Analysis, By Market, 2020-2025
- By Country
- By Product Type
- By Application
- By End User
- Market Size (US$ Mn) Analysis and Forecast, By Country, 2026–2033
- India
- Southeast Asia
- ANZ
- Rest of South Asia & Oceania
- Market Size (US$ Mn) and Volume (Units) Analysis and Forecast, By Product Type, 2026–2033
- Intravenous Warming Systems
- Surface Warming Systems
- Infusion Warmers
- Market Size (US$ Mn) Analysis and Forecast, By Application, 2026–2033
- Surgery
- Newborn Care
- Acute Care
- Homecare
- Others
- Market Size (US$ Mn) Analysis and Forecast, By End User, 2026–2033
- Hospitals/Clinics
- Ambulatory Services
- Others
- Market Attractiveness Analysis
- Latin America Blood and Fluid Warmer Devices Market Outlook:
- Key Highlights
- Historical Market Size (US$ Mn) and Volume (Units) Analysis, By Market, 2020-2025
- By Country
- By Product Type
- By Application
- By End User
- Market Size (US$ Mn) Analysis and Forecast, By Country, 2026–2033
- Brazil
- Mexico
- Rest of Latin America
- Market Size (US$ Mn) and Volume (Units) Analysis and Forecast, By Product Type, 2026–2033
- Intravenous Warming Systems
- Surface Warming Systems
- Infusion Warmers
- Market Size (US$ Mn) Analysis and Forecast, By Application, 2026–2033
- Surgery
- Newborn Care
- Acute Care
- Homecare
- Others
- Market Size (US$ Mn) Analysis and Forecast, By End User, 2026–2033
- Hospitals/Clinics
- Ambulatory Services
- Others
- Market Attractiveness Analysis
- Middle East & Africa Blood and Fluid Warmer Devices Market Outlook:
- Key Highlights
- Historical Market Size (US$ Mn) and Volume (Units) Analysis, By Market, 2020-2025
- By Country
- By Product Type
- By Application
- By End User
- Market Size (US$ Mn) Analysis and Forecast, By Country, 2026–2033
- GCC Countries
- Egypt
- South Africa
- Northern Africa
- Rest of Middle East & Africa
- Market Size (US$ Mn) and Volume (Units) Analysis and Forecast, By Product Type, 2026–2033
- Intravenous Warming Systems
- Surface Warming Systems
- Infusion Warmers
- Market Size (US$ Mn) Analysis and Forecast, By Application, 2026–2033
- Surgery
- Newborn Care
- Acute Care
- Homecare
- Others
- Market Size (US$ Mn) Analysis and Forecast, By End User, 2026–2033
- Hospitals/Clinics
- Ambulatory Services
- Others
- Market Attractiveness Analysis
- Competition Landscape
- Market Share Analysis, 2025
- Market Structure
- Competition Intensity Mapping By Market
- Competition Dashboard
- Company Profiles (Details – Overview, Financials, Strategy, Recent Developments)
- 3M Company
- Overview
- Segments and Product Types
- Key Financials
- Market Developments
- Market Strategy
- BD
- GE Healthcare
- Stryker Corporation
- Barkey GmbH & Co. KG
- Geratherm Medical
- Stihler Electronic GmbH
- Belmont Instrument
- Biegler GmbH
- Baxter International Inc. (Gambro)
- ICU Medical Inc. (Smiths Medical)
- Vyaire Medical, Inc.
- The Surgical Company
- Life Warmer
- MEQU
- Estill Medical Technologies, Inc.
- Smisson-Cartledge Biomedical
- Others
- 3M Company
- Appendix
- Research Methodology
- Research Assumptions
- Acronyms and Abbreviations


- Medical Devices
- Blood and Fluid Warmer Devices Market
Blood and Fluid Warmer Devices Market Size, Share, Growth, and Regional Forecast, 2026 to 2033
Blood and Fluid Warmer Devices Market by Product Type (Intravenous Warming Systems, Surface Warming Systems, Infusion Warmers), Application (Surgery, Newborn Care, Acute Care, Homecare, Others), End User (Hospitals/Clinics, Ambulatory Services, Others), and Regional Analysis from 2026 to 2033
Blood and Fluid Warmer Devices Market Size and Trend Analysis
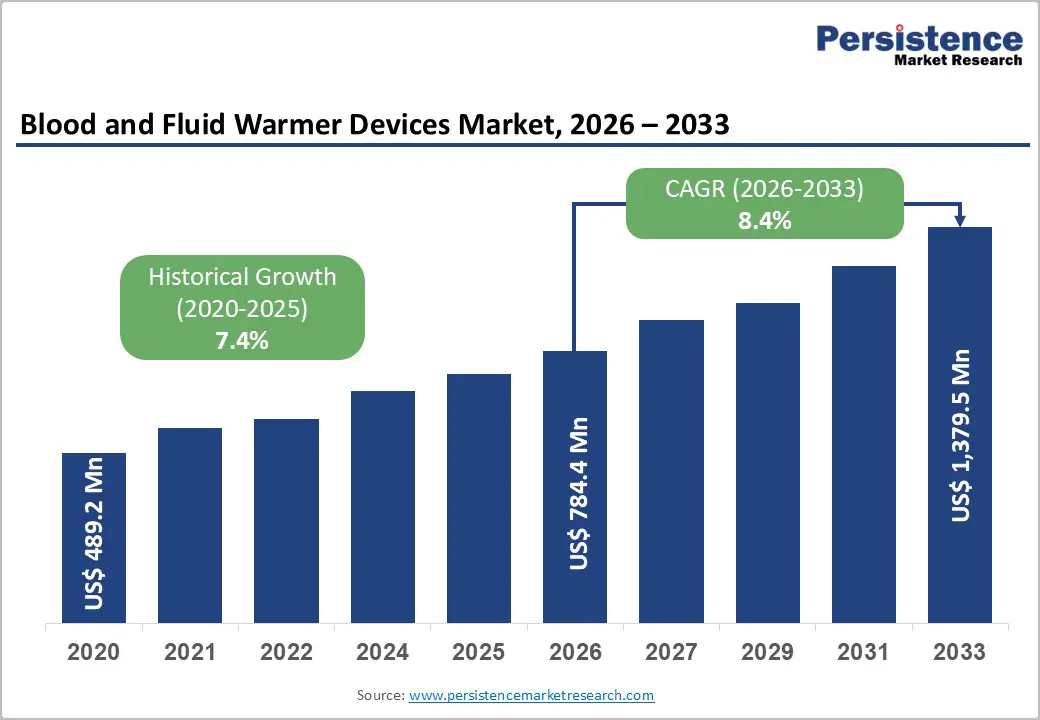
The global blood and fluid warmer devices market is estimated to grow from US$ 784.4 Mn in 2026 to US$ 1,379.5 Mn by 2033. The market is projected to record a CAGR of 8.4% during the forecast period from 2026 to 2033.
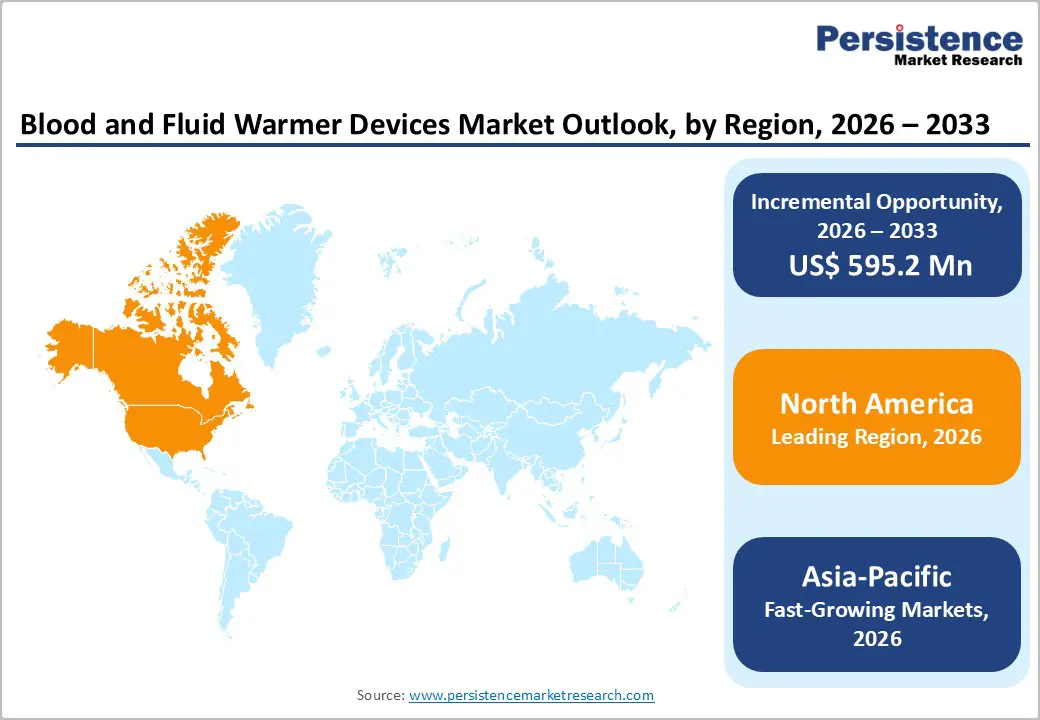
The global blood and fluid warmer devices market is growing steadily due to aging populations, rising surgical volumes, and increasing demand for critical care. North America dominates, supported by advanced healthcare infrastructure and high technology adoption. Asia-Pacific is the fastest-growing region, driven by expanding healthcare access, supportive government policies, local manufacturing growth, and rising investments in modern medical technologies.
Key Industry Highlights
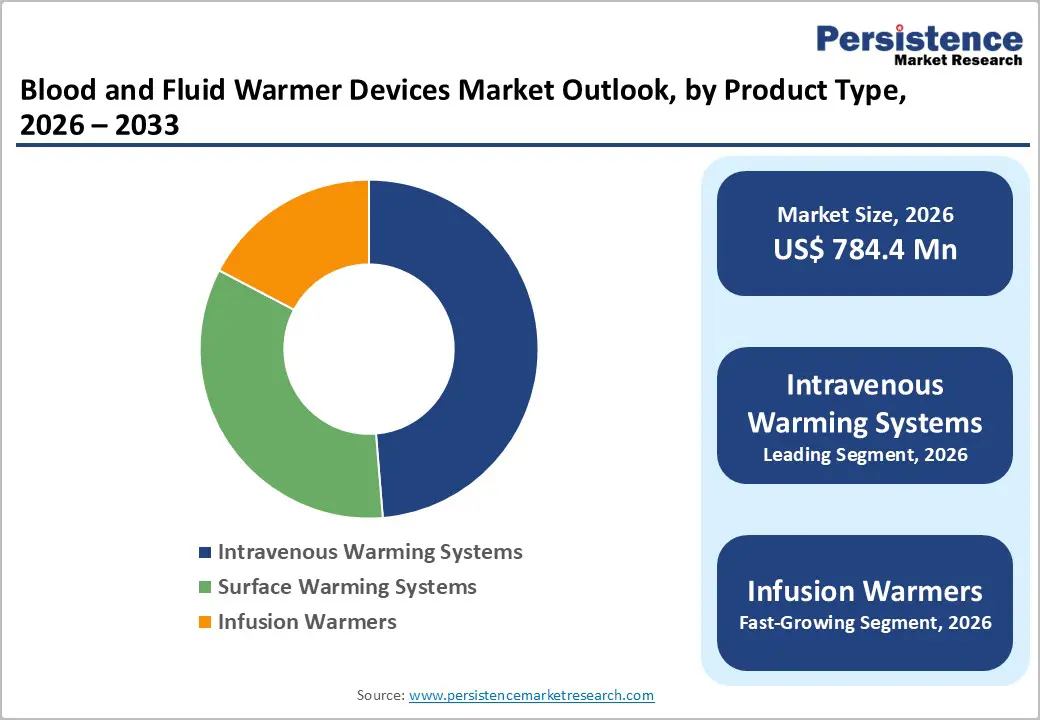
- Dominant Segment: Intravenous warming systems holds 48.7% share in 2025, driven by their critical role in surgeries, trauma care, and emergency transfusions, along with precise temperature control and compatibility with high-flow fluid and blood administration.
- Dominant Region: North America leads in 2025 with 41.2% share, supported by advanced hospital infrastructure, high surgical volumes, and strong adoption of patient temperature management protocols. Asia-Pacific is the fastest-growing region, fueled by expanding healthcare access, government support, rising trauma and surgical cases, and increasing investment in modern medical devices.
- Market Drivers: Market growth is driven by rising surgical and trauma cases, increasing awareness of hypothermia prevention, aging populations, growth in critical care services, and technological advancements in portable and efficient warming systems.
- Market Opportunity: Key opportunities include growth of portable and battery-operated warmers, expansion in emergency and homecare settings, rising demand in emerging economies, integration with smart monitoring systems, and development of cost-effective, user-friendly devices improving patient safety and outcomes.
| Global Market Attributes | Key Insights |
|---|---|
| Global Blood and Fluid Warmer Devices Market Size (2026E) | US$ 784.4 Mn |
| Market Value Forecast (2033F) | US$ 1,379.5 Mn |
| Projected Growth (CAGR 2026 to 2033) | 8.4% |
| Historical Market Growth (CAGR 2020 to 2025) | 7.4% |
Market Dynamics
Driver: Increasing prevalence of perioperative and trauma-induced hypothermia
Perioperative hypothermia, defined as a core body temperature below 36 °C is a common complication in surgical settings. Clinical studies have documented that the incidence of intraoperative hypothermia ranges widely from about 20% to over 70% in adult surgical patients when warming measures are not uniformly applied, illustrating how frequent temperature drops occur during anesthesia and procedures. Such involuntary hypothermia is associated with significant adverse effects, including impaired coagulation, increased blood loss, prolonged anesthesia metabolism, and extended recovery times.
In one cross-sectional study at Brazilian referral hospitals, nearly 57% of surgical patients experienced inadvertent perioperative hypothermia, highlighting the persistent clinical challenge globally. Another observational analysis showed intraoperative temperature declines in a majority of major surgical cases, reinforcing why maintaining normothermia is a standard quality metric in perioperative care. Because hypothermia contributes to complications and longer hospital stays, clinicians increasingly adopt active warming solutions, boosting demand for blood and fluid warmer devices that help maintain patient core temperatures and improve outcomes.
Restraints: High cost of advanced blood and fluid warming devices
The high upfront cost of advanced medical devices continues to be a significant restraint on adoption, especially in resource-constrained settings. Durable hospital technologies, including sophisticated temperature control systems with integrated sensors and rapid warming capabilities often carry price tags that are difficult for smaller clinics or rural hospitals to justify within limited budgets. Publicly available equipment data shows many home and specialized clinical devices (e.g., advanced mobility or respiratory equipment) can range from several thousand to over US $15,000 per unit, which serves as a proxy for the price sensitivity in similar medical device categories.
Beyond acquisition cost, insurance reimbursement limitations further dampen uptake; many payers impose strict qualification criteria or exclude certain devices, shifting the financial burden to patients or healthcare providers. This financing gap means even when clinical benefits are evident, institutions may delay procurement or prioritize lower-cost alternatives. In markets with constrained healthcare spending, particularly in low- and middle-income countries, these cost barriers restrict widespread integration of advanced warming systems despite clear clinical needs, slowing market growth.
Opportunity: Growing demand for portable and battery-operated warming devices
The increasing emphasis on pre-hospital care, emergency response, and home-based medical support presents a clear opportunity for portable and battery-operated warming devices. As outpatient care models and chronic disease management shift care outside traditional settings, clinicians and caregivers alike demand more compact, user-friendly warming devices suitable for ambulances, field settings, and patients’ homes.
Portable blood and fluid warmers with battery operation can address thermal management needs in trauma rescues, emergency medical services, and rural clinics where infrastructure may be limited. Furthermore, aging global demographics and rising chronic comorbidities necessitate devices that facilitate safe fluid administration without reliance on centralized OR systems. With healthcare delivery evolving toward decentralized and versatile frameworks, including telehealth and mobile clinics, manufacturers that innovate lightweight, efficient, and adaptable warming solutions will capture emerging markets and expand overall industry reach.
Category-wise Analysis
By Product Type, Intravenous Warming Systems Dominates the Blood and Fluid Warmer Devices Market
Intravenous Warming Systems are leading with 48.7% share in 2025, because they are the most direct and effective method for maintaining patients’ core temperature during fluid and blood administration, an essential need in many clinical scenarios. These systems actively heat IV fluids and blood products just before or during infusion, minimizing heat loss that occurs when cold fluids enter the bloodstream. Maintaining normothermia is critical; unwarmed IV fluids can exacerbate hypothermia, especially during large-volume infusions seen in surgery and trauma care, leading to adverse physiologic responses like impaired coagulation and cardiac stress. Active IV warming has been shown to help keep core body temperatures closer to normal compared to room-temperature fluids, improving patient comfort and stability during care. Because fluid administration is nearly universal across healthcare settings, from emergency departments to operating rooms IV warming systems are widely adopted and central in protocols for perioperative and critical care thermal management.
By Application, Surgery Dominates the Blood and Fluid Warmer Devices Market
Surgical applications dominate the market because a large proportion of perioperative patients are at high risk for inadvertent hypothermia, a common complication during anesthesia and operative procedures. Research shows that perioperative hypothermia can occur in 30–75 % of cases, largely due to anesthetic-induced impairment of thermoregulation and exposure to cold operating room environments. Hypothermia during surgery increases risks of infection, coagulopathy, cardiovascular stress, and extended recovery times, making active temperature management a priority for surgical safety. Because there are hundreds of millions of surgical procedures globally each year, warming systems especially for blood and IV fluids, are standard equipment in operating suites to preserve core temperature and improve outcomes. Consequently, surgical settings account for the most frequent and intensive use of blood and fluid warmers, driving their dominant share in the market.
Regional Insights
North America Blood and Fluid Warmer Devices Market Trends
North America leads the global blood and fluid warmer devices market because of its highly developed healthcare infrastructure and substantial procedural volumes. The region accounts for roughly 41.2% of global installations, reflecting widespread hospital adoption of warming protocols in ORs, trauma centers, and critical care units. U.S. hospitals alone perform millions of blood transfusions annually, with surge capacity and emergency services integrating warming systems widely. Advanced clinical guidelines in perioperative and emergency care emphasize temperature management to improve outcomes and reduce complications, boosting device utilization. Additionally, high healthcare expenditure per capita in the United States and Canada supports adoption of state-of-the-art warming technologies in both fixed and portable formats, reinforcing North America’s leadership position.
Europe Blood and Fluid Warmer Devices Market Trends
Europe is a key market for blood and fluid warmer devices due to its well-established healthcare systems, strong clinical protocols, and emphasis on patient safety. Hospitals across Germany, the UK, France, and other EU nations routinely use warming systems in surgery, emergency care, and blood banks to prevent hypothermia-related complications. In Europe, significant proportions of operating rooms and trauma centers have adopted advanced warming devices, driven by clinical guidelines and regulatory emphasis on perioperative care quality. The region’s public healthcare investments and aging population also contribute to steady device demand, particularly as surgical volumes and chronic disease prevalence rise. Robust medical device standards and reimbursement frameworks further support market penetration of both fixed and portable warming technologies across European healthcare networks.
Asia-Pacific Blood and Fluid Warmer Devices Market Trends
Asia-Pacific is the fastest-growing region for blood and fluid warmer devices due to rapid healthcare infrastructure expansion and increasing procedural volumes in countries like China, India, and Japan. Investments in hospital construction, ICU capacity, and emergency care systems are rising sharply to meet burgeoning healthcare demand, with many new facilities integrating warming technologies into surgical and critical care units. Asia-Pacific’s large and aging population increases the number of surgeries, trauma cases, and transfusions requiring temperature management, while government initiatives in China and India promote broader access to advanced medical devices. Expanding medical tourism and rising patient awareness about quality care also accelerate adoption. Growth is further supported by the increasing deployment of portable warmers in EMS and rural healthcare settings.
Market Competitive Landscape
The competitive landscape of the blood and fluid warmer devices market is moderately consolidated, led by established global med-tech companies like 3M, Smiths Medical, Stryker, GE Healthcare, BD, and Baxter International, which together supply a large portion of warming systems worldwide. These players compete through continuous product innovation, strategic partnerships, and expanded global distribution to strengthen adoption in hospitals and emergency care centers. A tier of specialized and regional manufacturers, such as Barkey GmbH, Belmont, The 37Company, and Estill Medical, contributes niche products and cost-effective alternatives, supporting diverse clinical needs and reinforcing competition.
Key Industry Developments:
- In June 2024, the U.S. Food and Drug Administration (FDA) granted 510(k) clearance to Danish medtech company °MEQU for its °M Warmer System, a portable blood and IV fluid warming device designed for both military and civilian use. The FDA authorization marked a regulatory milestone that allowed the company to begin commercial activities in the U.S. market.
- In April 2024, BD India launched its new UltraTouch™ blood collection device in India. The BD Vacutainer® UltraTouch™ Push Button Blood Collection Set was introduced to minimize patient pain and discomfort during blood draws by using BD RightGauge™ ultra thin needle technology and BD PentaPoint™ design, which together significantly reduced insertion pain.
Companies Covered in Blood and Fluid Warmer Devices Market
- 3M Company
- BD
- GE Healthcare
- Stryker Corporation
- Barkey GmbH & Co. KG
- Geratherm Medical
- Stihler Electronic GmbH
- Belmont Instrument
- Biegler GmbH
- Baxter International Inc. (Gambro)
- ICU Medical Inc. (Smiths Medical)
- Vyaire Medical, Inc.
- The Surgical Company
- Life Warmer
- MEQU
- Estill Medical Technologies, Inc.
- Smisson-Cartledge Biomedical
- Others
Frequently Asked Questions
The global blood and fluid warmer devices market is projected to be valued at US$ 784.4 Mn in 2026.
Rising surgical volumes, trauma cases, hypothermia prevention needs, aging populations, and adoption of advanced temperature management technologies.
The global blood and fluid warmer devices market is poised to witness a CAGR of 8.4% between 2026 and 2033.
Growing demand for portable warmers, expansion in emerging markets, homecare adoption, EMS use, and smart device integration.
3M Company, BD, GE Healthcare, Stryker Corporation, Barkey GmbH & Co. KG, Geratherm Medical.


