


- Executive Summary
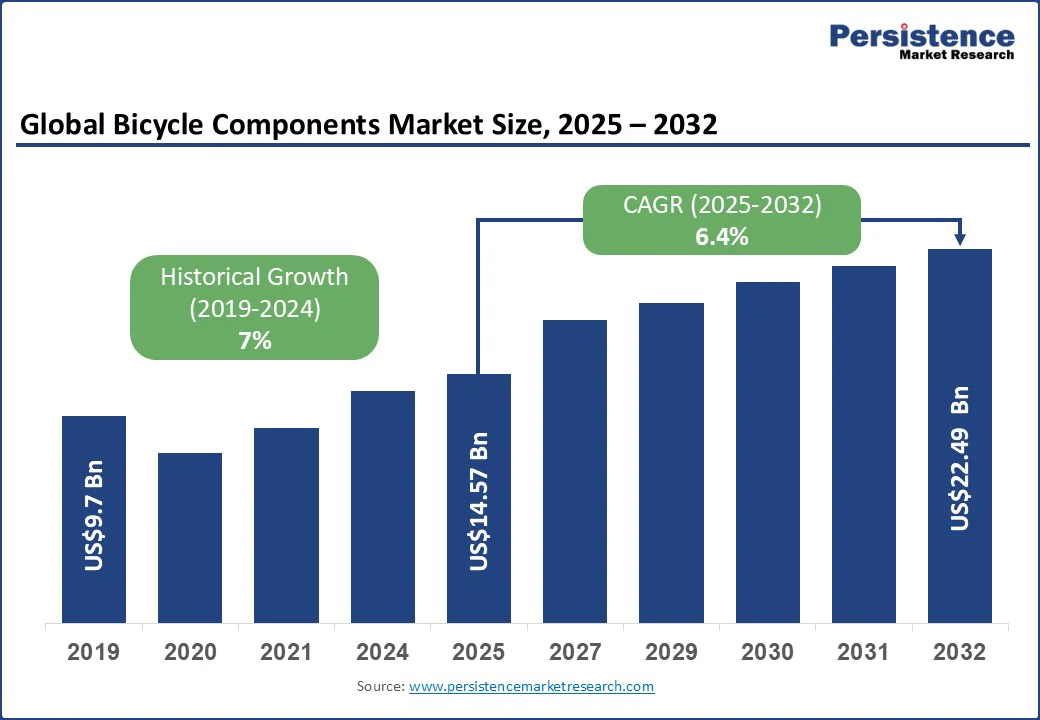
- Global Bicycle Components Market Snapshot, 2025 and 2032
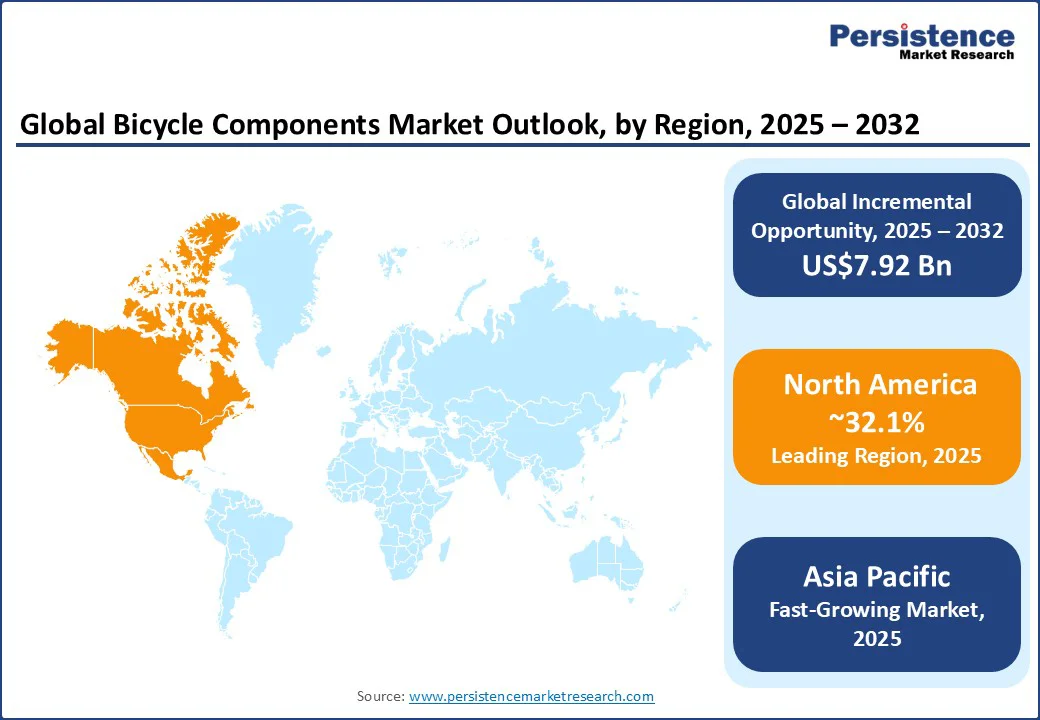
- Market Opportunity Assessment, 2025 - 2032, US$ Bn
- Key Market Trends
- Future Market Projections
- Premium Market Insights
- Industry Developments and Key Market Events
- PMR Analysis and Recommendations
- Market Overview
- Market Scope and Definition
- Market Dynamics
- Drivers
- Restraints
- Opportunity
- Key Trends
- Macro-economic Factors
- Global Sectoral Outlook
- Global GDP Growth Outlook
- COVID-19 Impact Analysis
- Forecast Factors - Relevance and Impact
- Value Added Insights
- Tool Adoption Analysis
- Regulatory Landscape
- Value Chain Analysis
- PESTLE Analysis
- Porter’s Five Force Analysis
- Price Analysis, 2024A
- Key Highlights
- Key Factors Impacting Deployment Costs
- Pricing Analysis, By Component Type
- Global Bicycle Components Market Outlook
- Key Highlights
- Market Volume (Units) Projections
- Market Size (US$ Bn) and Y-o-Y Growth
- Absolute $ Opportunity
- Market Size (US$ Bn) and Volume (Units) Analysis and Forecast
- Historical Market Size (US$ Bn) Analysis, 2019-2024
- Market Size (US$ Bn) Analysis and Forecast, 2025 - 2032
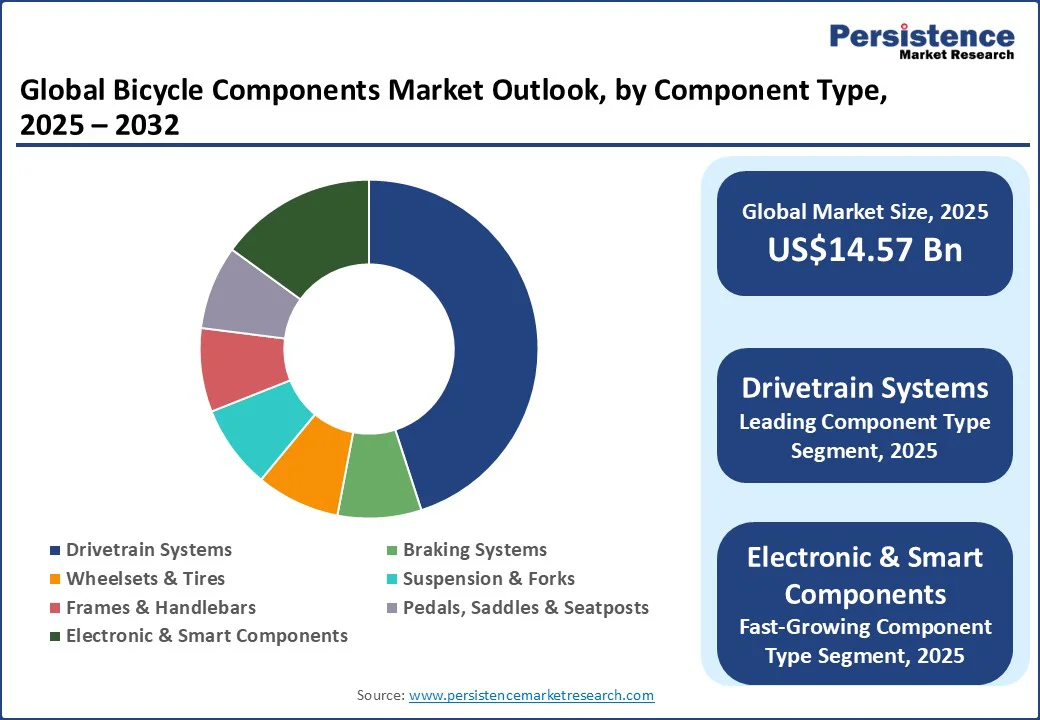
- Global Bicycle Components Market Outlook: Component Type
- Introduction / Key Findings
- Historical Market Size (US$ Bn) and Volume (Units) Analysis, By Component Type, 2019 - 2024
- Market Size (US$ Bn) and Volume (Units) Analysis and Forecast, By Component Type, 2025 - 2032
- Drivetrain Systems
- Braking Systems
- Wheelsets & Tires
- Suspension & Forks
- Frames & Handlebars
- Pedals, Saddles & Seatposts
- Electronic & Smart Components
- Market Attractiveness Analysis: Component Type
- Global Bicycle Components Market Outlook: Bicycle Type
- Introduction / Key Findings
- Historical Market Size (US$ Bn) Analysis, By Bicycle Type, 2019 - 2024
- Market Size (US$ Bn) Analysis and Forecast, By Bicycle Type, 2025 - 2032
- Road Bicycles
- Mountain Bicycles (MTB)
- Hybrid/City Bicycles
- Electric Bicycles (e-bikes)
- Gravel & Cyclocross Bicycles
- BMX & Specialty Bicycles
- Market Attractiveness Analysis: Bicycle Type
- Global Bicycle Components Market Outlook: Sales Channel
- Introduction / Key Findings
- Historical Market Size (US$ Bn) Analysis, By Sales Channel, 2019 - 2024
- Market Size (US$ Bn) Analysis and Forecast, By Sales Channel, 2025 - 2032
- Original Equipment Manufacturer
- Aftermarket
- Market Attractiveness Analysis: Sales Channel
- Global Bicycle Components Market Outlook: Material
- Introduction / Key Findings
- Historical Market Size (US$ Bn) Analysis, By Material, 2019 - 2024
- Market Size (US$ Bn) Analysis and Forecast, By Material, 2025 - 2032
- Aluminum Alloys
- Carbon Fiber Composites
- Steel
- Titanium
- Hybrid Materials
- Market Attractiveness Analysis: Material
- Key Highlights
- Global Bicycle Components Market Outlook: Region
- Key Highlights
- Historical Market Size (US$ Bn) and Volume (Units) Analysis, By Region, 2019 - 2024
- Market Size (US$ Bn) and Volume (Units) Analysis and Forecast, By Region, 2025 - 2032
- North America
- Europe
- East Asia
- South Asia and Oceania
- Latin America
- Middle East & Africa
- Market Attractiveness Analysis: Region
- North America Bicycle Components Market Outlook
- Key Highlights
- Historical Market Size (US$ Bn) Analysis, By Market, 2019 - 2024
- By Country
- By Component Type
- By Bicycle Type
- By Sales Channel
- By Material
- Market Size (US$ Bn) Analysis and Forecast, By Country, 2025 - 2032
- U.S.
- Canada
- Market Size (US$ Bn) and Volume (Units) Analysis and Forecast, By Component Type, 2025 - 2032
- Drivetrain Systems
- Braking Systems
- Wheelsets & Tires
- Suspension & Forks
- Frames & Handlebars
- Pedals, Saddles & Seatposts
- Electronic & Smart Components
- Market Size (US$ Bn) Analysis and Forecast, By Bicycle Type, 2025 - 2032
- Road Bicycles
- Mountain Bicycles (MTB)
- Hybrid/City Bicycles
- Electric Bicycles (e-bikes)
- Gravel & Cyclocross Bicycles
- BMX & Specialty Bicycles
- Market Size (US$ Bn) Analysis and Forecast, By Sales Channel, 2025 - 2032
- Original Equipment Manufacturer
- Aftermarket
- Market Size (US$ Bn) Analysis and Forecast, By Material, 2025 - 2032
- Aluminum Alloys
- Carbon Fiber Composites
- Steel
- Titanium
- Hybrid Materials
- Market Attractiveness Analysis
- Europe Bicycle Components Market Outlook
- Key Highlights
- Historical Market Size (US$ Bn) Analysis, By Market, 2019 - 2024
- By Country
- By Component Type
- By Bicycle Type
- By Sales Channel
- By Material
- Market Size (US$ Bn) and Volume (Units) Analysis and Forecast, By Component Type, 2025 - 2032
- Drivetrain Systems
- Braking Systems
- Wheelsets & Tires
- Suspension & Forks
- Frames & Handlebars
- Pedals, Saddles & Seatposts
- Electronic & Smart Components
- Market Size (US$ Bn) Analysis and Forecast, By Bicycle Type, 2025 - 2032
- Road Bicycles
- Mountain Bicycles (MTB)
- Hybrid/City Bicycles
- Electric Bicycles (e-bikes)
- Gravel & Cyclocross Bicycles
- BMX & Specialty Bicycles
- Market Size (US$ Bn) Analysis and Forecast, By Sales Channel, 2025 - 2032
- Original Equipment Manufacturer
- Aftermarket
- Market Size (US$ Bn) Analysis and Forecast, By Material, 2025 - 2032
- Aluminum Alloys
- Carbon Fiber Composites
- Steel
- Titanium
- Hybrid Materials
- Market Attractiveness Analysis
- East Asia Bicycle Components Market Outlook
- Key Highlights
- Historical Market Size (US$ Bn) Analysis, By Market, 2019 - 2024
- By Country
- By Component Type
- By Bicycle Type
- By Sales Channel
- By Material
- Market Size (US$ Bn) Analysis and Forecast, By Country, 2025 - 2032
- China
- Japan
- South Korea
- Market Size (US$ Bn) and Volume (Units) Analysis and Forecast, By Component Type, 2025 - 2032
- Drivetrain Systems
- Braking Systems
- Wheelsets & Tires
- Suspension & Forks
- Frames & Handlebars
- Pedals, Saddles & Seatposts
- Electronic & Smart Components
- Market Size (US$ Bn) Analysis and Forecast, By Bicycle Type, 2025 - 2032
- Road Bicycles
- Mountain Bicycles (MTB)
- Hybrid/City Bicycles
- Electric Bicycles (e-bikes)
- Gravel & Cyclocross Bicycles
- BMX & Specialty Bicycles
- Market Size (US$ Bn) Analysis and Forecast, By Sales Channel, 2025 - 2032
- Original Equipment Manufacturer
- Aftermarket
- Market Size (US$ Bn) Analysis and Forecast, By Material, 2025 - 2032
- Aluminum Alloys
- Carbon Fiber Composites
- Steel
- Titanium
- Hybrid Materials
- Market Attractiveness Analysis
- South Asia & Oceania Bicycle Components Market Outlook
- Key Highlights
- Historical Market Size (US$ Bn) Analysis, By Market, 2019 - 2024
- By Country
- By Component Type
- By Bicycle Type
- By Sales Channel
- By Material
- Market Size (US$ Bn) Analysis and Forecast, By Country, 2025 - 2032
- India
- Southeast Asia
- ANZ
- Rest of South Asia & Oceania
- Market Size (US$ Bn) and Volume (Units) Analysis and Forecast, By Component Type, 2025 - 2032
- Drivetrain Systems
- Braking Systems
- Wheelsets & Tires
- Suspension & Forks
- Frames & Handlebars
- Pedals, Saddles & Seatposts
- Electronic & Smart Components
- Market Size (US$ Bn) Analysis and Forecast, By Bicycle Type, 2025 - 2032
- Road Bicycles
- Mountain Bicycles (MTB)
- Hybrid/City Bicycles
- Electric Bicycles (e-bikes)
- Gravel & Cyclocross Bicycles
- BMX & Specialty Bicycles
- Market Size (US$ Bn) Analysis and Forecast, By Sales Channel, 2025 - 2032
- Original Equipment Manufacturer
- Aftermarket
- Market Size (US$ Bn) Analysis and Forecast, By Material, 2025 - 2032
- Aluminum Alloys
- Carbon Fiber Composites
- Steel
- Titanium
- Hybrid Materials
- Market Attractiveness Analysis
- Latin America Bicycle Components Market Outlook
- Key Highlights
- Historical Market Size (US$ Bn) Analysis, By Market, 2019 - 2024
- By Country
- By Component Type
- By Bicycle Type
- By Sales Channel
- By Material
- Market Size (US$ Bn) Analysis and Forecast, By Country, 2025 - 2032
- Brazil
- Mexico
- Rest of Latin America
- Market Size (US$ Bn) and Volume (Units) Analysis and Forecast, By Component Type, 2025 - 2032
- Drivetrain Systems
- Braking Systems
- Wheelsets & Tires
- Suspension & Forks
- Frames & Handlebars
- Pedals, Saddles & Seatposts
- Electronic & Smart Components
- Market Size (US$ Bn) Analysis and Forecast, By Bicycle Type, 2025 - 2032
- Road Bicycles
- Mountain Bicycles (MTB)
- Hybrid/City Bicycles
- Electric Bicycles (e-bikes)
- Gravel & Cyclocross Bicycles
- BMX & Specialty Bicycles
- Market Size (US$ Bn) Analysis and Forecast, By Sales Channel, 2025 - 2032
- Original Equipment Manufacturer
- Aftermarket
- Market Size (US$ Bn) Analysis and Forecast, By Material, 2025 - 2032
- Aluminum Alloys
- Carbon Fiber Composites
- Steel
- Titanium
- Hybrid Materials
- Market Attractiveness Analysis
- Middle East & Africa Bicycle Components Market Outlook
- Key Highlights
- Historical Market Size (US$ Bn) Analysis, By Market, 2019 - 2024
- By Country
- By Component Type
- By Bicycle Type
- By Sales Channel
- By Material
- Market Size (US$ Bn) Analysis and Forecast, By Country, 2025 - 2032
- GCC Countries
- Egypt
- South Africa
- Northern Africa
- Rest of Middle East & Africa
- Market Size (US$ Bn) and Volume (Units) Analysis and Forecast, By Component Type, 2025 - 2032
- Drivetrain Systems
- Braking Systems
- Wheelsets & Tires
- Suspension & Forks
- Frames & Handlebars
- Pedals, Saddles & Seatposts
- Electronic & Smart Components
- Market Size (US$ Bn) Analysis and Forecast, By Bicycle Type, 2025 - 2032
- Road Bicycles
- Mountain Bicycles (MTB)
- Hybrid/City Bicycles
- Electric Bicycles (e-bikes)
- Gravel & Cyclocross Bicycles
- BMX & Specialty Bicycles
- Market Size (US$ Bn) Analysis and Forecast, By Sales Channel, 2025 - 2032
- Original Equipment Manufacturer
- Aftermarket
- Market Size (US$ Bn) Analysis and Forecast, By Material, 2025 - 2032
- Aluminum Alloys
- Carbon Fiber Composites
- Steel
- Titanium
- Hybrid Materials
- Market Attractiveness Analysis
- Competition Landscape
- Market Share Analysis, 2024
- Market Structure
- Competition Intensity Mapping By Market
- Competition Dashboard
- Company Profiles (Details - Overview, Financials, Strategy, Recent Developments)
- Shimano Inc.
- Overview
- Segments and Components
- Key Financials
- Market Developments
- Market Strategy
- SRAM LLC
- Campagnolo S.r.l.
- Accell Group N.V.
- Giant Manufacturing Co. Ltd.
- Trek Bicycle Corporation
- Merida Industry Co. Ltd.
- DT Swiss AG
- Ritchey Design Inc.
- Fox Factory Holding Corp.
- Cane Creek Cycling Components
- Chris King Precision Components
- Vision (FSA - Full Speed Ahead)
- Hope Technology Ltd.
- Rotor Bike Components
- SR Suntour Inc.
- Magura GmbH
- Thomson Bike Products
- Zipp Speed Weaponry (SRAM subsidiary)
- ENVE Composites
- Shimano Inc.
- Appendix
- Research Methodology
- Research Assumptions
- Acronyms and Abbreviations

Loading page data
Please wait a moment


