


- Executive Summary
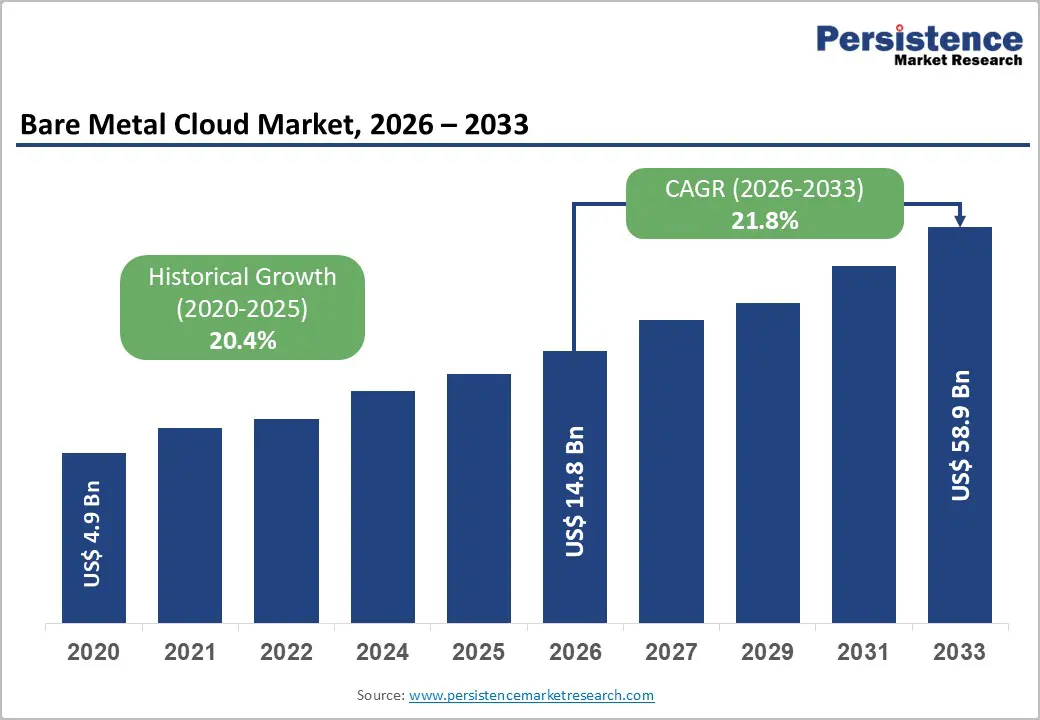
- Global Bare Metal Cloud Market Snapshot 2026 and 2033
- Market Opportunity Assessment, 2026-2033, US$ Bn
- Key Market Trends
- Industry Developments and Key Market Events
- Demand Side and Supply Side Analysis
- PMR Analysis and Recommendations
- Market Overview
- Market Scope and Definitions
- Value Chain Analysis
- Macro-Economic Factors
- Global GDP Outlook
- Global Healthcare Industry Overview
- Global IT & Telecom Industry Overview
- Global Consumer Electronics Industry Overview
- Forecast Factors – Relevance and Impact
- COVID-19 Impact Assessment
- PESTLE Analysis
- Porter's Five Forces Analysis
- Geopolitical Tensions: Market Impact
- Regulatory and Technology Landscape
- Market Dynamics
- Drivers
- Restraints
- Opportunities
- Trends
- Price Trend Analysis, 2020 – 2033
- Region-wise Price Analysis
- Price by Segments
- Price Impact Factors
- Global Bare Metal Cloud Market Outlook: Historical (2020 – 2025) and Forecast (2026 – 2033)
- Key Highlights
- Global Bare Metal Cloud Market Outlook: Component
- Introduction/Key Findings
- Historical Market Size (US$ Bn) Analysis by Component, 2020-2025
- Current Market Size (US$ Bn) Forecast, by Component, 2026-2033
- Bare Metal Cloud Servers
- Services
- API Integration and Deployment
- Business Consulting
- Market Attractiveness Analysis: Component
- Global Bare Metal Cloud Market Outlook: Enterprise Size
- Introduction/Key Findings
- Historical Market Size (US$ Bn) Analysis by Enterprise Size, 2020-2025
- Current Market Size (US$ Bn) Forecast, by Enterprise Size, 2026-2033
- Large Enterprises
- Small & Medium-sized Enterprises
- Micro Businesses
- Above 5 GHz
- Market Attractiveness Analysis: Enterprise Size
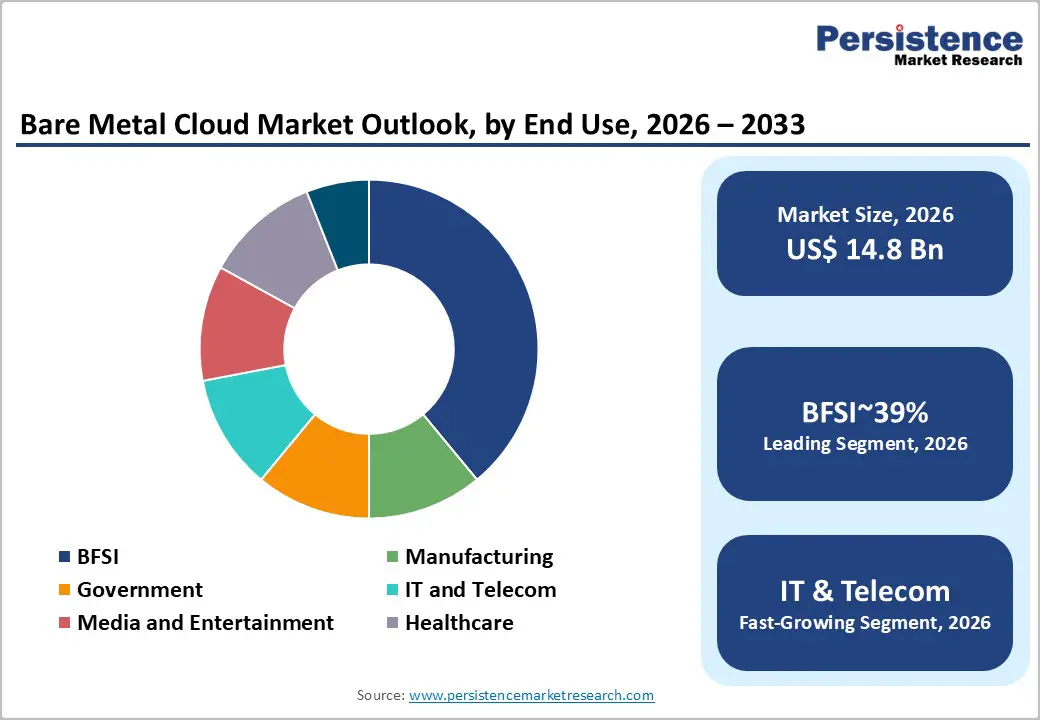
- Global Bare Metal Cloud Market Outlook: End User
- Introduction/Key Findings
- Historical Market Size (US$ Bn) Analysis by End User, 2020-2025
- Current Market Size (US$ Bn) Forecast, by End User, 2026-2033
- BFSI
- Manufacturing
- Government
- IT and Telecom
- Media and Entertainment
- Healthcare
- Others
- Market Attractiveness Analysis: End User
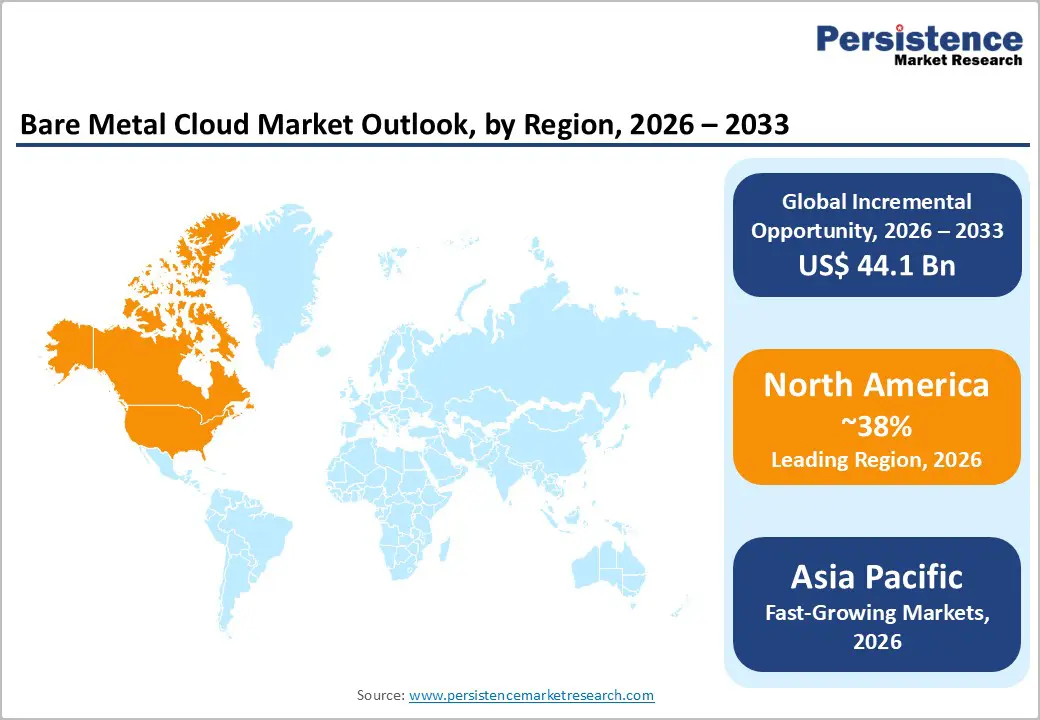
- Global Bare Metal Cloud Market Outlook: Region
- Key Highlights
- Historical Market Size (US$ Bn) Analysis by Region, 2020-2025
- Current Market Size (US$ Bn) Forecast, by Region, 2026-2033
- North America
- Europe
- East Asia
- South Asia & Oceania
- Latin America
- Middle East & Africa
- Market Attractiveness Analysis: Region
- North America Bare Metal Cloud Market Outlook: Historical (2020 – 2025) and Forecast (2026 – 2033)
- Key Highlights
- Pricing Analysis
- North America Market Size (US$ Bn) Forecast, by Country, 2026-2033
- U.S.
- Canada
- North America Market Size (US$ Bn) Forecast, by Component, 2026-2033
- Bare Metal Cloud Servers
- Services
- API Integration and Deployment
- Business Consulting
- North America Market Size (US$ Bn) Forecast, by Enterprise Size, 2026-2033
- Large Enterprises
- Small & Medium-sized Enterprises
- Micro Businesses
- Above 5 GHz
- North America Market Size (US$ Bn) Forecast, by End User, 2026-2033
- BFSI
- Manufacturing
- Government
- IT and Telecom
- Media and Entertainment
- Healthcare
- Others
- Europe Bare Metal Cloud Market Outlook: Historical (2020 – 2025) and Forecast (2026 – 2033)
- Key Highlights
- Pricing Analysis
- Europe Market Size (US$ Bn) Forecast, by Country, 2026-2033
- Germany
- Italy
- France
- U.K.
- Spain
- Russia
- Rest of Europe
- Europe Market Size (US$ Bn) Forecast, by Component, 2026-2033
- Bare Metal Cloud Servers
- Services
- API Integration and Deployment
- Business Consulting
- Europe Market Size (US$ Bn) Forecast, by Enterprise Size, 2026-2033
- Large Enterprises
- Small & Medium-sized Enterprises
- Micro Businesses
- Above 5 GHz
- Europe Market Size (US$ Bn) Forecast, by End User, 2026-2033
- BFSI
- Manufacturing
- Government
- IT and Telecom
- Media and Entertainment
- Healthcare
- Others
- East Asia Bare Metal Cloud Market Outlook: Historical (2020 – 2025) and Forecast (2026 – 2033)
- Key Highlights
- Pricing Analysis
- East Asia Market Size (US$ Bn) Forecast, by Country, 2026-2033
- China
- Japan
- South Korea
- East Asia Market Size (US$ Bn) Forecast, by Component, 2026-2033
- Bare Metal Cloud Servers
- Services
- API Integration and Deployment
- Business Consulting
- East Asia Market Size (US$ Bn) Forecast, by Enterprise Size, 2026-2033
- Large Enterprises
- Small & Medium-sized Enterprises
- Micro Businesses
- Above 5 GHz
- East Asia Market Size (US$ Bn) Forecast, by End User, 2026-2033
- BFSI
- Manufacturing
- Government
- IT and Telecom
- Media and Entertainment
- Healthcare
- Others
- South Asia & Oceania Bare Metal Cloud Market Outlook: Historical (2020 – 2025) and Forecast (2026 – 2033)
- Key Highlights
- Pricing Analysis
- South Asia & Oceania Market Size (US$ Bn) Forecast, by Country, 2026-2033
- India
- Southeast Asia
- ANZ
- Rest of SAO
- South Asia & Oceania Market Size (US$ Bn) Forecast, by Component, 2026-2033
- Bare Metal Cloud Servers
- Services
- API Integration and Deployment
- Business Consulting
- South Asia & Oceania Market Size (US$ Bn) Forecast, by Enterprise Size, 2026-2033
- Large Enterprises
- Small & Medium-sized Enterprises
- Micro Businesses
- Above 5 GHz
- South Asia & Oceania Market Size (US$ Bn) Forecast, by End User, 2026-2033
- BFSI
- Manufacturing
- Government
- IT and Telecom
- Media and Entertainment
- Healthcare
- Others
- Latin America Bare Metal Cloud Market Outlook: Historical (2020 – 2025) and Forecast (2026 – 2033)
- Key Highlights
- Pricing Analysis
- Latin America Market Size (US$ Bn) Forecast, by Country, 2026-2033
- Brazil
- Mexico
- Rest of LATAM
- Latin America Market Size (US$ Bn) Forecast, by Component, 2026-2033
- Bare Metal Cloud Servers
- Services
- API Integration and Deployment
- Business Consulting
- Latin America Market Size (US$ Bn) Forecast, by Enterprise Size, 2026-2033
- Large Enterprises
- Small & Medium-sized Enterprises
- Micro Businesses
- Above 5 GHz
- Latin America Market Size (US$ Bn) Forecast, by End User, 2026-2033
- BFSI
- Manufacturing
- Government
- IT and Telecom
- Media and Entertainment
- Healthcare
- Others
- Middle East & Africa Bare Metal Cloud Market Outlook: Historical (2020 – 2025) and Forecast (2026 – 2033)
- Key Highlights
- Pricing Analysis
- Middle East & Africa Market Size (US$ Bn) Forecast, by Country, 2026-2033
- GCC Countries
- South Africa
- Northern Africa
- Rest of MEA
- Middle East & Africa Market Size (US$ Bn) Forecast, by Component, 2026-2033
- Bare Metal Cloud Servers
- Services
- API Integration and Deployment
- Business Consulting
- Middle East & Africa Market Size (US$ Bn) Forecast, by Enterprise Size, 2026-2033
- Large Enterprises
- Small & Medium-sized Enterprises
- Micro Businesses
- Above 5 GHz
- Middle East & Africa Market Size (US$ Bn) Forecast, by End User, 2026-2033
- BFSI
- Manufacturing
- Government
- IT and Telecom
- Media and Entertainment
- Healthcare
- Others
- Competition Landscape
- Market Share Analysis, 2025
- Market Structure
- Competition Intensity Mapping
- Competition Dashboard
- Company Profiles
- IBM
- Company Overview
- Product Portfolio/Offerings
- Key Financials
- SWOT Analysis
- Company Strategy and Key Developments
- Oracle
- Amazon Web Services, Inc.
- CenturyLink
- Internap Corporation
- RACKSPACE US, INC.
- Limestone Networks, Inc.
- BIGSTEP
- Equinix, Inc.
- Hivelocity, Inc
- Hetzner Online GmbH
- HorizonlQ
- Linode, LLC
- Lumen Technologies
- OVH SAS
- IBM
- Appendix
- Research Methodology
- Research Assumptions
- Acronyms and Abbreviations


