


- Executive Summary
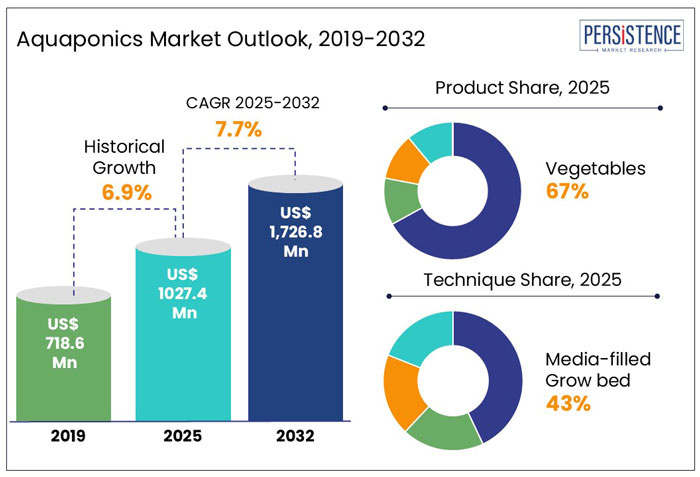
- Global Aquaponics Market Snapshot, 2025 and 2032
- Market Opportunity Assessment, 2025 – 2032, US$ Mn
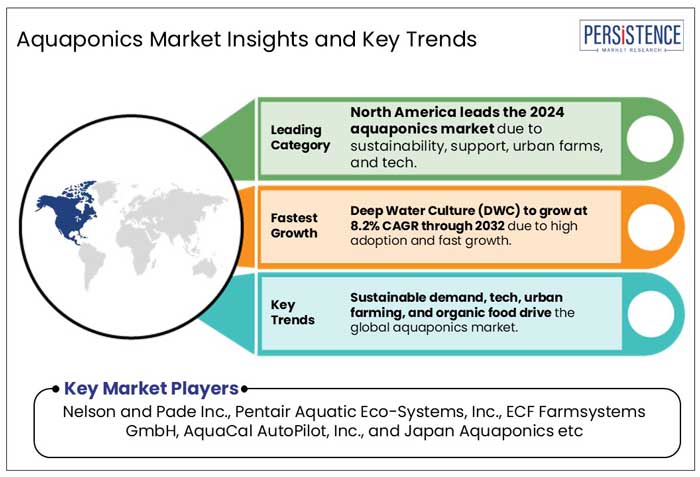
- Key Market Trends
- Future Market Projections
- Premium Market Insights
- Industry Developments and Key Market Events
- PMR Analysis and Recommendations
- Market Overview
- Market Scope and Definition
- Market Dynamics
- Drivers
- Restraints
- Opportunity
- Challenges
- Key Trends
- COVID-19 Impact Analysis
- Forecast Factors – Relevance and Impact
- Value Added Insights
- Value Chain Analysis
- Key Market Players
- Regulatory Landscape
- PESTLE Analysis
- Porter’s Five Force Analysis
- Consumer Behavior Analysis
- Global Aquaponics Market Outlook
- Key Highlights
- Market Size (US$ Mn) and Y-o-Y Growth
- Absolute $ Opportunity
- Market Size (US$ Mn) Analysis and Forecast
- Historical Market Size (US$ Mn) Analysis, 2019-2023
- Current Market Size (US$ Mn) Analysis and Forecast, 2024–2032
- Global Aquaponics Market Outlook: Product
- Historical Market Size (US$ Mn) Analysis, By Product, 2019-2023
- Current Market Size (US$ Mn) Analysis and Forecast, By Product, 2024–2032
- Fish
- Fruits
- Vegetables
- Herbs
- Market Attractiveness Analysis: Product
- Global Aquaponics Market Outlook: Technique
- Historical Market Size (US$ Mn) Analysis, By Technique, 2019-2023
- Current Market Size (US$ Mn) Analysis and Forecast, By Technique, 2024–2032
- Deep Water Culture
- Nutrient Film Technology
- Media-filled Growbed
- Market Attractiveness Analysis: Technique
- Global Aquaponics Market Outlook: Equipment
- Historical Market Size (US$ Mn) Analysis, By Equipment, 2019-2023
- Current Market Size (US$ Mn) Analysis and Forecast, By Equipment, 2024–2032
- Tank Systems
- Pumps & Valves
- Aeration Systems
- Water Heaters
- Others
- Market Attractiveness Analysis: Equipment
- Global Aquaponics Market Outlook: End-user
- Historical Market Size (US$ Mn) Analysis, By End-user, 2019-2023
- Current Market Size (US$ Mn) Analysis and Forecast, By End-user, 2024–2032
- Commercial Growers
- Home Gardeners
- Research Institutions
- Others
- Market Attractiveness Analysis: End-user
- Key Highlights
- Global Aquaponics Market Outlook: Region
- Historical Market Size (US$ Mn) Analysis, By Region, 2019-2023
- Current Market Size (US$ Mn) Analysis and Forecast, By Region, 2024–2032
- North America
- Latin America
- Europe
- East Asia
- South Asia and Oceania
- Middle East & Africa
- Market Attractiveness Analysis: Region
- North America Aquaponics Market Outlook
- Historical Market Size (US$ Mn) Analysis, By Market, 2019-2023
- By Country
- By Product
- By Technique
- By Equipment
- By End-user
- Current Market Size (US$ Mn) Analysis and Forecast, By Country, 2024–2032
- U.S.
- Canada
- Current Market Size (US$ Mn) Analysis and Forecast, By Product, 2024–2032
- Fish
- Fruits
- Vegetables
- Herbs
- Current Market Size (US$ Mn) Analysis and Forecast, By Technique, 2024–2032
- Deep Water Culture
- Nutrient Film Technology
- Media-filled Growbed
- Current Market Size (US$ Mn) Analysis and Forecast, By Equipment, 2024–2032
- Tank Systems
- Pumps & Valves
- Aeration Systems
- Water Heaters
- Others
- Current Market Size (US$ Mn) Analysis and Forecast, By End-user, 2024–2032
- Commercial Growers
- Home Gardeners
- Research Institutions
- Others
- Market Attractiveness Analysis
- Historical Market Size (US$ Mn) Analysis, By Market, 2019-2023
- Europe Aquaponics Market Outlook
- Historical Market Size (US$ Mn) Analysis, By Market, 2019-2023
- By Country
- By Product
- By Technique
- By Equipment
- By End-user
- Current Market Size (US$ Mn) Analysis and Forecast, By Country, 2024–2032
- Germany
- France
- U.K.
- Italy
- Spain
- Russia
- Rest of Europe
- Current Market Size (US$ Mn) Analysis and Forecast, By Product, 2024–2032
- Fish
- Fruits
- Vegetables
- Herbs
- Current Market Size (US$ Mn) Analysis and Forecast, By Technique, 2024–2032
- Deep Water Culture
- Nutrient Film Technology
- Media-filled Growbed
- Current Market Size (US$ Mn) Analysis and Forecast, By Equipment, 2024–2032
- Tank Systems
- Pumps & Valves
- Aeration Systems
- Water Heaters
- Others
- Current Market Size (US$ Mn) Analysis and Forecast, By End-user, 2024–2032
- Commercial Growers
- Home Gardeners
- Research Institutions
- Others
- Market Attractiveness Analysis
- Historical Market Size (US$ Mn) Analysis, By Market, 2019-2023
- East Asia Aquaponics Market Outlook:
- Historical Market Size (US$ Mn) Analysis, By Market, 2019-2023
- By Country
- By Product
- By Technique
- By Equipment
- By End-user
- Current Market Size (US$ Mn) Analysis and Forecast, By Country, 2024–2032
- China
- Japan
- South Korea
- Current Market Size (US$ Mn) Analysis and Forecast, By Product, 2024–2032
- Fish
- Fruits
- Vegetables
- Herbs
- Current Market Size (US$ Mn) Analysis and Forecast, By Technique, 2024–2032
- Deep Water Culture
- Nutrient Film Technology
- Media-filled Growbed
- Current Market Size (US$ Mn) Analysis and Forecast, By Equipment, 2024–2032
- Tank Systems
- Pumps & Valves
- Aeration Systems
- Water Heaters
- Others
- Current Market Size (US$ Mn) Analysis and Forecast, By End-user, 2024–2032
- Commercial Growers
- Home Gardeners
- Research Institutions
- Others
- Market Attractiveness Analysis
- Historical Market Size (US$ Mn) Analysis, By Market, 2019-2023
- South Asia & Oceania Aquaponics Market Outlook:
- Historical Market Size (US$ Mn) Analysis, By Market, 2019-2023
- By Country
- By Product
- By Technique
- By Equipment
- By End-user
- Current Market Size (US$ Mn) Analysis and Forecast, By Country, 2024–2032
- India
- Indonesia
- Thailand
- Singapore
- ANZ
- Rest of South Asia & Oceania
- Current Market Size (US$ Mn) Analysis and Forecast, By Product, 2024–2032
- Fish
- Fruits
- Vegetables
- Herbs
- Current Market Size (US$ Mn) Analysis and Forecast, By Technique, 2024–2032
- Deep Water Culture
- Nutrient Film Technology
- Media-filled Growbed
- Current Market Size (US$ Mn) Analysis and Forecast, By Equipment, 2024–2032
- Tank Systems
- Pumps & Valves
- Aeration Systems
- Water Heaters
- Others
- Current Market Size (US$ Mn) Analysis and Forecast, By End-user, 2024–2032
- Commercial Growers
- Home Gardeners
- Research Institutions
- Others
- Market Attractiveness Analysis
- Historical Market Size (US$ Mn) Analysis, By Market, 2019-2023
- Latin America Aquaponics Market Outlook:
- Historical Market Size (US$ Mn) Analysis, By Market, 2019-2023
- By Country
- By Product
- By Technique
- By Equipment
- By End-user
- Current Market Size (US$ Mn) Analysis and Forecast, By Country, 2024–2032
- Brazil
- Mexico
- Rest of Latin America
- Current Market Size (US$ Mn) Analysis and Forecast, By Product, 2024–2032
- Fish
- Fruits
- Vegetables
- Herbs
- Current Market Size (US$ Mn) Analysis and Forecast, By Technique, 2024–2032
- Deep Water Culture
- Nutrient Film Technology
- Media-filled Growbed
- Current Market Size (US$ Mn) Analysis and Forecast, By Equipment, 2024–2032
- Tank Systems
- Pumps & Valves
- Aeration Systems
- Water Heaters
- Others
- Current Market Size (US$ Mn) Analysis and Forecast, By End-user, 2024–2032
- Commercial Growers
- Home Gardeners
- Research Institutions
- Others
- Market Attractiveness Analysis
- Historical Market Size (US$ Mn) Analysis, By Market, 2019-2023
- Middle East & Africa Aquaponics Market Outlook:
- Historical Market Size (US$ Mn) Analysis, By Market, 2019-2023
- By Country
- By Product
- By Technique
- By Equipment
- By End-user
- Current Market Size (US$ Mn) Analysis and Forecast, By Country, 2024–2032
- GCC Countries
- Egypt
- South Africa
- Northern Africa
- Rest of Middle East & Africa
- Current Market Size (US$ Mn) Analysis and Forecast, By Product, 2024–2032
- Fish
- Fruits
- Vegetables
- Herbs
- Current Market Size (US$ Mn) Analysis and Forecast, By Technique, 2024–2032
- Deep Water Culture
- Nutrient Film Technology
- Media-filled Growbed
- Current Market Size (US$ Mn) Analysis and Forecast, By Equipment, 2024–2032
- Tank Systems
- Pumps & Valves
- Aeration Systems
- Water Heaters
- Others
- Current Market Size (US$ Mn) Analysis and Forecast, By End-user, 2024–2032
- Commercial Growers
- Home Gardeners
- Research Institutions
- Others
- Market Attractiveness Analysis
- Historical Market Size (US$ Mn) Analysis, By Market, 2019-2023
- Competition Landscape
- Market Share Analysis, 2024
- Market Structure
- Competition Intensity Mapping by Market
- Competition Dashboard
- Company Profiles (Details – Overview, Financials, Strategy, Recent Developments)
- Nelson and Pade Inc.
- Overview
- Segments and Products
- Key Financials
- Market Developments
- Market Strategy
- Pentair Aquatic Eco-Systems, Inc.
- ECF Farmsystems GmbH
- AquaCal AutoPilot, Inc.
- Japan Aquaponics
- Green Life Aquaponics
- Backyard Aquaponics Pty Ltd.
- Hapa Farms
- Lucky Clays Fresh
- Blueplanet Urban Agro Services Pvt. Ltd.
- Global Aquaponic Systems Corporation
- Ichthys Aquaponics
- Aponic Ltd.
- Red Ewald Inc.
- Others
- Nelson and Pade Inc.
- Appendix
- Research Methodology
- Research Assumptions
- Acronyms and Abbreviations

Loading page data
Please wait a moment


