

- Executive Summary
- Global Antibodies Contract Manufacturing Market Snapshot, 2025 and 2032
- Market Opportunity Assessment, 2024 - 2032, US$ Mn
- Key Market Trends
- Future Market Projections
- Premium Market Insights
- Industry Developments and Key Market Events
- PMR Analysis and Recommendations
- Market Overview
- Market Scope and Definition
- Market Dynamics
- Drivers
- Restraints
- Opportunity
- Key Trends
- Macro-Economic Factors
- Global Sectorial Outlook
- Global GDP Growth Outlook
- COVID-19 Impact Analysis
- Forecast Factors - Relevance and Impact
- Value Added Insights
- Product Adoption Analysis
- Regulatory Landscape
- Value Chain Analysis
- PESTLE Analysis
- Porter’s Five Force Analysis
- Global Antibodies Contract Manufacturing Market Outlook
- Key Highlights
- Market Size (US$ Mn) and Y-o-Y Growth
- Absolute $ Opportunity
- Market Size (US$ Mn) Analysis and Forecast
- Historical Market Size (US$ Mn) Analysis, 2019-2023
- Current Market Size (US$ Mn) Analysis and Forecast, 2024 - 2032
- Global Antibodies Contract Manufacturing Market Outlook: Product
- Introduction / Key Findings
- Historical Market Size (US$ Mn) Analysis, By Product, 2019 - 2023
- Current Market Size (US$ Mn) Analysis and Forecast, By Product, 2024 - 2032
- Monoclonal Antibodies
- Antibody Fragments
- Antibody-Drug Conjugates (ADCs)
- Others
- Market Attractiveness Analysis: Product
- Global Antibodies Contract Manufacturing Market Outlook: Expression System
- Introduction / Key Findings
- Historical Market Size (US$ Mn), By Expression System, 2019 - 2023
- Current Market Size (US$ Mn) Analysis and Forecast, By Expression System, 2024 - 2032
- Mammalian
- Microbial
- Bacteria
- Yeast
- Market Attractiveness Analysis: Expression System
- Global Antibodies Contract Manufacturing Market Outlook: Company Size
- Introduction / Key Findings
- Historical Market Size (US$ Mn), By Company Size, 2019 - 2023
- Current Market Size (US$ Mn) Analysis and Forecast, By Company Size, 2024 - 2032
- Small
- Mid-sized
- Large
- Very large
- Market Attractiveness Analysis: Company Size
- Global Antibodies Contract Manufacturing Market Outlook: Scale of Operation
- Introduction / Key Findings
- Historical Market Size (US$ Mn) Analysis, By Scale of Operation, 2019 - 2023
- Current Market Size (US$ Mn) Analysis and Forecast, By Scale of Operation, 2024 - 2032
- Preclinical
- Clinical
- Commercial
- Market Attractiveness Analysis: Scale of Operation
- Key Highlights
- Global Antibodies Contract Manufacturing Market Outlook: Region
- Key Highlights
- Historical Market Size (US$ Mn) Analysis, By Region, 2019 - 2023
- Current Market Size (US$ Mn) Analysis and Forecast, By Region, 2024 - 2032
- North America
- Europe
- East Asia
- South Asia & Oceania
- Latin America
- Middle East & Africa
- Market Attractiveness Analysis: Region
- North America Antibodies Contract Manufacturing Market Outlook
- Key Highlights
- Historical Market Size (US$ Mn) Analysis, By Market, 2019 - 2023
- By Country
- By Product
- By Expression System
- By Company Size
- By Scale of Operation
- Current Market Size (US$ Mn) Analysis and Forecast, By Country, 2024 - 2032
- U.S.
- Canada
- Current Market Size (US$ Mn) Analysis and Forecast, By Product, 2024 - 2032
- Monoclonal Antibodies
- Antibody Fragments
- Antibody-Drug Conjugates (ADCs)
- Others
- Current Market Size (US$ Mn) Analysis and Forecast, By Expression System, 2024 - 2032
- Mammalian
- Microbial
- Bacteria
- Yeast
- Current Market Size (US$ Mn) Analysis and Forecast, By Company Size, 2024 - 2032
- Small
- Mid-sized
- Large
- Very large
- Current Market Size (US$ Mn) Analysis and Forecast, By Scale of Operation, 2024 - 2032
- Preclinical
- Clinical
- Commercial
- Market Attractiveness Analysis
- Europe Antibodies Contract Manufacturing Market Outlook
- Key Highlights
- Historical Market Size (US$ Mn) Analysis, By Market, 2019 - 2023
- By Country
- By Product
- By Expression System
- By Company Size
- By Scale of Operation
- Current Market Size (US$ Mn) Analysis and Forecast, By Country, 2024 - 2032
- Germany
- France
- U.K.
- Italy
- Spain
- Russia
- Türkiye
- Rest of Europe
- Current Market Size (US$ Mn) Analysis and Forecast, By Product, 2024 - 2032
- Monoclonal Antibodies
- Antibody Fragments
- Antibody-Drug Conjugates (ADCs)
- Others
- Current Market Size (US$ Mn) Analysis and Forecast, By Expression System, 2024 - 2032
- Mammalian
- Microbial
- Bacteria
- Yeast
- Current Market Size (US$ Mn) Analysis and Forecast, By Company Size, 2024 - 2032
- Small
- Mid-sized
- Large
- Very large
- Current Market Size (US$ Mn) Analysis and Forecast, By Scale of Operation, 2024 - 2032
- Preclinical
- Clinical
- Commercial
- Market Attractiveness Analysis
- East Asia Antibodies Contract Manufacturing Market Outlook
- Key Highlights
- Historical Market Size (US$ Mn) Analysis, By Market, 2019 - 2023
- By Country
- By Product
- By Expression System
- By Company Size
- By Scale of Operation
- Current Market Size (US$ Mn) Analysis and Forecast, By Country, 2024 - 2032
- China
- Japan
- South Korea
- Current Market Size (US$ Mn) Analysis and Forecast, By Product, 2024 - 2032
- Monoclonal Antibodies
- Antibody Fragments
- Antibody-Drug Conjugates (ADCs)
- Others
- Current Market Size (US$ Mn) Analysis and Forecast, By Expression System, 2024 - 2032
- Mammalian
- Microbial
- Bacteria
- Yeast
- Current Market Size (US$ Mn) Analysis and Forecast, By Company Size, 2024 - 2032
- Small
- Mid-sized
- Large
- Very large
- Current Market Size (US$ Mn) Analysis and Forecast, By Scale of Operation, 2024 - 2032
- Preclinical
- Clinical
- Commercial
- Market Attractiveness Analysis
- South Asia & Oceania Antibodies Contract Manufacturing Market Outlook
- Key Highlights
- Historical Market Size (US$ Mn) Analysis, By Market, 2019 - 2023
- By Country
- By Product
- By Expression System
- By Company Size
- By Scale of Operation
- Current Market Size (US$ Mn) Analysis and Forecast, By Country, 2024 - 2032
- India
- Southeast Asia
- ANZ
- Rest of South Asia & Oceania
- Current Market Size (US$ Mn) Analysis and Forecast, By Product, 2024 - 2032
- Monoclonal Antibodies
- Antibody Fragments
- Antibody-Drug Conjugates (ADCs)
- Others
- Current Market Size (US$ Mn) Analysis and Forecast, By Expression System, 2024 - 2032
- Mammalian
- Microbial
- Bacteria
- Yeast
- Current Market Size (US$ Mn) Analysis and Forecast, By Company Size, 2024 - 2032
- Small
- Mid-sized
- Large
- Very large
- Current Market Size (US$ Mn) Analysis and Forecast, By Scale of Operation, 2024 - 2032
- Preclinical
- Clinical
- Commercial
- Market Attractiveness Analysis
- Latin America Antibodies Contract Manufacturing Market Outlook
- Key Highlights
- Historical Market Size (US$ Mn) Analysis, By Market, 2019 - 2023
- By Country
- By Product
- By Expression System
- By Company Size
- By Scale of Operation
- Current Market Size (US$ Mn) Analysis and Forecast, By Country, 2024 - 2032
- Brazil
- Mexico
- Rest of Latin America
- Current Market Size (US$ Mn) Analysis and Forecast, By Product, 2024 - 2032
- Monoclonal Antibodies
- Antibody Fragments
- Antibody-Drug Conjugates (ADCs)
- Others
- Current Market Size (US$ Mn) Analysis and Forecast, By Expression System, 2024 - 2032
- Mammalian
- Microbial
- Bacteria
- Yeast
- Current Market Size (US$ Mn) Analysis and Forecast, By Company Size, 2024 - 2032
- Small
- Mid-sized
- Large
- Very large
- Current Market Size (US$ Mn) Analysis and Forecast, By Scale of Operation, 2024 - 2032
- Preclinical
- Clinical
- Commercial
- Market Attractiveness Analysis
- Middle East & Africa Antibodies Contract Manufacturing Market Outlook
- Key Highlights
- Historical Market Size (US$ Mn) Analysis, By Market, 2019 - 2023
- By Country
- By Product
- By Expression System
- By Company Size
- By Scale of Operation
- Current Market Size (US$ Mn) Analysis and Forecast, By Country, 2024 - 2032
- GCC Countries
- Egypt
- South Africa
- Northern Africa
- Rest of Middle East & Africa
- Current Market Size (US$ Mn) Analysis and Forecast, By Product, 2024 - 2032
- Monoclonal Antibodies
- Antibody Fragments
- Antibody-Drug Conjugates (ADCs)
- Others
- Current Market Size (US$ Mn) Analysis and Forecast, By Expression System, 2024 - 2032
- Mammalian
- Microbial
- Bacteria
- Yeast
- Current Market Size (US$ Mn) Analysis and Forecast, By Company Size, 2024 - 2032
- Small
- Mid-sized
- Large
- Very large
- Current Market Size (US$ Mn) Analysis and Forecast, By Scale of Operation, 2024 - 2032
- Preclinical
- Clinical
- Commercial
- Market Attractiveness Analysis
- Competition Landscape
- Market Share Analysis, 2024
- Market Structure
- Competition Intensity Mapping By Market
- Competition Dashboard
- Company Profiles (Details - Overview, Financials, Strategy, Recent Developments)
- Lonza
- Overview
- Segments and Products
- Key Financials
- Market Developments
- Market Strategy
- Boehringer Ingelheim International GmbH
- Emergent
- Eurofins Scientific
- Thermo Fisher Scientific
- AbbVie Inc.
- Catalent Inc.
- KBI Biopharma
- Aldevron
- Novasep
- Nitto Avecia Pharma Services
- Pierre Fabre
- Samsung Biologics
- Synthon
- WuXi Biologics
- Charles River Laboratories
- FUJIFILM Holdings Corporation
- mAbxience
- Lonza
- Appendix
- Research Methodology
- Research Assumptions
- Acronyms and Abbreviations


- Biotechnology
- Antibodies Contract Manufacturing Market
Antibodies Contract Manufacturing Market Size, Share, and Growth Forecast for 2025 - 2032
Antibody Contract Manufacturing Market by Product (Monoclonal Antibodies, Antibody Fragments, Antibody-Drug Conjugates (ADCs), Others), Expression System (Mammalian, Microbial), Company Size (Small, Mid-sized, Large, Very large), Scale of Operation (Preclinical, Clinical, Commercial) and Regional Analysis
Antibody Contract Manufacturing Market Outlook (2025-2032)
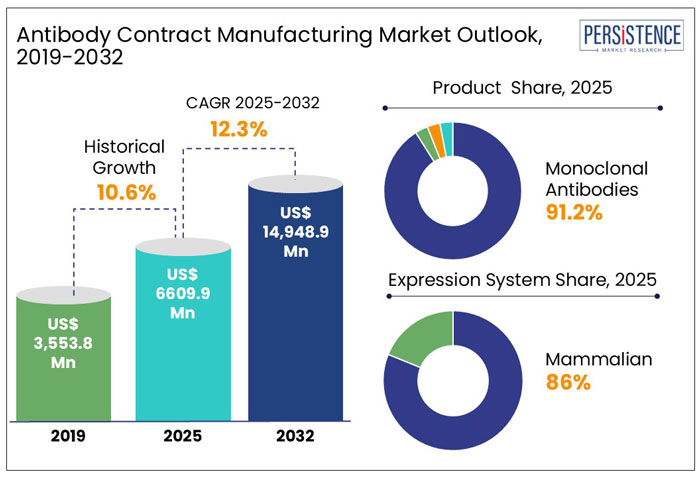
The global revenue from the antibody contract manufacturing market stands at US$ 6.61 Bn in 2025, with the global market expected to grow at a CAGR of 12.3% to reach a valuation of approximately US$ 14.95 Bn by the end of 2032.
|
Attributes |
Key Insights |
|
Antibody Contract Manufacturing Market Size (2025) |
US$ 6.61 Bn |
|
Market Value Forecast (2032F) |
US$ 14.95 Bn |
|
Projected Growth (CAGR 2025-2032) |
12.3% |
|
Historical Market Growth (CAGR 2019 to 2024) |
10.6% |
Historical Growth and Course Ahead
The global market recorded a historic CAGR of 10.6% in 2019 to 2024.
The Antibody Contract Manufacturing Market has experienced significant historical growth, driven by rising demand for monoclonal antibodies, advancements in biology, and increased outsourcing by pharmaceutical companies.
Over the past decade, contract manufacturing organizations (CMOs) have expanded capabilities to accommodate complex biologics, offering scalable production, regulatory expertise, and cost efficiency. The surge in biopharmaceutical R&D, coupled with a growing preference for biosimilars and personalized medicine, has further fueled market expansion.
Looking ahead, the market is expected to grow steadily, propelled by increasing investments in biologics, higher adoption of single-use bioprocessing technologies, and expanding biopharma pipelines.
Emerging markets, particularly in Asia-Pacific, are expected to play a pivotal role in future growth. However, challenges such as stringent regulatory requirements and capacity constraints may impact market dynamics. Strategic collaborations and technological advancements will shape the industry's trajectory in the coming years.
The global market is thus likely to show high growth over the coming years at a CAGR of 12.5% and reach a global market size of US$ 14.95 Bn by 2032.
How Can the Global Antibody Contract Manufacturing Market Grow?
“Development of End-to-End Continuous Manufacturing Process”
The adoption of an end-to-end continuous manufacturing process is gaining attention as a transformative approach in antibody contract manufacturing. This method streamlines the production of biologics by integrating continuous processes such as viral inactivation, membrane chromatography refining, concentration/buffer exchange, and storage.
One key advancement is the use of perfusion bioreactors for therapeutic antibody production, which eliminates the need for batch-wise extraction, thereby reducing manufacturing time, operator involvement, and contamination risks.
Moreover, real-time quality monitoring enhances reliability and ensures stringent quality control. Cost simulations indicate that continuous manufacturing could significantly lower the cost of antibody drug production, making it a cost-effective alternative to traditional batch processes. A study by Steinebach et al. (2017) demonstrated successful continuous production of antibody drugs for 18 days with stable product quality, highlighting its feasibility at the lab scale.
However, the adoption of continuous manufacturing is progressing slower than expected due to the complexity of system implementation and the long time required to recover initial investments. Despite these challenges, advancements in digital technologies, such as supervisory control and data capture, present opportunities to accelerate the adoption of continuous biomanufacturing, driving market growth over the forecast period.
Can Market Growth Be Affected in Any Way?
“High Cost of Manufacturing and Lack of Skilled Professionals”
The cost of manufactured products is heavily impacted by international regulatory requirements, cGMP compliance, stricter inspection protocols, supply chain security concerns in emerging economies, and R&D funding for certain projects. These factors create financial barriers for new entrants looking to establish themselves in the biopharmaceutical contract manufacturing sector.
The biopharmaceutical contract manufacturing industry faces significant financial barriers, with high capital investment serving as a primary constraint. Over the past five years, biopharma companies have allocated more than US$ 50 million toward new facilities and equipment, underscoring the substantial cost burden associated with antibody manufacturing.
Notably, a considerable portion of these investments has been funneled into emerging markets and tax-efficient regions such as Singapore and Ireland, reflecting strategic efforts to optimize operational costs and regulatory advantages. This trend highlights the financial hurdles for new entrants while reinforcing the dominance of established players with the resources to navigate these high-cost requirements.
The majority of the projects have been outside of the U.S. Simply said, there are not enough facilities, and the ones that are available are not up to date with current pharmaceuticals. Designing, constructing, and qualifying a new plant takes close to four years. Costs for large-scale facilities might range from $1 billion to $2 billion.
Emerging regions face a shortage of skilled professionals, hindering economic growth and the expansion of the biotechnology sector. While governments aim to replicate the U.S. model, progress has been slow. Limited funding, poor planning, and a lack of qualified personnel have constrained antibody contract manufacturing in most emerging markets.
Country-wise Insights
Why is the North America Antibody Contract Manufacturing Market Booming?
“Rising Number of Clinical Trials and Increasing Demand for Contract Manufacturing”
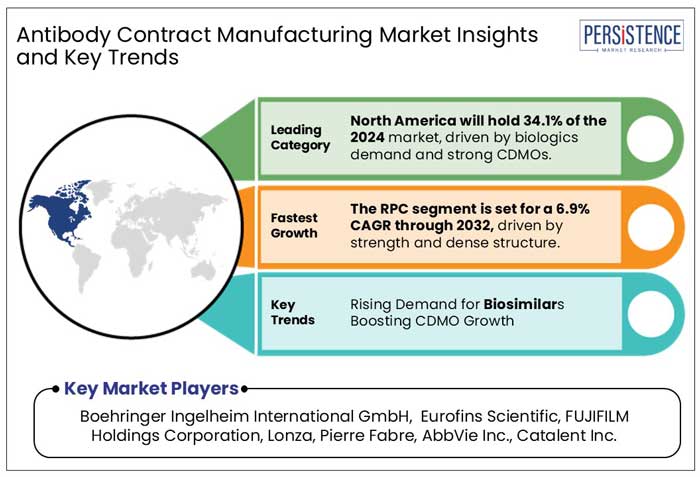
North America accounted for around 34.1 % market share in 2024. The growing number of clinical trials, the existence of major market participants, the advanced healthcare system, the rise in demand for antibodies contract manufacturing, and the increased focus of governments on biologics are all contributing factors.
Additionally, the number of mAb candidates for the treatment of COVID-19, reached human clinical trials, and were made more widely available to patients through fast-track approval or emergency use authorization in a matter of months. The market in the nation has expanded because of these activities.
Will Europe Be a Lucrative Market for Antibody Contract Manufacturing?
“Existing Recommendations and Guidelines for Treatment of Infectious Diseases by Medical Societies”
Europe held around 28.5% market share in 2024. The burden of various infectious/neglected diseases and drug-resistant bacterial infections falls disproportionately on poor nations, and as a result, there is not a significant financial incentive for pharmaceutical corporations to fund this study.
Alternative funding strategies are therefore filling the deficit. Nearly two-thirds of the world's financing for research and development on neglected and infectious diseases came from the public sector in 2016, with the US, UK, and European Commission taking the top spot.
With such initiatives and rising regulations, the European market is expected to expand at a lucrative pace over the forecast years.
How is East Asia Emerging as a Prominent Market?
“Recognized CMO Activity for Biologics in the Country”
East Asia held an estimated 18.3% market share in 2024. The antibody contract manufacturing market is witnessing significant growth, driven by the increasing role of contract manufacturing organizations (CMOs) in biologics production. Many countries are recognizing the importance of CMOs in meeting the rising demand for therapeutic antibodies. CMOs are expanding their capabilities to offer end-to-end biologics manufacturing solutions, including cell line development, process optimization, and large-scale production.
Key players are investing in advanced bioprocessing technologies such as single-use bioreactors and continuous manufacturing to enhance efficiency and reduce production costs. Additionally, regulatory agencies are supporting the expansion of biologics manufacturing infrastructure, further strengthening the market.
Several CMOs are establishing dedicated biologics facilities to cater to growing outsourcing needs, ensuring high-quality production standards. This increasing recognition of CMO activity for biologics is expected to drive market expansion, providing pharmaceutical companies with cost-effective and scalable manufacturing solutions for antibody therapeutics over the forecast period.
Category-wise Insights
Which Product is Driving Demand within the Global Market?
“Rising Chronic and Terminal Diseases and Development of Process Control Strategies”
The monoclonal antibodies segment held around 91.2% share of the total market in 2024. The production of monoclonal antibody (mAb) treatments involves a templated method that calls for reliable, scalable solutions for each step, from cell line generation until final fill.
Enhanced process knowledge has resulted in improvements in mAb production, including efficiency in both downstream and upstream processing.
Due to the importance of mAbs in the treatment of chronic or terminal diseases, manufacturers are always working to keep up with the rising demand on a worldwide scale, while also keeping prices under control and retaining production flexibility for their growing clinical pipelines, through contract manufacturing.
Which Expression System is Largely Adopted in the Global Market?
“High Exclusivity with Human Cell Expression”
The mammalian expression system held a share of about 86.2% in 2024. The most common platform for developing biopharmaceuticals is mammalian expression systems because these cell lines can generate large, complex proteins with post-translational modifications that are comparable to those produced in humans.
Additionally, most proteins in mammalian cell lines and animal cell lines in general can be secreted without the need for cell lysis to extract them followed by protein refolding. When compared to other mammalian expression systems, human cell lines have the capacity to produce proteins that are most like those that humans naturally synthesize.
With today's technological advancements, human cell lines can now be used more productively, and fibrosarcoma HT-1080 and human embryonic kidney 293 cell lines can now be used to generate approved recombinant bio therapeutic products.
Which Company Size Offers the Market a Profitable Outlook?
“Growth Potential in Mid-Size CDMOs”
Mid-sized companies held share of about 47.9% in the global market in 2024. Small and medium-sized pharmaceutical companies, which are playing a growing role in securing approvals for novel drugs yet often lack in-house manufacturing capabilities, will create new opportunities for CDMOs. A key challenge for these firms is the risk that CDMOs serving larger pharmaceutical companies may prioritize high-profile projects, potentially sidelining smaller clients.
As a result, focusing on the specific needs of smaller clients and catering to their unique requirements serves as a strong differentiator for CDMOs, driving market growth in this segment over the forecast period.
Which Scale of Operation Promotes Market Growth?
“High Disease Incidence and Rising CMO Activities to Meet Demand”
The commercial scale of operation held a share of about 56.1% in the global market in 2024. The growing prevalence of chronic and infectious diseases is driving demand for antibody therapeutics, boosting the antibody contract manufacturing market.
As pharmaceutical companies face increasing production needs, contract manufacturing organizations (CMOs) are expanding their biologics capabilities to meet demand. CMOs are adopting advanced technologies such as continuous manufacturing and single-use bioreactors to enhance production efficiency.
Large-scale manufacturing allows for economies of scale, increasing efficiency and reducing production costs crucial for meeting the rising global demand for antibody-based therapeutics. Additionally, growing biologics and biosimilars pipeline along with increasing regulatory support for outsourcing biologics manufacturing is further accelerating market growth. This trend is expected to strengthen commercial scale CMO activities, ensuring scalable and cost-effective antibody production globally.
Competition Landscape
The market for the contract manufacturing of antibodies is a consolidated market as major competitors pursue inorganic growth strategies to provide customers with comprehensive solutions. Furthermore, chances for contract manufacturing of antibodies with significant capabilities are growing as a result of scientific developments in biopharmaceuticals.
Differentiation strategies for long-term sustainability are being driven by the growing antibody contract manufacturing business strategy, innovation in the biopharmaceutical industry, disruptive drug discovery and manufacturing technologies, and significant growth potential in the production of high potency biopharmaceuticals.
Some key instances of development include:
- In December 2024, Novo Holdings acquired Catalent, expanding its European facilities to strengthen antibody production. This strategic move enhances biologics manufacturing, supporting increased demand for monoclonal antibodies and advanced therapeutic development across global pharmaceutical markets.
- In August 2024, Fusion Antibodies expanded its collaboration agreement with the National Cancer Institute (NCI). This expansion includes the humanization of several of NCI’s existing camelid nanobodies, which are beneficial in bi-specific therapies and Chimeric Antigen Receptor (CAR) therapies.
- In October 2024, Lonza extended its long-term collaboration with a major global biopharmaceutical partner for the commercial-scale manufacture of Antibody-Drug Conjugates (ADCs). This includes the construction of a new bioconjugation suite at Lonza’s Ibex® Biopark in Visp, Switzerland, which is expected to be operational by 2027.
Antibody Contract Manufacturing Market Scope
|
Attribute |
Details |
|
Historical Data/Actuals |
2019 - 2024 |
|
Forecast Period |
2025 - 2032 |
|
Market Analysis Units |
Value: US$ Mn/Mn |
|
Geographical Coverage |
|
|
Segments Covered |
|
|
Key Companies Covered |
|
|
Report Highlights |
|
|
Customization & Pricing |
Available upon Request |
Companies Covered in Antibodies Contract Manufacturing Market
- Aldevron
- Boehringer Ingelheim International GmbH
- Emergent
- Eurofins Scientific
- KBI Biopharma
- Lonza
- Novasep
- Nitto Avecia Pharma Services
- Pierre Fabre
- Samsung Biologics
- Synthon
- Thermo Fisher Scientific
- AbbVie Inc.
- Catalent Inc.
- WuXi Biologics
- Charles River Laboratories
- FUJIFILM Holdings Corporation
- mAbxience
Frequently Asked Questions
The global Antibody Contract Manufacturing market is estimated to increase from US$ 6.61 Bn in 2025 to US$ 14.95 Bn in 2032.
The global antibody contract manufacturing market is driven by rising biologics demand, biopharma outsourcing, GMP compliance, cost efficiency, technological advancements, and expanding biopharmaceutical CDMO capabilities.
The market is projected to record a CAGR of 12.3% during the forecast period from 2025 to 2032.
Boehringer Ingelheim International GmbH, Eurofins Scientific, FUJIFILM Holdings Corporation, Lonza, Pierre Fabre, AbbVie Inc., Catalent Inc. among others.
By product, Monoclonal Antibodies are expected to register the fastest CAGR of 14.2% through 2032.


