


- Executive Summary
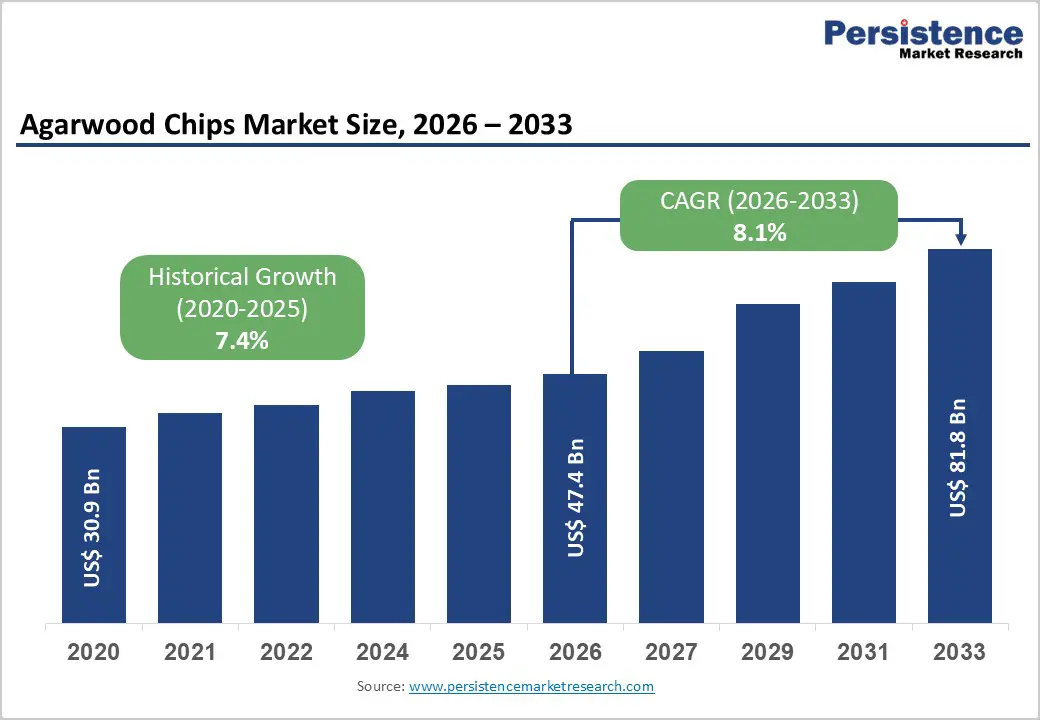
- Global Agarwood Chips Market Snapshot 2026 and 2033
- Market Opportunity Assessment, 2026 - 2033, US$ Bn
- Key Market Trends
- Industry Developments and Key Market Events
- Demand Side and Supply Side Analysis
- PMR Analysis and Recommendations
- Market Overview
- Market Scope and Definitions
- Market Dynamics
- Driver
- Restraint
- Opportunities
- Trends
- Macro-Economic Factors
- Global GDP Outlook
- Global Prison Growth Outlook
- Global Crime Rates by Country
- Global Prison Population by Country
- Global Private Prison Market Growth Outlook
- Other Macro-economic Factors
- Forecast Factors - Relevance and Impact
- COVID-19 Impact Assessment
- Value Added Insights
- Value Chain analysis
- Key Market Players
- Product Adoption Analysis
- Key Promotional Strategies by key players
- PESTLE Analysis
- Porter's Five Forces Analysis
- Regulatory and Technology Landscape
- Price Trend Analysis, 2025
- Region-wise Price Analysis
- Price by Segments
- Price Impact Factors
- Global Agarwood Chips Market Outlook: Historical (2020 - 2025) and Forecast (2026 - 2033)
- Key Highlights
- Global Agarwood Chips Market Outlook: Nature
- Introduction/Key Findings
- Historical Market Size (US$ Bn) and Volume (Units) Analysis by Nature, 2020-2025
- Current Market Size (US$ Bn) and Volume (Units) Forecast, by Nature, 2026-2033
- Organic
- Conventional
- Market Attractiveness Analysis: Nature
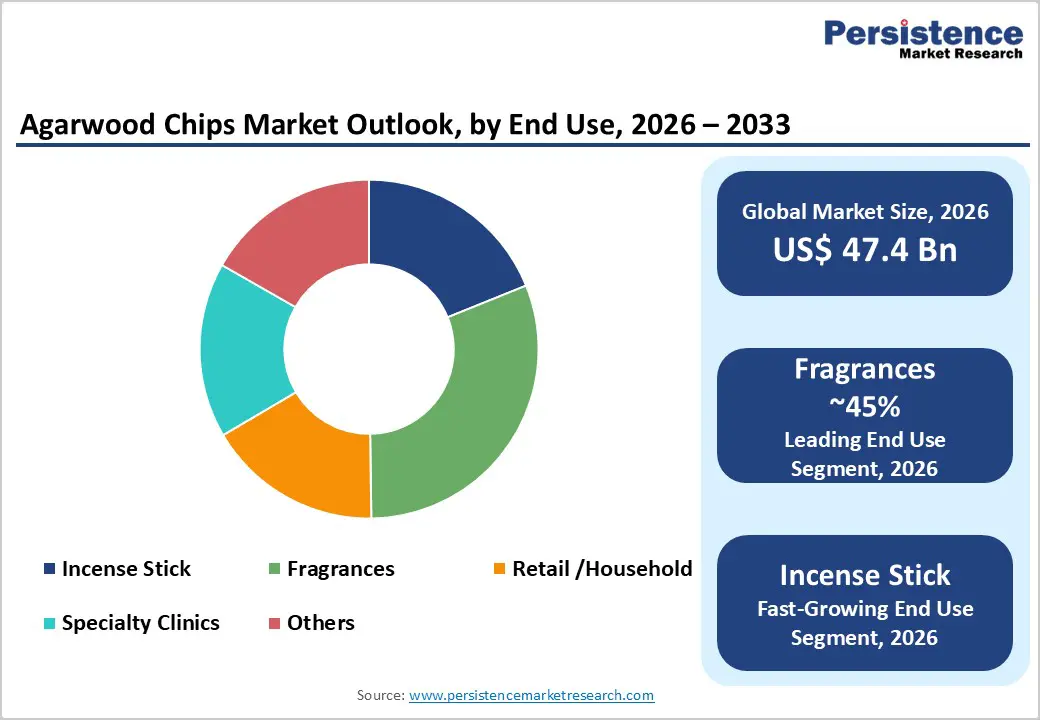
- Global Agarwood Chips Market Outlook: End Use
- Introduction/Key Findings
- Historical Market Size (US$ Bn) and Volume (Units) Analysis by End Use, 2020-2025
- Current Market Size (US$ Bn) and Volume (Units) Forecast, by End Use, 2026-2033
- Incense Stick
- Fragrances
- Retail /Household
- Specialty Clinics
- Others
- Market Attractiveness Analysis: End Use
- Global Agarwood Chips Market Outlook: Distribution Channel
- Introduction/Key Findings
- Historical Market Size (US$ Bn) and Volume (Units) Analysis by Distribution Channel, 2020-2025
- Current Market Size (US$ Bn) and Volume (Units) Forecast, by Distribution Channel, 2026-2033
- Business to Business (B2B)
- Business to Consumers (B2C)
- Market Attractiveness Analysis: Distribution Channel
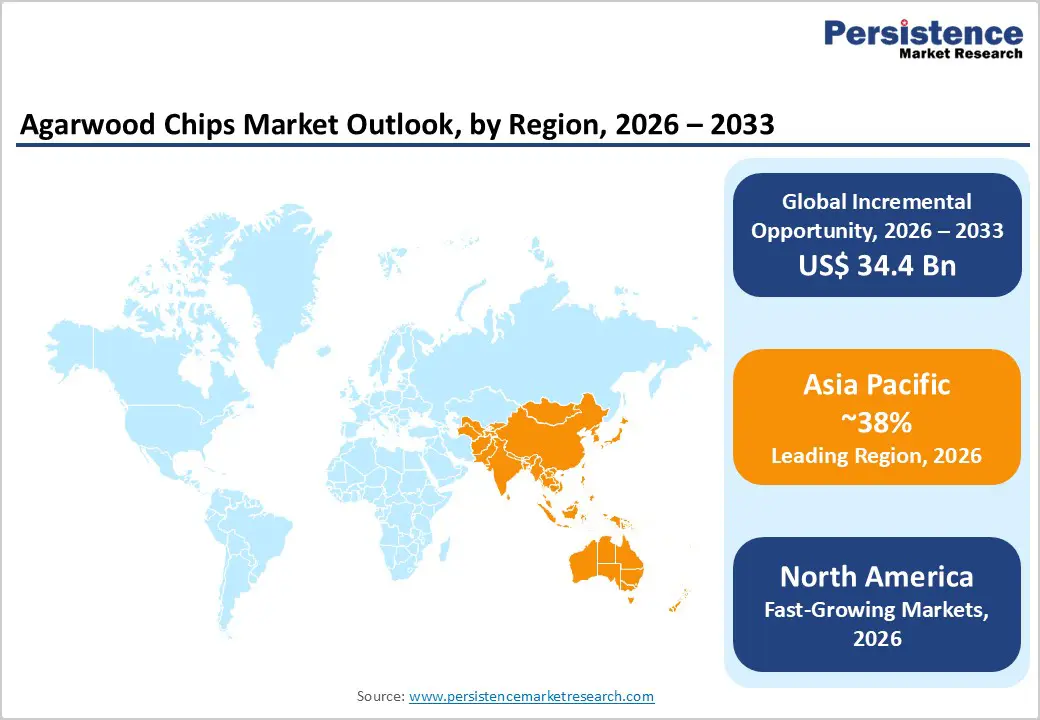
- Global Agarwood Chips Market Outlook: Region
- Key Highlights
- Historical Market Size (US$ Bn) and Volume (Units) Analysis by Region, 2020-2025
- Current Market Size (US$ Bn) and Volume (Units) Forecast, by Region, 2026-2033
- North America
- Europe
- East Asia
- South Asia & Oceania
- Latin America
- Middle East & Africa
- Market Attractiveness Analysis: Region
- North America Agarwood Chips Market Outlook: Historical (2020 - 2025) and Forecast (2026 - 2033)
- Key Highlights
- Pricing Analysis
- North America Market Size (US$ Bn) and Volume (Units) Forecast, by Country, 2026-2033
- U.S.
- Canada
- North America Market Size (US$ Bn) and Volume (Units) Forecast, by Nature, 2026-2033
- Organic
- Conventional
- North America Market Size (US$ Bn) and Volume (Units) Forecast, by End Use, 2026-2033
- Incense Stick
- Fragrances
- Retail /Household
- Specialty Clinics
- Others
- North America Market Size (US$ Bn) and Volume (Units) Forecast, by Distribution Channel, 2026-2033
- Business to Business (B2B)
- Business to Consumers (B2C)
- Europe Agarwood Chips Market Outlook: Historical (2020 - 2025) and Forecast (2026 - 2033)
- Key Highlights
- Pricing Analysis
- Europe Market Size (US$ Bn) and Volume (Units) Forecast, by Country, 2026-2033
- Germany
- Italy
- France
- U.K.
- Spain
- Russia
- Rest of Europe
- Europe Market Size (US$ Bn) and Volume (Units) Forecast, by Nature, 2026-2033
- Organic
- Conventional
- Europe Market Size (US$ Bn) and Volume (Units) Forecast, by End Use, 2026-2033
- Incense Stick
- Fragrances
- Retail /Household
- Specialty Clinics
- Others
- Europe Market Size (US$ Bn) and Volume (Units) Forecast, by Distribution Channel, 2026-2033
- Business to Business (B2B)
- Business to Consumers (B2C)
- East Asia Agarwood Chips Market Outlook: Historical (2020 - 2025) and Forecast (2026 - 2033)
- Key Highlights
- Pricing Analysis
- East Asia Market Size (US$ Bn) and Volume (Units) Forecast, by Country, 2026-2033
- China
- Japan
- South Korea
- East Asia Market Size (US$ Bn) and Volume (Units) Forecast, by Nature, 2026-2033
- Organic
- Conventional
- East Asia Market Size (US$ Bn) and Volume (Units) Forecast, by End Use, 2026-2033
- Incense Stick
- Fragrances
- Retail /Household
- Specialty Clinics
- Others
- East Asia Market Size (US$ Bn) and Volume (Units) Forecast, by Distribution Channel, 2026-2033
- Business to Business (B2B)
- Business to Consumers (B2C)
- South Asia & Oceania Agarwood Chips Market Outlook: Historical (2020 - 2025) and Forecast (2026 - 2033)
- Key Highlights
- Pricing Analysis
- South Asia & Oceania Market Size (US$ Bn) and Volume (Units) Forecast, by Country, 2026-2033
- India
- Southeast Asia
- ANZ
- Rest of SAO
- South Asia & Oceania Market Size (US$ Bn) and Volume (Units) Forecast, by Nature, 2026-2033
- Organic
- Conventional
- South Asia & Oceania Market Size (US$ Bn) and Volume (Units) Forecast, by End Use, 2026-2033
- Incense Stick
- Fragrances
- Retail /Household
- Specialty Clinics
- Others
- South Asia & Oceania Market Size (US$ Bn) and Volume (Units) Forecast, by Distribution Channel, 2026-2033
- Business to Business (B2B)
- Business to Consumers (B2C)
- Latin America Agarwood Chips Market Outlook: Historical (2020 - 2025) and Forecast (2026 - 2033)
- Key Highlights
- Pricing Analysis
- Latin America Market Size (US$ Bn) and Volume (Units) Forecast, by Country, 2026-2033
- Brazil
- Mexico
- Rest of LATAM
- Latin America Market Size (US$ Bn) and Volume (Units) Forecast, by Nature, 2026-2033
- Organic
- Conventional
- Latin America Market Size (US$ Bn) and Volume (Units) Forecast, by End Use, 2026-2033
- Incense Stick
- Fragrances
- Retail /Household
- Specialty Clinics
- Others
- Latin America Market Size (US$ Bn) and Volume (Units) Forecast, by Distribution Channel, 2026-2033
- Business to Business (B2B)
- Business to Consumers (B2C)
- Middle East & Africa Agarwood Chips Market Outlook: Historical (2020 - 2025) and Forecast (2026 - 2033)
- Key Highlights
- Pricing Analysis
- Middle East & Africa Market Size (US$ Bn) and Volume (Units) Forecast, by Country, 2026-2033
- GCC Countries
- South Africa
- Northern Africa
- Rest of MEA
- Middle East & Africa Market Size (US$ Bn) and Volume (Units) Forecast, by Nature, 2026-2033
- Organic
- Conventional
- Middle East & Africa Market Size (US$ Bn) and Volume (Units) Forecast, by End Use, 2026-2033
- Incense Stick
- Fragrances
- Retail /Household
- Specialty Clinics
- Others
- Middle East & Africa Market Size (US$ Bn) and Volume (Units) Forecast, by Distribution Channel, 2026-2033
- Business to Business (B2B)
- Business to Consumers (B2C)
- Competition Landscape
- Market Share Analysis, 2025
- Market Structure
- Competition Intensity Mapping
- Competition Dashboard
- Company Profiles
- Grandawood Agarwood Australia
- Company Overview
- Product Portfolio/Offerings
- Key Financials
- SWOT Analysis
- Company Strategy and Key Developments
- Binh Nghia Agarwood Co., Ltd
- Hoang Giang Agarwood Ltd.
- Aalam Ul Oud
- KAB Industries
- Duy Hai AGARWOOD.
- Thien Phu agarwood Co.,Ltd
- Asia Plantation Capital Pte Ltd.
- Ori Oud Asia
- ASSAM AROMAS
- Sadaharitha plantations limited
- Green Agro
- Thai Borai Agarwood Co.,Ltd.
- KANHA AROMA
- Homegrown Concept Sdn Bhd (HGC)
- Grandawood Agarwood Australia
- Appendix
- Research Methodology
- Research Assumptions
- Acronyms and Abbreviations

Loading page data
Please wait a moment


