

- Executive Summary
- Global Wound Antiseptics Market Snapshot, 2026 and 2033
- Market Opportunity Assessment, 2026 - 2033, US$ Mn
- Key Market Trends
- Future Market Projections
- Premium Market Insights
- Industry Developments and Key Market Events
- PMR Analysis and Recommendations
- Market Overview
- Market Scope and Definition
- Market Dynamics
- Drivers
- Restraints
- Opportunity
- Challenges
- Key Trends
- COVID-19 Impact Analysis
- Forecast Factors - Relevance and Impact
- Value Added Insights
- Value Chain Analysis
- Product Type Adoption / Usage Analysis
- Key Market Players
- Key Promotional Strategies, By Key Players
- Regulatory Landscape
- PESTLE Analysis
- Porter’s Five Force Analysis
- Global Wound Antiseptics Market Outlook
- Key Highlights
- Market Size (US$ Mn) and Y-o-Y Growth
- Absolute $ Opportunity
- Market Size (US$ Mn) Analysis and Forecast
- Historical Market Size (US$ Mn) Analysis, 2020-2024
- Market Size (US$ Mn) Analysis and Forecast, 2025-2033
- Global Wound Antiseptics Market Outlook: Product Type
- Historical Market Size (US$ Mn) Analysis, By Product Type, 2020-2024
- Market Size (US$ Mn) Analysis and Forecast, By Product Type, 2025-2033
- PHMB
- Povidone Iodine
- Hydrogen Peroxide
- Market Attractiveness Analysis: Product Type
- Global Wound Antiseptics Market Outlook: Wound Type
- Historical Market Size (US$ Mn) Analysis, By Wound Type, 2020-2024
- Market Size (US$ Mn) Analysis and Forecast, By Wound Type, 2025-2033
- Antiseptics for Acute Wounds
- Surgical Wounds
- Traumatic Wounds
- Antiseptics for Chronic Wounds
- Vascular Ulcers
- Diabetic Ulcers
- Pressure Ulcers
- Surgical Ulcers
- Traumatic Ulcers
- Wound Antiseptics for Burns
- Antiseptics for Acute Wounds
- Market Attractiveness Analysis: Wound Type
- Global Wound Antiseptics Market Outlook: Form
- Historical Market Size (US$ Mn) Analysis, By Form, 2020-2024
- Market Size (US$ Mn) Analysis and Forecast, By Form, 2025-2033
- Sprays
- Solutions
- Foams
- Wipes
- Gels
- Market Attractiveness Analysis: Form
- Global Wound Antiseptics Market Outlook: End-User
- Historical Market Size (US$ Mn) Analysis, By End-User, 2020-2024
- Market Size (US$ Mn) Analysis and Forecast, By End-User, 2025-2033
- Hospitals
- Ambulatory Surgical Centers
- Clinics
- Long-term Care Centers
- Home Care Settings
- Market Attractiveness Analysis: End-User
- Key Highlights
- Global Wound Antiseptics Market Outlook: Region
- Historical Market Size (US$ Mn) Analysis, By Region, 2020-2024
- Market Size (US$ Mn) Analysis and Forecast, By Region, 2025-2033
- North America
- Latin America
- Europe
- East Asia
- South Asia and Oceania
- Middle East & Africa
- Market Attractiveness Analysis: Region
- North America Wound Antiseptics Market Outlook
- Historical Market Size (US$ Mn) Analysis, By Market, 2020-2024
- By Country
- By Product Type
- By Wound Type
- By Form
- By End-User
- Market Size (US$ Mn) Analysis and Forecast by Country, 2025-2033
- U.S.
- Canada
- Market Size (US$ Mn) Analysis and Forecast, By Product Type, 2025-2033
- PHMB
- Povidone Iodine
- Hydrogen Peroxide
- Market Size (US$ Mn) Analysis and Forecast, By Wound Type, 2025-2033
- Antiseptics for Acute Wounds
- Surgical Wounds
- Traumatic Wounds
- Antiseptics for Chronic Wounds
- Vascular Ulcers
- Diabetic Ulcers
- Pressure Ulcers
- Surgical Ulcers
- Traumatic Ulcers
- Wound Antiseptics for Burns
- Antiseptics for Acute Wounds
- Market Size (US$ Mn) Analysis and Forecast, By Form, 2025-2033
- Sprays
- Solutions
- Foams
- Wipes
- Gels
- Market Size (US$ Mn) Analysis and Forecast, By End-User, 2025-2033
- Hospitals
- Ambulatory Surgical Centers
- Clinics
- Long-term Care Centers
- Home Care Settings
- Market Attractiveness Analysis
- Historical Market Size (US$ Mn) Analysis, By Market, 2020-2024
- Europe Wound Antiseptics Market Outlook
- Historical Market Size (US$ Mn) Analysis, By Market, 2020-2024
- By Country
- By Product Type
- By Wound Type
- By Form
- By End-User
- Market Size (US$ Mn) Analysis and Forecast by Country, 2025-2033
- Germany
- France
- U.K.
- Italy
- Spain
- Russia
- Rest of Europe
- Market Size (US$ Mn) Analysis and Forecast, By Product Type, 2025-2033
- PHMB
- Povidone Iodine
- Hydrogen Peroxide
- Market Size (US$ Mn) Analysis and Forecast, By Wound Type, 2025-2033
- Antiseptics for Acute Wounds
- Surgical Wounds
- Traumatic Wounds
- Antiseptics for Chronic Wounds
- Vascular Ulcers
- Diabetic Ulcers
- Pressure Ulcers
- Surgical Ulcers
- Traumatic Ulcers
- Wound Antiseptics for Burns
- Antiseptics for Acute Wounds
- Market Size (US$ Mn) Analysis and Forecast, By Form, 2025-2033
- Sprays
- Solutions
- Foams
- Wipes
- Gels
- Market Size (US$ Mn) Analysis and Forecast, By End-User, 2025-2033
- Hospitals
- Ambulatory Surgical Centers
- Clinics
- Long-term Care Centers
- Home Care Settings
- Market Attractiveness Analysis
- Historical Market Size (US$ Mn) Analysis, By Market, 2020-2024
- East Asia Wound Antiseptics Market Outlook
- Historical Market Size (US$ Mn) Analysis, By Market, 2020-2024
- By Country
- By Product Type
- By Wound Type
- By Form
- By End-User
- Market Size (US$ Mn) Analysis and Forecast by Country, 2025-2033
- China
- Japan
- South Korea
- Market Size (US$ Mn) Analysis and Forecast, By Product Type, 2025-2033
- PHMB
- Povidone Iodine
- Hydrogen Peroxide
- Market Size (US$ Mn) Analysis and Forecast, By Wound Type, 2025-2033
- Antiseptics for Acute Wounds
- Surgical Wounds
- Traumatic Wounds
- Antiseptics for Chronic Wounds
- Vascular Ulcers
- Diabetic Ulcers
- Pressure Ulcers
- Surgical Ulcers
- Traumatic Ulcers
- Wound Antiseptics for Burns
- Antiseptics for Acute Wounds
- Market Size (US$ Mn) Analysis and Forecast, By Form, 2025-2033
- Sprays
- Solutions
- Foams
- Wipes
- Gels
- Market Size (US$ Mn) Analysis and Forecast, By End-User, 2025-2033
- Hospitals
- Ambulatory Surgical Centers
- Clinics
- Long-term Care Centers
- Home Care Settings
- Market Attractiveness Analysis
- Historical Market Size (US$ Mn) Analysis, By Market, 2020-2024
- South Asia & Oceania Wound Antiseptics Market Outlook
- Historical Market Size (US$ Mn) Analysis, By Market, 2020-2024
- By Country
- By Product Type
- By Wound Type
- By Form
- By End-User
- Market Size (US$ Mn) Analysis and Forecast by Country, 2025-2033
- India
- Indonesia
- Thailand
- Singapore
- ANZ
- Rest of South Asia & Oceania
- Market Size (US$ Mn) Analysis and Forecast, By Product Type, 2025-2033
- PHMB
- Povidone Iodine
- Hydrogen Peroxide
- Market Size (US$ Mn) Analysis and Forecast, By Wound Type, 2025-2033
- Antiseptics for Acute Wounds
- Surgical Wounds
- Traumatic Wounds
- Antiseptics for Chronic Wounds
- Vascular Ulcers
- Diabetic Ulcers
- Pressure Ulcers
- Surgical Ulcers
- Traumatic Ulcers
- Wound Antiseptics for Burns
- Antiseptics for Acute Wounds
- Market Size (US$ Mn) Analysis and Forecast, By Form, 2025-2033
- Sprays
- Solutions
- Foams
- Wipes
- Gels
- Market Size (US$ Mn) Analysis and Forecast, By End-User, 2025-2033
- Hospitals
- Ambulatory Surgical Centers
- Clinics
- Long-term Care Centers
- Home Care Settings
- Market Attractiveness Analysis
- Historical Market Size (US$ Mn) Analysis, By Market, 2020-2024
- Latin America Wound Antiseptics Market Outlook
- Historical Market Size (US$ Mn) Analysis, By Market, 2020-2024
- By Country
- By Product Type
- By Wound Type
- By Form
- By End-User
- Market Size (US$ Mn) Analysis and Forecast by Country, 2025-2033
- Brazil
- Mexico
- Rest of Latin America
- Market Size (US$ Mn) Analysis and Forecast, By Product Type, 2025-2033
- PHMB
- Povidone Iodine
- Hydrogen Peroxide
- Market Size (US$ Mn) Analysis and Forecast, By Wound Type, 2025-2033
- Antiseptics for Acute Wounds
- Surgical Wounds
- Traumatic Wounds
- Antiseptics for Chronic Wounds
- Vascular Ulcers
- Diabetic Ulcers
- Pressure Ulcers
- Surgical Ulcers
- Traumatic Ulcers
- Wound Antiseptics for Burns
- Antiseptics for Acute Wounds
- Market Size (US$ Mn) Analysis and Forecast, By Form, 2025-2033
- Sprays
- Solutions
- Foams
- Wipes
- Gels
- Market Size (US$ Mn) Analysis and Forecast, By End-User, 2025-2033
- Hospitals
- Ambulatory Surgical Centers
- Clinics
- Long-term Care Centers
- Home Care Settings
- Market Attractiveness Analysis
- Historical Market Size (US$ Mn) Analysis, By Market, 2020-2024
- Middle East & Africa Wound Antiseptics Market Outlook
- Historical Market Size (US$ Mn) Analysis, By Market, 2020-2024
- By Country
- By Product Type
- By Wound Type
- By Form
- By End-User
- Market Size (US$ Mn) Analysis and Forecast by Country, 2025-2033
- GCC Countries
- Egypt
- South Africa
- Northern Africa
- Rest of Middle East & Africa
- Market Size (US$ Mn) Analysis and Forecast, By Wound Type, 2025-2033
- Antiseptics for Acute Wounds
- Surgical Wounds
- Traumatic Wounds
- Antiseptics for Chronic Wounds
- Vascular Ulcers
- Diabetic Ulcers
- Pressure Ulcers
- Surgical Ulcers
- Traumatic Ulcers
- Wound Antiseptics for Burns
- Antiseptics for Acute Wounds
- Market Size (US$ Mn) Analysis and Forecast, By Form, 2025-2033
- Sprays
- Solutions
- Foams
- Wipes
- Gels
- Market Size (US$ Mn) Analysis and Forecast, By End-User, 2025-2033
- Hospitals
- Ambulatory Surgical Centers
- Clinics
- Long-term Care Centers
- Home Care Settings
- Market Attractiveness Analysis
- Historical Market Size (US$ Mn) Analysis, By Market, 2020-2024
- Competition Landscape
- Market Share Analysis, 2025
- Market Structure
- Competition Intensity Mapping by Market
- Competition Dashboard
- Company Profiles (Details - Overview, Financials, Strategy, Recent Developments)
- Smith and Nephew
- Overview
- Segments and Wound Types
- Key Financials
- Market Developments
- Market Strategy
- Johnson & Johnson Consumer Inc.
- Reckitt Benckiser Group plc.
- Angelini Pharma Inc.
- 3M Company
- Becton Dickenson & Company
- Johnson & Johnson Services, Inc.
- B. Braun Melsungen AG
- Purdue Pharma L.P.
- Ecolab
- Schülke & Mayr GmbH
- PSK Pharma Pvt. Ltd.
- Others
- Smith and Nephew
- Appendix
- Research Methodology
- Research Assumptions
- Acronyms and Abbreviations


- Pharmaceuticals
- Wound Antiseptics Market
Wound Antiseptics Market Size, Share, Growth, and Regional Forecast, 2026 to 2033
Wound Antiseptics Market by Product Type (PHMB, Povidone Iodine, Hydrogen Peroxide), by Wound Type (Antiseptics for Acute Wounds, Antiseptics for Chronic Wounds, Wound Antiseptics for Burns), by Form (Sprays, Solutions, Foams, Wipes, Gels), End-user, and Regional Analysis, from 2026 to 2033
Key Industry Highlights
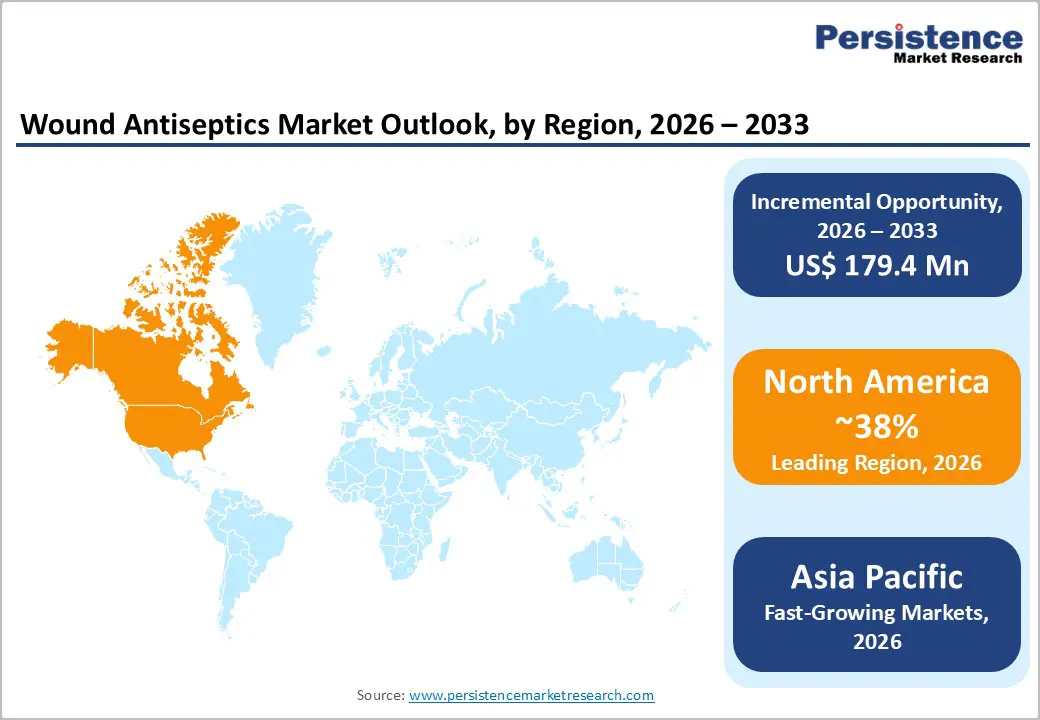
- Leading Region: North America leads due to high chronic wound burden, advanced wound care adoption, strong reimbursement systems, and established clinical protocols.
- Fastest Growing Region: Asia Pacific is the fastest growing region, supported by expanding healthcare infrastructure, rising diabetes prevalence, and improving wound care awareness.
- Dominant Segment: Solutions dominate the market, driven by widespread use in wound cleansing, debridement preparation, and infection control across care settings.
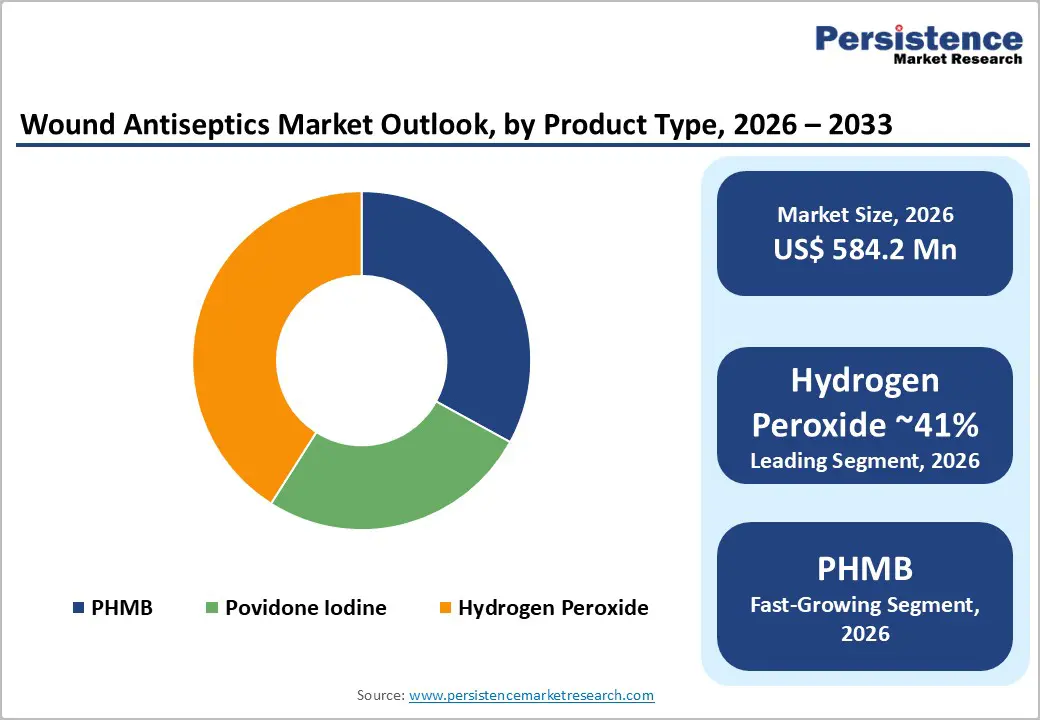
- Fastest Growing Segment: PHMB-based antiseptics are growing fast due to broad antimicrobial efficacy, biofilm control, tissue compatibility, and rising guideline acceptance.
| Key Insights | Details |
|---|---|
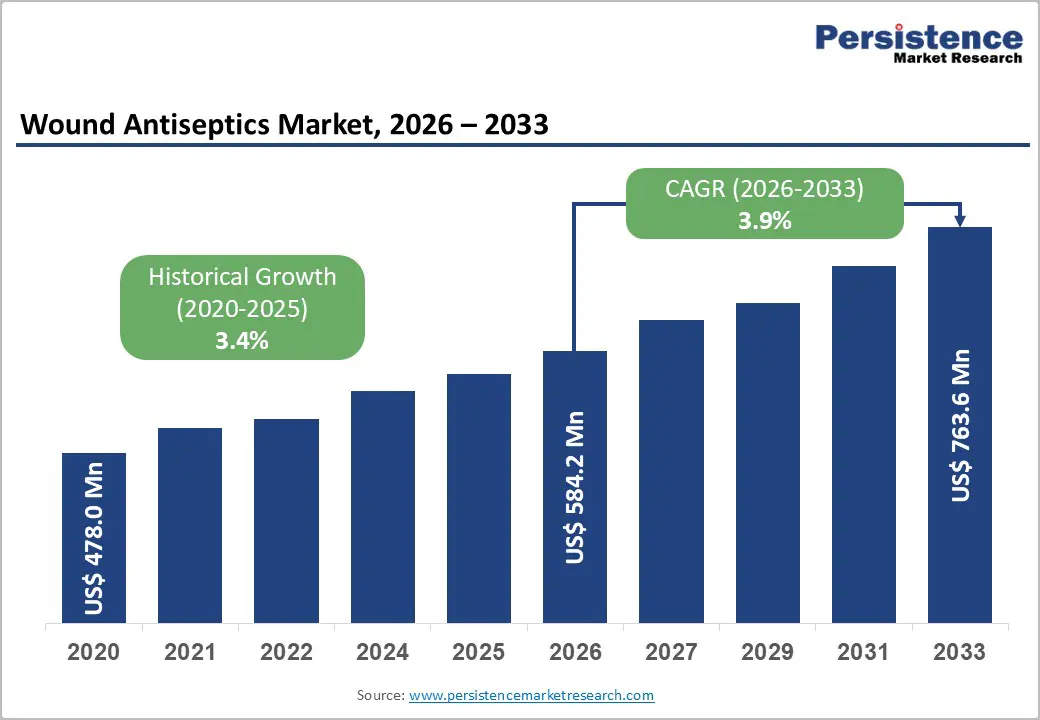
| Wound Antiseptics Market Size (2026E) | US$ 584.2 Mn |
| Market Value Forecast (2033F) | US$ 763.6 Mn |
| Projected Growth (CAGR 2026 to 2033) | 3.9% |
| Historical Market Growth (CAGR 2020 to 2025) | 3.4% |
Market Dynamics
Driver - Transition Toward Advanced Wound Care and Expansion in Developing Regions
The increasing shift from conventional wound management practices to advanced wound care treatment options is a key driver of the wound antiseptics market. Healthcare institutions are increasingly adopting standardized wound care protocols that emphasize effective infection control, faster healing, and improved patient outcomes. These structured approaches help reduce hospital stay durations and lower the risk of chronic wound infections, benefiting both patients and healthcare systems. Growing acceptance of evidence-based treatment pathways among clinicians, supported by clinical and economic outcomes data, has accelerated the transition toward advanced wound care solutions. Patients with chronic wounds are increasingly aware of modern treatment options, further driving demand for advanced wound antiseptics over traditional methods.
In parallel, expanding focus on developing markets such as Latin America and the Asia Pacific is significantly contributing to market growth. These regions remain relatively underpenetrated for wound antiseptic products, offering substantial untapped potential for manufacturers. A large patient base, rising incidence of chronic conditions, and a rapidly growing elderly population are increasing the need for effective wound care solutions. In response, key players are strengthening their regional presence through improved distribution networks, local partnerships, and market education initiatives. These factors collectively create favorable conditions for the adoption of wound antiseptics and support sustained market expansion in emerging economies.
Restraints - High Product Costs and Limited Awareness in Developing Regions
The high cost associated with advanced wound antiseptics remains a significant barrier to market growth, particularly in price-sensitive healthcare systems. Advanced wound care products often carry higher per-unit costs, making them less accessible for routine use in chronic wound management. As a result, both physicians and patients frequently prefer cost-effective alternatives, especially in developing regions where healthcare spending is limited. Despite the availability of bioengineered dressings and advanced antiseptic formulations, traditional wound care products remain widely used due to their affordability. Additionally, the increasing number of product recalls linked to component inconsistencies, product malfunctions, and packaging defects has raised concerns about product reliability, potentially limiting clinician confidence and slowing adoption rates.
Another major restraint is the lack of awareness and delayed diagnosis of chronic wounds in developing countries. Conditions such as diabetic foot ulcers, leg ulcers, and pressure ulcers often worsen due to late clinical intervention. Limited patient awareness, inadequate access to specialized healthcare facilities, and the absence of well-defined national wound care guidelines contribute to delayed diagnosis. In countries such as India, China, and Brazil, prolonged delays in identifying and treating chronic wounds reduce the timely use of advanced wound antiseptics, thereby restricting market penetration in emerging economies.
Opportunity - Integration with Multidisciplinary Wound Care Pathways and Home-Based Care
A significant opportunity in the wound antiseptics market lies in integrating them into multidisciplinary wound care pathways and in the growing shift toward outpatient and home-based care models. Chronic wound management often requires long-term coordination among surgeons, diabetologists, vascular specialists, and specialized wound care nurses. As healthcare systems increasingly adopt standardized clinical pathways for conditions such as diabetic foot ulcers, venous leg ulcers, and pressure injuries, antiseptics are becoming essential components of routine care. Their use spans multiple stages, including wound cleansing, debridement support, peri-procedural preparation, and infection prevention during ongoing treatment.
At the same time, the expansion of home healthcare services and telemedicine is transforming how chronic wounds are managed. Patients and caregivers are seeking antiseptic products that are safe, simple to apply, and suitable for frequent use outside hospital environments. Formats such as sprays, foams, solutions, and wipes are gaining relevance in home settings, supported by remote guidance and digital education tools. Manufacturers that align antiseptic products with dressings, caregiver training resources, and digital monitoring platforms are well positioned to address evolving care models and unlock new growth opportunities in patient-centric wound management.
Category-wise Analysis
By Product Type Insights
Among wound antiseptic product types, hydrogen peroxide continues to hold a strong position in the market, accounting for an estimated 41% share in 2025 within the category that includes PHMB, povidone iodine, and hydrogen peroxide. Its long-standing use in wound irrigation and surface decontamination supports high adoption, particularly in emergency care, first aid, and minor acute wounds. The effervescent action of hydrogen peroxide helps loosen debris and contaminants, making it familiar and convenient for both clinicians and consumers. Its low cost and widespread availability further contribute to high-volume usage across primary care and household settings. However, increasing clinical awareness regarding potential cytotoxic effects has resulted in more selective use, especially for chronic and non-healing wounds. As treatment approaches evolve, manufacturers are responding by refining formulations, optimizing concentrations, and developing combination products. At the same time, educational initiatives are being strengthened to promote appropriate use, while complementary antiseptic agents gain preference for long-term wound management.
By Wound Type Insights
Chronic wounds represent the largest share of antiseptic usage, driven by their high prevalence, prolonged healing timelines, and substantial healthcare costs. Conditions such as diabetic foot ulcers, venous leg ulcers, and pressure ulcers affect millions of patients and often require ongoing infection control to support healing. These wounds are particularly vulnerable to microbial colonization and biofilm formation, which can delay closure and increase complication risks. As a result, topical antiseptics play a critical role in routine wound care, often used repeatedly alongside debridement and advanced dressings. Clinical practice guidelines support the use of agents such as PHMB, povidone iodine, and hypochlorite solutions for managing infected or critically colonized chronic wounds, especially when prolonged antibiotic use is undesirable. With the global rise in diabetes, vascular disease, and aging populations, demand for antiseptics in chronic wound care is expected to remain strong, particularly within specialized wound clinics, hospitals, and long-term care facilities.
Region-wise Insights
North America Wound Antiseptics Market Trends
The U.S. wound antiseptics market leads the North American region, accounting for a dominant share of 86.7% in 2025, and is expected to maintain strong growth momentum in the coming years. The rising burden of chronic wounds is a key contributor, with millions of Americans affected due to an aging population and increasing prevalence of diabetes and obesity. Chronic conditions such as diabetic foot ulcers, venous leg ulcers, and pressure injuries continue to drive sustained demand for wound antiseptic solutions across acute and long-term care settings. Favorable reimbursement coverage under Medicare and Medicaid has further supported product adoption, particularly through scalable payment models that encourage standardized wound management practices.
North America’s wound antiseptics market is further supported by high healthcare expenditure, widespread adoption of advanced wound care protocols, and strong regulatory oversight. Chronic wounds affect a significant proportion of the U.S. population and generate substantial healthcare costs annually. Hospitals and specialized wound care centers increasingly follow evidence-based treatment pathways that integrate antiseptics for infection control and biofilm management. Regulatory guidance from the FDA, combined with national awareness initiatives, promotes early intervention and multidisciplinary care. The strong presence of leading manufacturers, research institutions, and outpatient reimbursement frameworks continues to accelerate innovation and adoption across hospital, outpatient, and home-care environments.
Asia and Pacific Wound Antiseptics Market Trends
The Asia Pacific wound antiseptics market is expected to grow rapidly due to the rising number of people with diabetes, chronic wounds, and injuries. Countries such as China, India, and Japan are seeing more cases of diabetic foot ulcers, vascular diseases, and slow-healing wounds. In addition, road accidents and workplace injuries continue to increase the number of acute wounds that require proper infection control. In many parts of the region, especially India, patients often face delays in accessing specialized wound care, highlighting the need for easy-to-use antiseptic solutions in hospitals and community settings.
Growth in tertiary hospitals, outpatient clinics, and long-term care facilities is increasing the use of standardized wound treatment practices. This is driving demand for antiseptic sprays, solutions, foams, and medicated dressings. Local manufacturers are producing affordable antiseptics, improving access in both cities and rural areas. As awareness and training on wound infection and biofilm control improve, the use of advanced antiseptic agents is expected to rise. Expanding home care services and pharmacy networks further support market growth across the region.
Competitive Landscape
The global wound antiseptics market is moderately fragmented, comprising diversified medical device and consumer healthcare companies alongside specialized wound care manufacturers. Key players include Smith and Nephew, Johnson & Johnson Consumer Inc., Reckitt Benckiser Group plc., Angelini Pharma Inc., 3M Company, Becton Dickinson & Company, Johnson & Johnson Services, Inc., B. Braun Melsungen AG, Purdue Pharma L.P., and Ecolab, many of which offer antiseptic solutions, sprays, and antiseptic-impregnated dressings as part of broader wound care portfolios. Competitive strategies center on R&D for safer, more effective formulations; expansion of indications for chronic and biofilm-rich wounds; and integration of antiseptics with advanced dressings and negative-pressure systems. Companies also invest in clinician education, guideline dissemination, and collaborative research to generate high-quality evidence, while exploring emerging business models that support home-care, telemedicine, and value-based procurement.
Key Industry Developments:
- In June 2025, Cipla Health launched the ‘Cipladine Aapka Fast Aid Expert’ campaign with Neena Gupta, strengthening Cipladine’s position as a trusted solution for fast, effective wound and infection care in India.
- In March 2024, Novo Nordisk’s Pharmatech division partnered with U.S.-based Actylis, a manufacturer and supplier of pharmaceutical raw materials, to supply the antiseptic and disinfectant benzalkonium chloride to several European countries.
- In April 2023, 3M Health Care announced the launch of its FDA-approved 3M™ SoluPrep™ S Sterile Antiseptic Solution, combining chlorhexidine gluconate and isopropyl alcohol for preoperative skin preparation.
Companies Covered in Wound Antiseptics Market
- Smith and Nephew
- Johnson & Johnson Consumer Inc.
- Reckitt Benckiser Group plc.
- Angelini Pharma Inc.
- 3M Company
- Becton Dickenson & Company
- Johnson & Johnson Services, Inc.
- B. Braun Melsungen AG
- Purdue Pharma L.P.
- Ecolab
- Schülke & Mayr GmbH
- PSK Pharma Pvt. Ltd.
- Others
Frequently Asked Questions
The global wound antiseptics market is projected to be valued at US$ 584.2 Mn in 2026.
Rising chronic wounds, increasing diabetes prevalence, and growing adoption of advanced wound care protocols globally.
The global market is expected to witness a CAGR of 3.9% between 2026 and 2033.
Integration into home-based care, multidisciplinary treatment pathways, telehealth support, and demand for easy-to-use antiseptic formulations.
North America is the leading region in the global wound antiseptics market.


