Warehouse Management Systems Market

Global Market Study on Warehouse Management Systems: Rising Adoption of Machine-to-Machine (M2M) Technology to Improve Warehouse Management Functions

Warehouse Management Systems Market Segmentation By Component- (Hardware, Software, Service), Unites States dominate the global warehouse management systems market, it held a share of 17.3% in 2022.

- Table of Content -

1. Executive Summary

    1.1. Global Market Outlook

    1.2. Demand Side Trends

    1.3. Supply Side Trends

    1.4. Analysis and Recommendations

2. Market Overview

    2.1. Market Coverage / Taxonomy

    2.2. Market Definition / Scope / Limitations

3. Key Market Trends

    3.1. Key Trends Impacting the Market

    3.2. Product Innovation / Development Trends

4. Pricing Analysis

    4.1. Pricing Analysis, By Warehouse Management Systems

    4.2. Average Pricing Analysis Benchmark

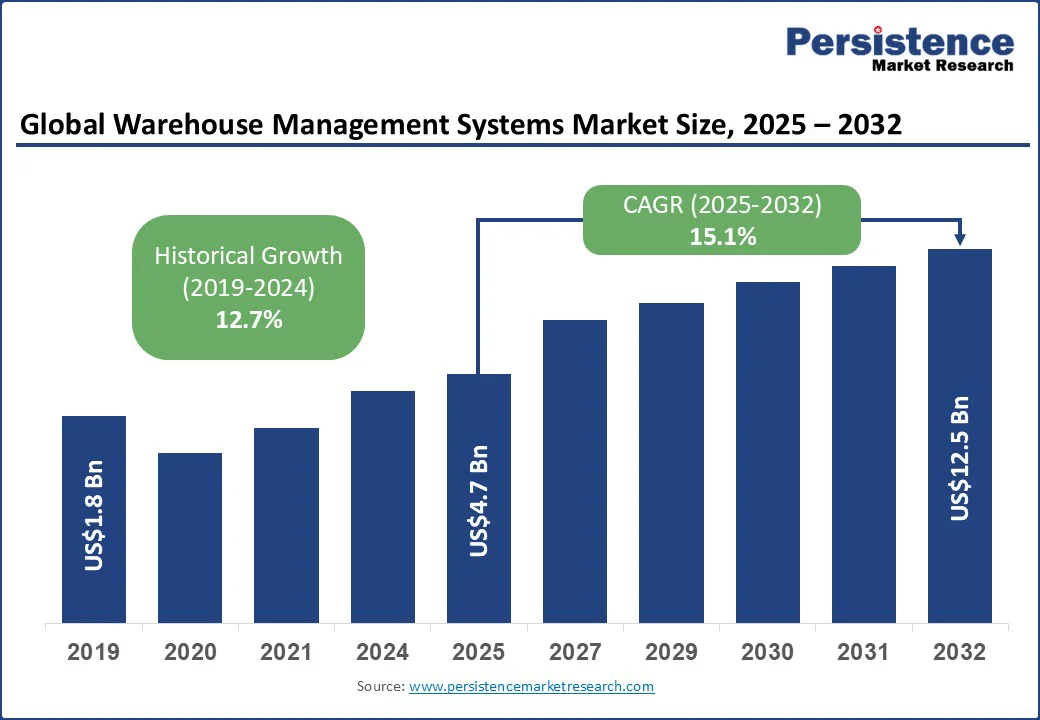
5. Global Warehouse Management Systems Market Demand (Value in US$ Mn) Analysis 2018-2022 and Forecast, 2023-2033

    5.1. Historical Market Value (US$ Mn) Analysis, 2018-2022

    5.2. Current and Future Market Value (US$ Mn) Projections, 2023-2033

        5.2.1. Y-o-Y Growth Trend Analysis

        5.2.2. Absolute $ Opportunity Analysis

6. Market Background

    6.1. Macro-Economic Factors

    6.2. Forecast Factors - Relevance & Impact

    6.3. Value Chain

    6.4. COVID-19 Crisis – Impact Assessment

        6.4.1. Current Statistics

        6.4.2. Short-Mid-Long Term Outlook

        6.4.3. Likely Rebound

    6.5. Market Dynamics

        6.5.1. Drivers

        6.5.2. Restraints

        6.5.3. Opportunities

7. Global Warehouse Management Systems Market Analysis 2018-2022 and Forecast 2023-2033, By Component

    7.1. Introduction / Key Findings

    7.2. Historical Market Size (US$ Mn) Analysis By Component, 2018 - 2022

    7.3. Current and Future Market Size (US$ Mn) Analysis and Forecast By Component, 2023 - 2033

        7.3.1. Hardware

            7.3.1.1. RFID Tags

            7.3.1.2. Scanners and Readers

            7.3.1.3. Mobile Computers

        7.3.2. Software

            7.3.2.1. Standalone WMS Software

            7.3.2.2. Integrated WMS Software

                7.3.2.2.1. Supply Chain Management

                7.3.2.2.2. ERP System (with WMS Features)

        7.3.3. Service

            7.3.3.1. Integration & Deployment

            7.3.3.2. Support & Maintenance

            7.3.3.3. Consulting

    7.4. Market Attractiveness Analysis By Component

8. Global Warehouse Management Systems Market Analysis 2018-2022 and Forecast 2023-2033, By Deployment

    8.1. Introduction / Key Findings

    8.2. Historical Market Size (US$ Mn) Analysis By Deployment, 2018 - 2022

    8.3. Current and Future Market Size (US$ Mn) Analysis and Forecast By Deployment, 2023 - 2033

        8.3.1. On-premise

        8.3.2. Cloud

    8.4. Market Attractiveness Analysis By Deployment

9. Global Warehouse Management Systems Market Analysis 2018-2022 and Forecast 2023-2033, By Application

    9.1. Introduction / Key Findings

    9.2. Historical Market Size (US$ Mn) Analysis By Application, 2018 - 2022

    9.3. Current and Future Market Size (US$ Mn) Analysis and Forecast By Application, 2023 - 2033

        9.3.1. Inventory Management

        9.3.2. Purchase & Order Management

        9.3.3. Supply Chain Management

        9.3.4. Asset Management

        9.3.5. Others

    9.4. Market Attractiveness Analysis By Application

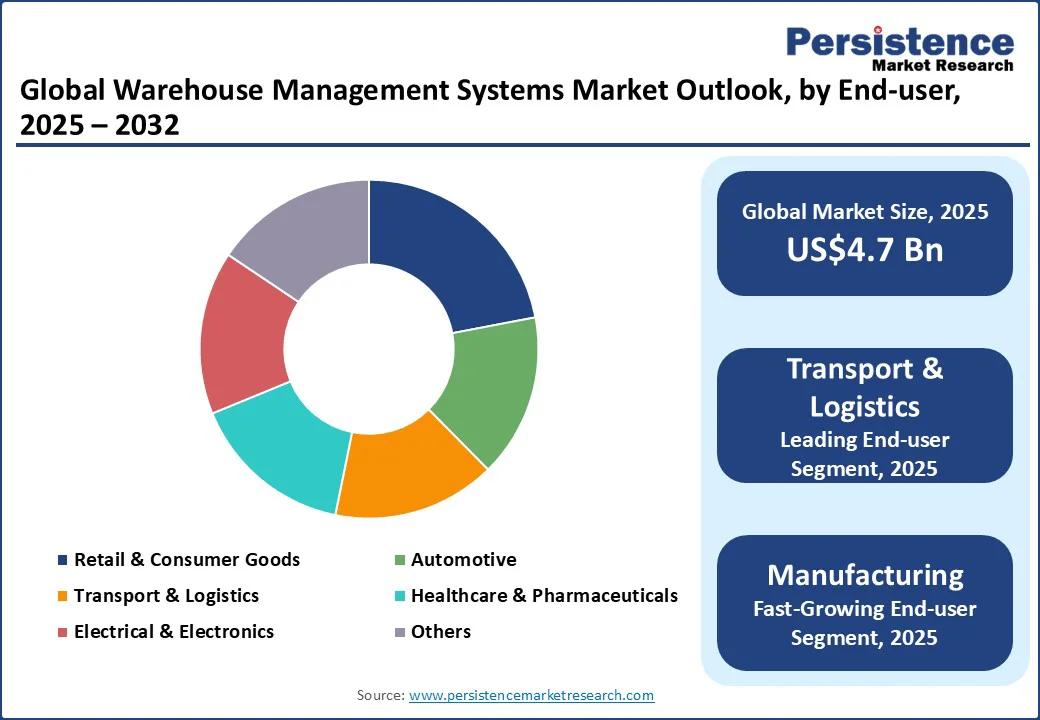
10. Global Warehouse Management Systems Market Analysis 2018-2022 and Forecast 2023-2033, By Industry

    10.1. Introduction / Key Findings

    10.2. Historical Market Size (US$ Mn) Analysis By Industry, 2018 - 2022

    10.3. Current and Future Market Size (US$ Mn) Analysis and Forecast By Industry, 2023 - 2033

        10.3.1. Retail & Consumer Goods

        10.3.2. Automotive

        10.3.3. Transport & Logistics

        10.3.4. Healthcare & Pharmaceuticals

        10.3.5. Electrical & Electronics

        10.3.6. Others

    10.4. Market Attractiveness Analysis By Industry

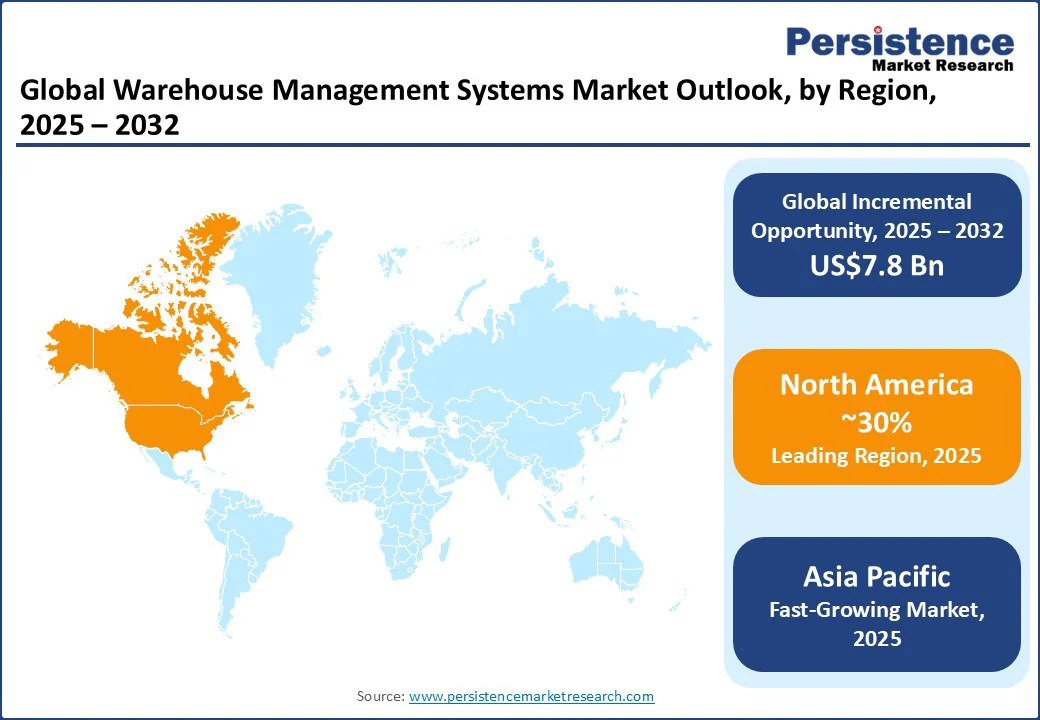
11. Global Warehouse Management Systems Market Analysis 2018-2022 and Forecast 2023-2033, By Region

    11.1. Introduction / Key Findings

    11.2. Historical Market Size (US$ Mn) Analysis By Region, 2018 - 2022

    11.3. Current and Future Market Size (US$ Mn) Analysis and Forecast By Region, 2023 - 2033

        11.3.1. North America

        11.3.2. Latin America

        11.3.3. Europe

        11.3.4. East Asia

        11.3.5. South Asia Pacific

        11.3.6. Middle East and Africa

    11.4. Market Attractiveness Analysis By Region

12. North America Warehouse Management Systems Market Analysis 2018-2022 and Forecast 2023-2033

    12.1. Introduction

    12.2. Historical Market Size (US$ Mn) Trend Analysis By Market Taxonomy, 2018 - 2022

    12.3. Current and Future Market Size (US$ Mn) Forecast By Market Taxonomy, 2023 - 2033

        12.3.1. By Component

        12.3.2. By Deployment

        12.3.3. By Application

        12.3.4. By Industry

        12.3.5. By Country

            12.3.5.1. U.S.

            12.3.5.2. Canada

    12.4. Market Attractiveness Analysis

        12.4.1. By Component

        12.4.2. By Deployment

        12.4.3. By Application

        12.4.4. By Industry

        12.4.5. By Country

    12.5. Market Trends

    12.6. Key Market Participants - Intensity Mapping

13. Latin America Warehouse Management Systems Market Analysis 2018-2022 and Forecast 2023-2033

    13.1. Introduction

    13.2. Historical Market Size (US$ Mn) Trend Analysis By Market Taxonomy, 2018 - 2022

    13.3. Current and Future Market Size (US$ Mn) Forecast By Market Taxonomy, 2023 - 2033

        13.3.1. By Component

        13.3.2. By Deployment

        13.3.3. By Application

        13.3.4. By Industry

        13.3.5. By Country

            13.3.5.1. Brazil

            13.3.5.2. Mexico

            13.3.5.3. Rest of Latin America

    13.4. Market Attractiveness Analysis

        13.4.1. By Component

        13.4.2. By Deployment

        13.4.3. By Application

        13.4.4. By Industry

        13.4.5. By Country

14. Europe Warehouse Management Systems Market Analysis 2018-2022 and Forecast 2023-2033

    14.1. Introduction

    14.2. Historical Market Size (US$ Mn) Trend Analysis By Market Taxonomy, 2018 - 2022

    14.3. Current and Future Market Size (US$ Mn) Forecast By Market Taxonomy, 2023 - 2033

        14.3.1. By Component

        14.3.2. By Deployment

        14.3.3. By Application

        14.3.4. By Industry

        14.3.5. By Country

            14.3.5.1. Germany

            14.3.5.2. Italy

            14.3.5.3. France

            14.3.5.4. U.K.

            14.3.5.5. Spain

            14.3.5.6. BENELUX

            14.3.5.7. Russia

            14.3.5.8. Rest of Europe

    14.4. Market Attractiveness Analysis

        14.4.1. By Component

        14.4.2. By Deployment

        14.4.3. By Application

        14.4.4. By Industry

        14.4.5. By Country

15. South Asia & Pacific Warehouse Management Systems Market Analysis 2018-2022 and Forecast 2023-2033

    15.1. Introduction

    15.2. Historical Market Size (US$ Mn) Trend Analysis By Market Taxonomy, 2018 - 2022

    15.3. Current and Future Market Size (US$ Mn) Forecast By Market Taxonomy, 2023 - 2033

        15.3.1. By Component

        15.3.2. By Deployment

        15.3.3. By Application

        15.3.4. By Industry

        15.3.5. By Country

            15.3.5.1. India

            15.3.5.2. Indonesia

            15.3.5.3. Malaysia

            15.3.5.4. Singapore

            15.3.5.5. Australia & New Zealand

            15.3.5.6. Rest of South Asia and Pacific

    15.4. Market Attractiveness Analysis

        15.4.1. By Component

        15.4.2. By Deployment

        15.4.3. By Application

        15.4.4. By Industry

        15.4.5. By Country

16. East Asia Warehouse Management Systems Market Analysis 2018-2022 and Forecast 2023-2033

    16.1. Introduction

    16.2. Historical Market Size (US$ Mn) Trend Analysis By Market Taxonomy, 2018 - 2022

    16.3. Current and Future Market Size (US$ Mn) Forecast By Market Taxonomy, 2023 - 2033

        16.3.1. By Component

        16.3.2. By Deployment

        16.3.3. By Application

        16.3.4. By Industry

        16.3.5. By Country

            16.3.5.1. China

            16.3.5.2. Japan

            16.3.5.3. South Korea

    16.4. Market Attractiveness Analysis

        16.4.1. By Component

        16.4.2. By Deployment

        16.4.3. By Application

        16.4.4. By Industry

        16.4.5. By Country

17. Middle East and Africa Warehouse Management Systems Market Analysis 2018-2022 and Forecast 2023-2033

    17.1. Introduction

    17.2. Historical Market Size (US$ Mn) Trend Analysis By Market Taxonomy, 2018 - 2022

    17.3. Current and Future Market Size (US$ Mn) Forecast By Market Taxonomy, 2023 - 2033

        17.3.1. By Component

        17.3.2. By Deployment

        17.3.3. By Application

        17.3.4. By Industry

        17.3.5. By Country

            17.3.5.1. GCC Countries

            17.3.5.2. Turkey

            17.3.5.3. South Africa

            17.3.5.4. Rest of Middle East and Africa

    17.4. Market Attractiveness Analysis

        17.4.1. By Component

        17.4.2. By Deployment

        17.4.3. By Application

        17.4.4. By Industry

        17.4.5. By Country

18. Key Countries Analysis - Warehouse Management Systems Market

    18.1. U.S. Warehouse Management Systems Market Analysis

        18.1.1. By Component

        18.1.2. By Deployment

        18.1.3. By Application

        18.1.4. By Industry

    18.2. Canada Warehouse Management Systems Market Analysis

        18.2.1. By Component

        18.2.2. By Deployment

        18.2.3. By Application

        18.2.4. By Industry

    18.3. Mexico Warehouse Management Systems Market Analysis

        18.3.1. By Component

        18.3.2. By Deployment

        18.3.3. By Application

        18.3.4. By Industry

    18.4. Brazil Warehouse Management Systems Market Analysis

        18.4.1. By Component

        18.4.2. By Deployment

        18.4.3. By Application

        18.4.4. By Industry

    18.5. Germany Warehouse Management Systems Market Analysis

        18.5.1. By Component

        18.5.2. By Deployment

        18.5.3. By Application

        18.5.4. By Industry

    18.6. Italy Warehouse Management Systems Market Analysis

        18.6.1. By Component

        18.6.2. By Deployment

        18.6.3. By Application

        18.6.4. By Industry

    18.7. France Warehouse Management Systems Market Analysis

        18.7.1. By Component

        18.7.2. By Deployment

        18.7.3. By Application

        18.7.4. By Industry

    18.8. U.K. Warehouse Management Systems Market Analysis

        18.8.1. By Component

        18.8.2. By Deployment

        18.8.3. By Application

        18.8.4. By Industry

    18.9. Spain Warehouse Management Systems Market Analysis

        18.9.1. By Component

        18.9.2. By Deployment

        18.9.3. By Application

        18.9.4. By Industry

    18.10. BENELUX Warehouse Management Systems Market Analysis

        18.10.1. By Component

        18.10.2. By Deployment

        18.10.3. By Application

        18.10.4. By Industry

    18.11. Russia Warehouse Management Systems Market Analysis

        18.11.1. By Component

        18.11.2. By Deployment

        18.11.3. By Application

        18.11.4. By Industry

    18.12. China Warehouse Management Systems Market Analysis

        18.12.1. By Component

        18.12.2. By Deployment

        18.12.3. By Application

        18.12.4. By Industry

    18.13. Japan Warehouse Management Systems Market Analysis

        18.13.1. By Component

        18.13.2. By Deployment

        18.13.3. By Application

        18.13.4. By Industry

    18.14. South Korea Warehouse Management Systems Market Analysis

        18.14.1. By Component

        18.14.2. By Deployment

        18.14.3. By Application

        18.14.4. By Industry

    18.15. India Warehouse Management Systems Market Analysis

        18.15.1. By Component

        18.15.2. By Deployment

        18.15.3. By Application

        18.15.4. By Industry

    18.16. Malaysia Warehouse Management Systems Market Analysis

        18.16.1. By Component

        18.16.2. By Deployment

        18.16.3. By Application

        18.16.4. By Industry

    18.17. Indonesia Warehouse Management Systems Market Analysis

        18.17.1. By Component

        18.17.2. By Deployment

        18.17.3. By Application

        18.17.4. By Industry

    18.18. Singapore Warehouse Management Systems Market Analysis

        18.18.1. By Component

        18.18.2. By Deployment

        18.18.3. By Application

        18.18.4. By Industry

    18.19. Australia and New Zealand Warehouse Management Systems Market Analysis

        18.19.1. By Component

        18.19.2. By Deployment

        18.19.3. By Application

        18.19.4. By Industry

    18.20. GCC Countries Warehouse Management Systems Market Analysis

        18.20.1. By Component

        18.20.2. By Deployment

        18.20.3. By Application

        18.20.4. By Industry

    18.21. Turkey Warehouse Management Systems Market Analysis

        18.21.1. By Component

        18.21.2. By Deployment

        18.21.3. By Application

        18.21.4. By Industry

    18.22. South Africa Warehouse Management Systems Market Analysis

        18.22.1. By Component

        18.22.2. By Deployment

        18.22.3. By Application

        18.22.4. By Industry

19. Market Structure Analysis

    19.1. Market Analysis by Tier of Companies

    19.2. Market Share Analysis of Top Players

20. Competition Analysis

    20.1. Competition Dashboard

    20.2. Competition Deep Dive

        20.2.1. Zebra Technologies

            20.2.1.1. Business Overview

            20.2.1.2. Solution Portfolio

            20.2.1.3. Profitability by Market Segments (Business Segments/Region)

            20.2.1.4. Key Strategy & Developments

        20.2.2. Honeywell International Inc.

            20.2.2.1. Business Overview

            20.2.2.2. Solution Portfolio

            20.2.2.3. Profitability by Market Segments (Business Segments/Region)

            20.2.2.4. Key Strategy & Developments

        20.2.3. Clearpath Robotics Inc.

            20.2.3.1. Business Overview

            20.2.3.2. Solution Portfolio

            20.2.3.3. Profitability by Market Segments (Business Segments/Region)

            20.2.3.4. Key Strategy & Developments

        20.2.4. The Raymond Corporation

            20.2.4.1. Business Overview

            20.2.4.2. Solution Portfolio

            20.2.4.3. Profitability by Market Segments (Business Segments/Region)

            20.2.4.4. Key Strategy & Developments

        20.2.5. Technology Solutions (UK) Ltd.

            20.2.5.1. Business Overview

            20.2.5.2. Solution Portfolio

            20.2.5.3. Profitability by Market Segments (Business Segments/Region)

            20.2.5.4. Key Strategy & Developments

        20.2.6. SAP

            20.2.6.1. Business Overview

            20.2.6.2. Solution Portfolio

            20.2.6.3. Profitability by Market Segments (Business Segments/Region)

            20.2.6.4. Key Strategy & Developments

        20.2.7. Zoho Corp.

            20.2.7.1. Business Overview

            20.2.7.2. Solution Portfolio

            20.2.7.3. Profitability by Market Segments (Business Segments/Region)

            20.2.7.4. Key Strategy & Developments

        20.2.8. Oracle Corporation

            20.2.8.1. Business Overview

            20.2.8.2. Solution Portfolio

            20.2.8.3. Profitability by Market Segments (Business Segments/Region)

            20.2.8.4. Key Strategy & Developments

        20.2.9. Infor

            20.2.9.1. Business Overview

            20.2.9.2. Solution Portfolio

            20.2.9.3. Profitability by Market Segments (Business Segments/Region)

            20.2.9.4. Key Strategy & Developments

        20.2.10. PTC

            20.2.10.1. Business Overview

            20.2.10.2. Solution Portfolio

            20.2.10.3. Profitability by Market Segments (Business Segments/Region)

            20.2.10.4. Key Strategy & Developments

21. Assumptions and Acronyms Used

22. Research Methodology

Sample Report

FREE Report Sample is Available

In-depth report coverage is now just a few seconds away

Download PDF Get FREE Report Sample

- List Of Table -

Table 01: Global Warehouse Management Systems Market Value (US$ Mn) Analysis (2018 - 2022) By Component

Table 02: Global Warehouse Management Systems Market Value (US$ Mn) Forecast (2023- 2033) By Component

Table 03: Global Warehouse Management Systems Market Volume ('000 Units) Forecast (2023- 2033) By Component

Table 04: Global Warehouse Management Systems Market Value (US$ Mn) Analysis (2018 - 2022) By Deployment

Table 05: Global Warehouse Management Systems Market Value (US$ Mn) Forecast (2023- 2033) By Deployment

Table 06: Global Warehouse Management Systems Market Value (US$ Mn) Analysis (2018 - 2022) By Application

Table 07: Global Warehouse Management Systems Market Value (US$ Mn) Forecast (2023- 2033) By Application

Table 08: Global Warehouse Management Systems Market Value (US$ Mn) Analysis (2018 - 2022) By Industry

Table 09: Global Warehouse Management Systems Market Value (US$ Mn) Forecast (2023- 2033) By Industry

Table 10: Global Warehouse Management Systems Market Value (US$ Mn) Analysis (2018 - 2022) By Region

Table 11: Global Warehouse Management Systems Market Value (US$ Mn) Forecast (2023- 2033) By Region

Table 12: North America Warehouse Management Systems Market Value (US$ Mn) Analysis (2018 - 2022) By Component

Table 13: North America Warehouse Management Systems Market Value (US$ Mn) Forecast (2023- 2033) By Component

Table 14: North America Warehouse Management Systems Market Value (US$ Mn) Analysis (2018 - 2022) By Deployment

Table 15: North America Warehouse Management Systems Market Value (US$ Mn) Forecast (2023- 2033) By Deployment

Table 16: North America Warehouse Management Systems Market Value (US$ Mn) Analysis (2018 - 2022) By Application

Table 17: North America Warehouse Management Systems Market Value (US$ Mn) Forecast (2023- 2033) By Application

Table 18: North America Warehouse Management Systems Market Value (US$ Mn) Analysis (2018 - 2022) By Industry

Table 19: North America Warehouse Management Systems Market Value (US$ Mn) Forecast (2023- 2033) By Industry

Table 20: North America Warehouse Management Systems Market Value (US$ Mn) Analysis (2018 - 2022) by Country

Table 21: North America Warehouse Management Systems Market Value (US$ Mn) Forecast (2023- 2033) by Country

Table 22: Latin America Warehouse Management Systems Market Value (US$ Mn) Analysis (2018 - 2022) By Component

Table 23: Latin America Warehouse Management Systems Market Value (US$ Mn) Forecast (2023- 2033) By Component

Table 24: Latin America Warehouse Management Systems Market Value (US$ Mn) Analysis (2018 - 2022) By Deployment

Table 25: Latin America Warehouse Management Systems Market Value (US$ Mn) Forecast (2023- 2033) By Deployment

Table 26: Latin America Warehouse Management Systems Market Value (US$ Mn) Analysis (2018 - 2022) By Application

Table 27: Latin America Warehouse Management Systems Market Value (US$ Mn) Forecast (2023- 2033) By Application

Table 28: Latin America Warehouse Management Systems Market Value (US$ Mn) Analysis (2018 - 2022) By Industry

Table 29: Latin America Warehouse Management Systems Market Value (US$ Mn) Forecast (2023- 2033) By Industry

Table 30: Latin America Warehouse Management Systems Market Value (US$ Mn) Analysis (2018 - 2022) by Country

Table 31: Latin America Warehouse Management Systems Market Value (US$ Mn) Forecast (2023- 2033) by Country

Table 32: Europe Warehouse Management Systems Market Value (US$ Mn) Analysis (2018 - 2022) By Component

Table 33: Europe Warehouse Management Systems Market Value (US$ Mn) Forecast (2023- 2033) By Component

Table 34: Europe Warehouse Management Systems Market Value (US$ Mn) Analysis (2018 - 2022) By Deployment

Table 35: Europe Warehouse Management Systems Market Value (US$ Mn) Forecast (2023- 2033) By Deployment

Table 36: Europe Warehouse Management Systems Market Value (US$ Mn) Analysis (2018 - 2022) By Application

Table 37: Europe Warehouse Management Systems Market Value (US$ Mn) Forecast (2023- 2033) By Application

Table 38: Europe Warehouse Management Systems Market Value (US$ Mn) Analysis (2018 - 2022) By Industry

Table 39: Europe Warehouse Management Systems Market Value (US$ Mn) Forecast (2023- 2033) By Industry

Table 40: Europe Warehouse Management Systems Market Value (US$ Mn) Analysis (2018 - 2022) by Country

Table 41: Europe Warehouse Management Systems Market Value (US$ Mn) Forecast (2023- 2033) by Country

Table 42: South Asia & Pacific Warehouse Management Systems Market Value (US$ Mn) Analysis (2018 - 2022) By Component

Table 43: South Asia & Pacific Warehouse Management Systems Market Value (US$ Mn) Forecast (2023- 2033) By Component

Table 44: South Asia & Pacific Warehouse Management Systems Market Value (US$ Mn) Analysis (2018 - 2022) By Deployment

Table 45: South Asia & Pacific Warehouse Management Systems Market Value (US$ Mn) Forecast (2023- 2033) By Deployment

Table 46: South Asia & Pacific Warehouse Management Systems Market Value (US$ Mn) Analysis (2018 - 2022) By Application

Table 47: South Asia & Pacific Warehouse Management Systems Market Value (US$ Mn) Forecast (2023- 2033) By Application

Table 48: South Asia & Pacific Warehouse Management Systems Market Value (US$ Mn) Analysis (2018 - 2022) By Industry

Table 49: South Asia & Pacific Warehouse Management Systems Market Value (US$ Mn) Forecast (2023- 2033) By Industry

Table 50: South Asia & Pacific Warehouse Management Systems Market Value (US$ Mn) Analysis (2018 - 2022) by Country

Table 51: South Asia & Pacific Warehouse Management Systems Market Value (US$ Mn) Forecast (2023- 2033) by Country

Table 52: East Asia Warehouse Management Systems Market Value (US$ Mn) Analysis (2018 - 2022) By Component

Table 53: East Asia Warehouse Management Systems Market Value (US$ Mn) Forecast (2023- 2033) By Component

Table 54: East Asia Warehouse Management Systems Market Value (US$ Mn) Analysis (2018 - 2022) By Deployment

Table 55: East Asia Warehouse Management Systems Market Value (US$ Mn) Forecast (2023- 2033) By Deployment

Table 56: East Asia Warehouse Management Systems Market Value (US$ Mn) Analysis (2018 - 2022) By Application

Table 57: East Asia Warehouse Management Systems Market Value (US$ Mn) Forecast (2023- 2033) By Application

Table 58: East Asia Warehouse Management Systems Market Value (US$ Mn) Analysis (2018 - 2022) By Industry

Table 59: East Asia Warehouse Management Systems Market Value (US$ Mn) Forecast (2023- 2033) By Industry

Table 60: East Asia Warehouse Management Systems Market Value (US$ Mn) Analysis (2018 - 2022) by Country

Table 61: East Asia Warehouse Management Systems Market Value (US$ Mn) Forecast (2023- 2033) by Country

Table 62: Middle East and Africa Warehouse Management Systems Market Value (US$ Mn) Analysis (2018 - 2022) By Component

Table 63: Middle East and Africa Warehouse Management Systems Market Value (US$ Mn) Forecast (2023- 2033) By Component

Table 64: Middle East and Africa Warehouse Management Systems Market Value (US$ Mn) Analysis (2018 - 2022) By Deployment

Table 65: Middle East and Africa Warehouse Management Systems Market Value (US$ Mn) Forecast (2023- 2033) By Deployment

Table 66: Middle East and Africa Warehouse Management Systems Market Value (US$ Mn) Analysis (2018 - 2022) By Application

Table 67: Middle East and Africa Warehouse Management Systems Market Value (US$ Mn) Forecast (2023- 2033) By Application

Table 68: Middle East and Africa Warehouse Management Systems Market Value (US$ Mn) Analysis (2018 - 2022) By Industry

Table 69: Middle East and Africa Warehouse Management Systems Market Value (US$ Mn) Forecast (2023- 2033) By Industry

Table 70: Middle East and Africa Warehouse Management Systems Market Value (US$ Mn) Analysis (2018 - 2022) by Country

Table 71: Middle East and Africa Warehouse Management Systems Market Value (US$ Mn) Forecast (2023- 2033) by Country

Custom Report Cover

Make This Report Your Own

Take Advantage of Intelligence Tailored to your Business Objective

> Get a Customized Version

- List Of Chart -

Figure 01: Global Warehouse Management Systems Market Size (US$ Mn) and Y-o-Y Growth Rate from 2023-2033

Figure 02: Global Warehouse Management Systems Market Size and Y-o-Y Growth Rate from 2023-2033

Figure 03: Global Warehouse Management Systems Market Value (US$ Mn), 2018-2022

Figure 04: Global Warehouse Management Systems Market Value (US$ Mn), 2023-2033

Figure 05: Global Warehouse Management Systems Market Value Share Analysis (2023- 2033) By Component

Figure 06: Global Warehouse Management Systems Market Value Y-o-Y Growth Trend Analysis (2018 - 2033) By Component

Figure 07: Global Warehouse Management Systems Market Attractiveness By Component

Figure 08: Global Warehouse Management Systems Market Value Share Analysis (2023- 2033) By Deployment

Figure 09: Global Warehouse Management Systems Market Value Y-o-Y Growth Trend Analysis (2018 - 2033) By Deployment

Figure 10: Global Warehouse Management Systems Market Attractiveness By Deployment

Figure 11: Global Warehouse Management Systems Market Value Share Analysis (2023- 2033) By Application

Figure 12: Global Warehouse Management Systems Market Value Y-o-Y Growth Trend Analysis (2018 - 2033) By Application

Figure 13: Global Warehouse Management Systems Market Attractiveness By Application

Figure 14: Global Warehouse Management Systems Market Value Share Analysis (2023- 2033) By Industry

Figure 15: Global Warehouse Management Systems Market Value Y-o-Y Growth Trend Analysis (2018 - 2033) By Industry

Figure 16: Global Warehouse Management Systems Market Attractiveness By Industry

Figure 17: Global Warehouse Management Systems Market Value Share Analysis (2023- 2033) By Region

Figure 18: Global Warehouse Management Systems Market Value Y-o-Y Growth Trend Analysis (2018 - 2033) By Region

Figure 19: Global Warehouse Management Systems Market Attractiveness By Region

Figure 20: North America Warehouse Management Systems Market Absolute $ Opportunity (US$ Mn), 2018 - 2033

Figure 21: Latin America Warehouse Management Systems Market Absolute $ Opportunity (US$ Mn), 2018 - 2033

Figure 22: Europe Warehouse Management Systems Market Absolute $ Opportunity (US$ Mn), 2018 - 2033

Figure 23: East Asia Warehouse Management Systems Market Absolute $ Opportunity (US$ Mn), 2018- 2033

Figure 24: South Asia & Pacific Warehouse Management Systems Market Absolute $ Opportunity (US$ Mn), 2018 - 2033

Figure 25: Middle East & Africa Warehouse Management Systems Market Absolute $ Opportunity (US$ Mn), 2018 - 2033

Figure 26: North America Warehouse Management Systems Market Value (US$ Mn), 2018-2022

Figure 27: North America Warehouse Management Systems Market Value (US$ Mn), 2023-2033

Figure 28: North America Warehouse Management Systems Market Value Share Analysis (2023- 2033) By Component

Figure 29: North America Warehouse Management Systems Market Value Y-o-Y Growth Trend Analysis (2018 - 2033) By Component

Figure 30: North America Warehouse Management Systems Market Attractiveness By Component

Figure 31: North America Warehouse Management Systems Market Value Share Analysis (2023- 2033) By Deployment

Figure 32: North America Warehouse Management Systems Market Value Y-o-Y Growth Trend Analysis (2018 - 2033) By Deployment

Figure 33: North America Warehouse Management Systems Market Attractiveness By Deployment

Figure 34: North America Warehouse Management Systems Market Value Share Analysis (2023- 2033) By Application

Figure 35: North America Warehouse Management Systems Market Value Y-o-Y Growth Trend Analysis (2018 - 2033) By Application

Figure 36: North America Warehouse Management Systems Market Attractiveness By Application

Figure 37: North America Warehouse Management Systems Market Value Share Analysis (2023- 2033) By Industry

Figure 38: North America Warehouse Management Systems Market Value Y-o-Y Growth Trend Analysis (2018 - 2033) By Industry

Figure 39: North America Warehouse Management Systems Market Attractiveness By Industry

Figure 40: North America Warehouse Management Systems Market Value Share Analysis (2023- 2033) by Country

Figure 41: North America Warehouse Management Systems Market Value Y-o-Y Growth Trend Analysis (2018 - 2033) by Country

Figure 42: North America Warehouse Management Systems Market Attractiveness by Country

Figure 43: U.S. Warehouse Management Systems Market Absolute $ Opportunity (US$ Mn), 2018 - 2033

Figure 44: Canada Warehouse Management Systems Market Absolute $ Opportunity (US$ Mn), 2018 - 2033

Figure 45: Latin America Warehouse Management Systems Market Value (US$ Mn), 2018-2022

Figure 46: Latin America Warehouse Management Systems Market Value (US$ Mn), 2023-2033

Figure 47: Latin America Warehouse Management Systems Market Value Share Analysis (2023- 2033) By Component

Figure 48: Latin America Warehouse Management Systems Market Value Y-o-Y Growth Trend Analysis (2018 - 2033) By Component

Figure 49: Latin America Warehouse Management Systems Market Attractiveness By Component

Figure 50: Latin America Warehouse Management Systems Market Value Share Analysis (2023- 2033) By Deployment

Figure 51: Latin America Warehouse Management Systems Market Value Y-o-Y Growth Trend Analysis (2018 - 2033) By Deployment

Figure 52: Latin America Warehouse Management Systems Market Attractiveness By Deployment

Figure 53: Latin America Warehouse Management Systems Market Value Share Analysis (2023- 2033) By Application

Figure 54: Latin America Warehouse Management Systems Market Value Y-o-Y Growth Trend Analysis (2018 - 2033) By Application

Figure 55: Latin America Warehouse Management Systems Market Attractiveness By Application

Figure 56: Latin America Warehouse Management Systems Market Value Share Analysis (2023- 2033) By Industry

Figure 57: Latin America Warehouse Management Systems Market Value Y-o-Y Growth Trend Analysis (2018 - 2033) By Industry

Figure 58: Latin America Warehouse Management Systems Market Attractiveness By Industry

Figure 59: Latin America Warehouse Management Systems Market Value Share Analysis (2023- 2033) by Country

Figure 60: Latin America Warehouse Management Systems Market Value Y-o-Y Growth Trend Analysis (2018 - 2033) by Country

Figure 61: Latin America Warehouse Management Systems Market Attractiveness by Country

Figure 62: Brazil Warehouse Management Systems Market Absolute $ Opportunity (US$ Mn), 2018 - 2033

Figure 63: Mexico Warehouse Management Systems Market Absolute $ Opportunity (US$ Mn), 2018 - 2033

Figure 64: Rest of Latin America Warehouse Management Systems Market Absolute $ Opportunity (US$ Mn), 2018 - 2033

Figure 65: Europe Warehouse Management Systems Market Value (US$ Mn), 2018-2022

Figure 66: Europe Warehouse Management Systems Market Value (US$ Mn), 2023-2033

Figure 67: Europe Warehouse Management Systems Market Value Share Analysis (2023- 2033) By Component

Figure 68: Europe Warehouse Management Systems Market Value Y-o-Y Growth Trend Analysis (2018 - 2033) By Component

Figure 69: Europe Warehouse Management Systems Market Attractiveness By Component

Figure 70: Europe Warehouse Management Systems Market Value Share Analysis (2023- 2033) By Deployment

Figure 71: Europe Warehouse Management Systems Market Value Y-o-Y Growth Trend Analysis (2018 - 2033) By Deployment

Figure 72: Europe Warehouse Management Systems Market Attractiveness By Deployment

Figure 73: Europe Warehouse Management Systems Market Value Share Analysis (2023- 2033) By Application

Figure 74: Europe Warehouse Management Systems Market Value Y-o-Y Growth Trend Analysis (2018 - 2033) By Application

Figure 75: Europe Warehouse Management Systems Market Attractiveness By Application

Figure 76: Europe Warehouse Management Systems Market Value Share Analysis (2023- 2033) By Industry

Figure 77: Europe Warehouse Management Systems Market Value Y-o-Y Growth Trend Analysis (2018 - 2033) By Industry

Figure 78: Europe Warehouse Management Systems Market Attractiveness By Industry

Figure 79: Europe Warehouse Management Systems Market Value Share Analysis (2023- 2033) by Country

Figure 80: Europe Warehouse Management Systems Market Value Y-o-Y Growth Trend Analysis (2018 - 2033) by Country

Figure 81: Europe Warehouse Management Systems Market Attractiveness by Country

Figure 82: Germany Warehouse Management Systems Market Absolute $ Opportunity (US$ Mn), 2018 - 2033

Figure 83: Italy Warehouse Management Systems Market Absolute $ Opportunity (US$ Mn), 2018 - 2033

Figure 84: France Warehouse Management Systems Market Absolute $ Opportunity (US$ Mn), 2018 - 2033

Figure 85: U.K. Warehouse Management Systems Market Absolute $ Opportunity (US$ Mn), 2018 - 2033

Figure 86: Spain Warehouse Management Systems Market Absolute $ Opportunity (US$ Mn), 2018 - 2033

Figure 87: BENELUX Warehouse Management Systems Market Absolute $ Opportunity (US$ Mn), 2018 - 2033

Figure 88: Russia Warehouse Management Systems Market Absolute $ Opportunity (US$ Mn), 2018 - 2033

Figure 89: Rest of Europe Warehouse Management Systems Market Absolute $ Opportunity (US$ Mn), 2018 - 2033

Figure 90: South Asia & Pacific Warehouse Management Systems Market Value (US$ Mn), 2018-2022

Figure 91: South Asia & Pacific Warehouse Management Systems Market Value (US$ Mn), 2023-2033

Figure 92: South Asia & Pacific Warehouse Management Systems Market Value Share Analysis (2023- 2033) By Component

Figure 93: South Asia & Pacific Warehouse Management Systems Market Value Y-o-Y Growth Trend Analysis (2018 - 2033) By Component

Figure 94: South Asia & Pacific Warehouse Management Systems Market Attractiveness By Component

Figure 95: South Asia & Pacific Warehouse Management Systems Market Value Share Analysis (2023- 2033) By Deployment

Figure 96: South Asia & Pacific Warehouse Management Systems Market Value Y-o-Y Growth Trend Analysis (2018 - 2033) By Deployment

Figure 97: South Asia & Pacific Warehouse Management Systems Market Attractiveness By Deployment

Figure 98: South Asia & Pacific Warehouse Management Systems Market Value Share Analysis (2023- 2033) By Application

Figure 99: South Asia & Pacific Warehouse Management Systems Market Value Y-o-Y Growth Trend Analysis (2018 - 2033) By Application

Figure 100: South Asia & Pacific Warehouse Management Systems Market Attractiveness By Application

Figure 101: South Asia & Pacific Warehouse Management Systems Market Value Share Analysis (2023- 2033) By Industry

Figure 102: South Asia & Pacific Warehouse Management Systems Market Value Y-o-Y Growth Trend Analysis (2018 - 2033) By Industry

Figure 103: South Asia & Pacific Warehouse Management Systems Market Attractiveness By Industry

Figure 104: South Asia & Pacific Warehouse Management Systems Market Value Share Analysis (2023- 2033) by Country

Figure 105: South Asia & Pacific Warehouse Management Systems Market Value Y-o-Y Growth Trend Analysis (2018 - 2033) by Country

Figure 106: South Asia & Pacific Warehouse Management Systems Market Attractiveness by Country

Figure 107: India Warehouse Management Systems Market Absolute $ Opportunity (US$ Mn), 2018 - 2033

Figure 108: Indonesia Warehouse Management Systems Market Absolute $ Opportunity (US$ Mn), 2018 - 2033

Figure 109: Malaysia Warehouse Management Systems Market Absolute $ Opportunity (US$ Mn), 2018 - 2033

Figure 110: Singapore Warehouse Management Systems Market Absolute $ Opportunity (US$ Mn), 2018 - 2033

Figure 111: Australia& New Zealand Warehouse Management Systems Market Absolute $ Opportunity (US$ Mn), 2018 - 2033

Figure 112: Rest of South Asia & Pacific Warehouse Management Systems Market Absolute $ Opportunity (US$ Mn), 2018 - 2033

Figure 113: East Asia Warehouse Management Systems Market Value (US$ Mn), 2018-2022

Figure 114: East Asia Warehouse Management Systems Market Value (US$ Mn), 2023-2033

Figure 115: East Asia Warehouse Management Systems Market Value Share Analysis (2023- 2033) By Component

Figure 116: East Asia Warehouse Management Systems Market Value Y-o-Y Growth Trend Analysis (2018 - 2033) By Component

Figure 117: East Asia Warehouse Management Systems Market Attractiveness By Component

Figure 118: East Asia Warehouse Management Systems Market Value Share Analysis (2023- 2033) By Deployment

Figure 119: East Asia Warehouse Management Systems Market Value Y-o-Y Growth Trend Analysis (2018 - 2033) By Deployment

Figure 120: East Asia Warehouse Management Systems Market Attractiveness By Deployment

Figure 121: East Asia Warehouse Management Systems Market Value Share Analysis (2023- 2033) By Application

Figure 122: East Asia Warehouse Management Systems Market Value Y-o-Y Growth Trend Analysis (2018 - 2033) By Application

Figure 123: East Asia Warehouse Management Systems Market Attractiveness By Application

Figure 124: East Asia Warehouse Management Systems Market Value Share Analysis (2023- 2033) By Industry

Figure 125: East Asia Warehouse Management Systems Market Value Y-o-Y Growth Trend Analysis (2018 - 2033) By Industry

Figure 126: East Asia Warehouse Management Systems Market Attractiveness By Industry

Figure 127: East Asia Warehouse Management Systems Market Value Share Analysis (2023- 2033) by Country

Figure 128: East Asia Warehouse Management Systems Market Value Y-o-Y Growth Trend Analysis (2018 - 2033) by Country

Figure 129: East Asia Warehouse Management Systems Market Attractiveness by Country

Figure 130: China Warehouse Management Systems Market Absolute $ Opportunity (US$ Mn), 2018 - 2033

Figure 131: Japan Warehouse Management Systems Market Absolute $ Opportunity (US$ Mn), 2018 - 2033

Figure 132: South Korea Warehouse Management Systems Market Absolute $ Opportunity (US$ Mn), 2018 - 2033

Figure 133: Middle East and Africa Warehouse Management Systems Market Value (US$ Mn), 2018-2022

Figure 134: Middle East and Africa Warehouse Management Systems Market Value (US$ Mn), 2023-2033

Figure 135: Middle East and Africa Warehouse Management Systems Market Value Share Analysis (2023- 2033) By Component

Figure 136: Middle East and Africa Warehouse Management Systems Market Value Y-o-Y Growth Trend Analysis (2018 - 2033) By Component

Figure 137: Middle East and Africa Warehouse Management Systems Market Attractiveness By Component

Figure 138: Middle East and Africa Warehouse Management Systems Market Value Share Analysis (2023- 2033) By Deployment

Figure 139: Middle East and Africa Warehouse Management Systems Market Value Y-o-Y Growth Trend Analysis (2018 - 2033) By Deployment

Figure 140: Middle East and Africa Warehouse Management Systems Market Attractiveness By Deployment

Figure 141: Middle East and Africa Warehouse Management Systems Market Value Share Analysis (2023- 2033) By Application

Figure 142: Middle East and Africa Warehouse Management Systems Market Value Y-o-Y Growth Trend Analysis (2018 - 2033) By Application

Figure 143: Middle East and Africa Warehouse Management Systems Market Attractiveness By Application

Figure 144: Middle East and Africa Warehouse Management Systems Market Value Share Analysis (2023- 2033) By Industry

Figure 145: Middle East and Africa Warehouse Management Systems Market Value Y-o-Y Growth Trend Analysis (2018 - 2033) By Industry

Figure 146: Middle East and Africa Warehouse Management Systems Market Attractiveness By Industry

Figure 147: Middle East and Africa Warehouse Management Systems Market Value Share Analysis (2023- 2033) by Country

Figure 148: Middle East and Africa Warehouse Management Systems Market Value Y-o-Y Growth Trend Analysis (2018 - 2033) by Country

Figure 149: Middle East and Africa Warehouse Management Systems Market Attractiveness by Country

Figure 150: GCC Countries Warehouse Management Systems Market Absolute $ Opportunity (US$ Mn), 2018 - 2033

Figure 151: Turkey Warehouse Management Systems Market Absolute $ Opportunity (US$ Mn), 2018 - 2033

Figure 152: South Africa Warehouse Management Systems Market Absolute $ Opportunity (US$ Mn), 2018 - 2033

Figure 153: Rest of Middle East and Africa Warehouse Management Systems Market Absolute $ Opportunity (US$ Mn), 2018 - 2033

This site uses cookies, including third-party cookies, that help us to provide and improve our services. Privacy Policy
Google translate