

- Executive Summary
- U.S. Kitchen Sinks Market Snapshot, 2025 and 2032
- Market Opportunity Assessment, 2025 - 2032, US$ Mn
- Key Market Trends
- Future Market Projections
- Premium Market Insights
- Industry Developments and Key Market Events
- PMR Analysis and Recommendations
- Market Overview
- Market Scope and Definition
- Market Dynamics
- Drivers
- Restraints
- Opportunity
- Challenges
- Key Trends
- Product Lifecycle Analysis
- Kitchen sinks Market: Value Chain
- List of Raw Material Supplier
- List of Manufacturers
- List of Distributors
- Profitability Analysis
- Forecast Factors - Relevance and Impact
- Covid-19 Impact Assessment
- PESTLE Analysis
- Porter Five Forces Analysis
- Geopolitical Tensions: Market Impact
- Regulatory Landscape
- Macro-Economic Factors
- U.S. Sectorial Outlook
- U.S. GDP Growth Outlook
- U.S. Consumer Goods Industry Overview
- Price Trend Analysis, 2019 - 2032
- Key Highlights
- Key Factors Impacting Product Prices
- Prices By Segments
- Regional Prices and Product Preferences
- U.S. Kitchen sinks Market Outlook: Historical (2019 - 2024) and Forecast (2025 - 2032)
- Key Highlights
- Market Size and Y-o-Y Growth
- Absolute $ Opportunity
- Market Size (US$ Mn) Analysis and Forecast
- Historical Market Size Analysis, 2019-2024
- Current Market Size Forecast, 2025-2032
- U.S. Kitchen sinks Market Outlook: Product
- Introduction / Key Findings
- Historical Market Size (US$ Mn) Analysis By Product , 2019 - 2024
- Current Market Size (US$ Mn) Forecast By Product , 2025 - 2032
- Undermount Sinks
- Topmount / Drop‑in Sinks
- Farmhouse / Apron‑Front Sinks
- Integrated / Seamless Sinks
- Market Attractiveness Analysis: Product
- U.S. Kitchen sinks Market Outlook: Material
- Introduction / Key Findings
- Historical Market Size (US$ Mn) Analysis By Material, 2019 - 2024
- Current Market Size (US$ Mn) Forecast By Material, 2025 - 2032
- Stainless Steel Sinks
- Stone‑Based / Composite Sinks
- Ceramic / Fireclay Sinks
- Misc.
- Market Attractiveness Analysis: Material
- U.S. Kitchen sinks Market Outlook: Type
- Introduction / Key Findings
- Historical Market Size (US$ Mn) Analysis By Bowl Type, 2019 - 2024
- Current Market Size (US$ Mn) Forecast By Bowl Type, 2025 - 2032
- Single Bowl
- Double Bowl
- Triple Bowl
- Market Attractiveness Analysis: Type
- U.S. Kitchen sinks Market Outlook: End-user
- Introduction / Key Findings
- Historical Market Size (US$ Mn) Analysis By End-user, 2019 - 2024
- Current Market Size (US$ Mn) Forecast By End-user, 2025 - 2032
- Residential
- Commercial
- Market Attractiveness Analysis: End-user
- Key Highlights
- U.S. Kitchen sinks Market Outlook: Region
- Key Highlights
- Historical Market Size (US$ Mn) Analysis By Region, 2019 - 2024
- Current Market Size (US$ Mn) Forecast By Region, 2025 - 2032
-
- Northeast
- Southeast
- Midwest
- Southwest
- West
-
- Market Attractiveness Analysis: Region
- Northeast Kitchen sinks Market Outlook: Historical (2019 - 2024) and Forecast (2025 - 2032)
- Key Highlights
- Pricing Analysis
- Historical Market Size (US$ Mn) Analysis By Market, 2019 - 2024
- By Product
- By Material
- By Bowl Type
- By End-user
- Current Market Size (US$ Mn) Forecast By Product, 2025 - 2032
- Undermount Sinks
- Topmount / Drop‑in Sinks
- Farmhouse / Apron‑Front Sinks
- Integrated / Seamless Sinks
- Current Market Size (US$ Mn) Forecast By Material , 2025 - 2032
- Stainless Steel Sinks
- Stone‑Based / Composite Sinks
- Ceramic / Fireclay Sinks
- Current Market Size (US$ Mn) Forecast By Bowl Type , 2025 - 2032
- Single Bowl
- Double Bowl
- Triple Bowl
- Current Market Size (US$ Mn) Forecast By End-user, 2025 - 2032
- Residential
- Commercial
- Market Attractiveness Analysis
- Southwest Kitchen sinks Market Outlook: Historical (2019 - 2024) and Forecast (2025 - 2032)
- Key Highlights
- Pricing Analysis
- Historical Market Size (US$ Mn) Analysis By Market, 2019 - 2024
- By Product
- By Material
- By Bowl Type
- By End-user
- Current Market Size (US$ Mn) Forecast By Product, 2025 - 2032
- Undermount Sinks
- Topmount / Drop‑in Sinks
- Farmhouse / Apron‑Front Sinks
- Integrated / Seamless Sinks
- Current Market Size (US$ Mn) Forecast By Material , 2025 - 2032
- Stainless Steel Sinks
- Stone‑Based / Composite Sinks
- Ceramic / Fireclay Sinks
- Current Market Size (US$ Mn) Forecast By Bowl Type , 2025 - 2032
- Single Bowl
- Double Bowl
- Triple Bowl
- Current Market Size (US$ Mn) Forecast By End-user, 2025 - 2032
- Residential
- Commercial
- Market Attractiveness Analysis
- West Kitchen sinks Market Outlook: Historical (2019 - 2024) and Forecast (2025 - 2032)
- Key Highlights
- Pricing Analysis
- Historical Market Size (US$ Mn) Analysis By Market, 2019 - 2024
- By Product
- By Material
- By Bowl Type
- By End-user
- Current Market Size (US$ Mn) Forecast By Product, 2025 - 2032
- Undermount Sinks
- Topmount / Drop‑in Sinks
- Farmhouse / Apron‑Front Sinks
- Integrated / Seamless Sinks
- Current Market Size (US$ Mn) Forecast By Material , 2025 - 2032
- Stainless Steel Sinks
- Stone‑Based / Composite Sinks
- Ceramic / Fireclay Sinks
- Current Market Size (US$ Mn) Forecast By Bowl Type , 2025 - 2032
- Single Bowl
- Double Bowl
- Triple Bowl
- Current Market Size (US$ Mn) Forecast By End-user, 2025 - 2032
- Residential
- Commercial
- Market Attractiveness Analysis
- Southeast Kitchen sinks Market Outlook: Historical (2019 - 2024) and Forecast (2025 - 2032)
- Key Highlights
- Pricing Analysis
- Historical Market Size (US$ Mn) Analysis By Market, 2019 - 2024
- By Product
- By Material
- By Bowl Type
- By End-user
- Current Market Size (US$ Mn) Forecast By Product, 2025 - 2032
- Undermount Sinks
- Topmount / Drop‑in Sinks
- Farmhouse / Apron‑Front Sinks
- Integrated / Seamless Sinks
- Current Market Size (US$ Mn) Forecast By Material , 2025 - 2032
- Stainless Steel Sinks
- Stone‑Based / Composite Sinks
- Ceramic / Fireclay Sinks
- Current Market Size (US$ Mn) Forecast By Bowl Type , 2025 - 2032
- Single Bowl
- Double Bowl
- Triple Bowl
- Current Market Size (US$ Mn) Forecast By End-user, 2025 - 2032
- Residential
- Commercial
- Market Attractiveness Analysis
- Midwest Kitchen sinks Market Outlook: Historical (2019 - 2024) and Forecast (2025 - 2032)
- Key Highlights
- Pricing Analysis
- Historical Market Size (US$ Mn) Analysis By Market, 2019 - 2024
- By Product
- By Material
- By Bowl Type
- By End-user
- Current Market Size (US$ Mn) Forecast By Product, 2025 - 2032
- Undermount Sinks
- Topmount / Drop‑in Sinks
- Farmhouse / Apron‑Front Sinks
- Integrated / Seamless Sinks
- Current Market Size (US$ Mn) Forecast By Material , 2025 - 2032
- Stainless Steel Sinks
- Stone‑Based / Composite Sinks
- Ceramic / Fireclay Sinks
- Current Market Size (US$ Mn) Forecast By Bowl Type , 2025 - 2032
- Single Bowl
- Double Bowl
- Triple Bowl
- Current Market Size (US$ Mn) Forecast By End-user, 2025 - 2032
- Residential
- Commercial
- Market Attractiveness Analysis
- Competition Landscape
- Market Share Analysis, 2024
- Market Structure
- Competition Intensity Mapping By Market
- Competition Dashboard
- Apparent Production Capacity
- Company Profiles (Details - Overview, Financials, Strategy, Recent Developments)
- Blanco America, Inc.
- Overview
- Segments and Products
- Key Financials
- Market Developments
- Market Strategy
- Crown Products (Kent) Limited
- Elkay Manufacturing Company
- Franke Kitchen Systems, LLC
- Huida Sanitary Ware Co., Ltd.
- JULIEN INC.
- Kohler Co.
- Kraus USA INC.
- LIXIL Corporation
- Moen Incorporated
- Mountain Plumbing Products
- Roca Sanitario, S.A.
- ROHL LLC.
- Schock GmbH
- Stern-Williams Co. Inc.
- Blanco America, Inc.
- Appendix
- Research Methodology
- Research Assumptions
- Acronyms and Abbreviations


- Home Appliances
- U.S. Kitchen Sinks Market
U.S. Kitchen Sinks Market Size, Share, and Growth Forecast, 2025 - 2032
U.S. Kitchen Sinks Market By Product (Undermount Sinks, Others.), Material (Stainless Steel Sinks; Others), Bowl Type (Single Bowl, Double Bowl, Triple Bowl), End-user (Residential, Commercial), and Regional Analysis for 2025 - 2032
U.S. Kitchen Sinks Market Size and Trends Analysis
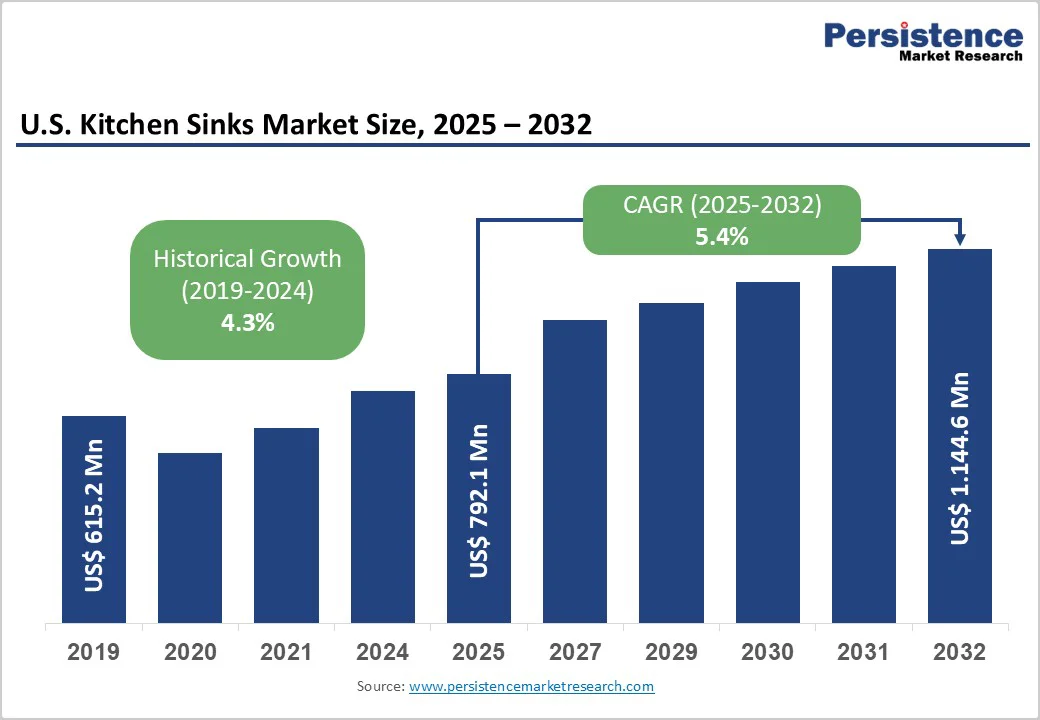
The U.S. kitchen sinks market size is likely to be valued at US$792.1 Million in 2025 and is expected to reach US$1,144.6 Million by 2032, growing at a CAGR of 5.4% during the forecast period from 2025 to 2032, driven by an ageing national housing stock, with the median home age surpassing 39 years and prompting widespread kitchen upgrades and fixture replacements.
The residential sector remains the primary demand generator, while commercial applications show faster momentum supported by hospitality and foodservice recovery. Material innovation continues to shape product evolution, with stainless steel retaining market leadership and stone-based composite sinks emerging as the fastest-growing category.
Key Industry Highlights
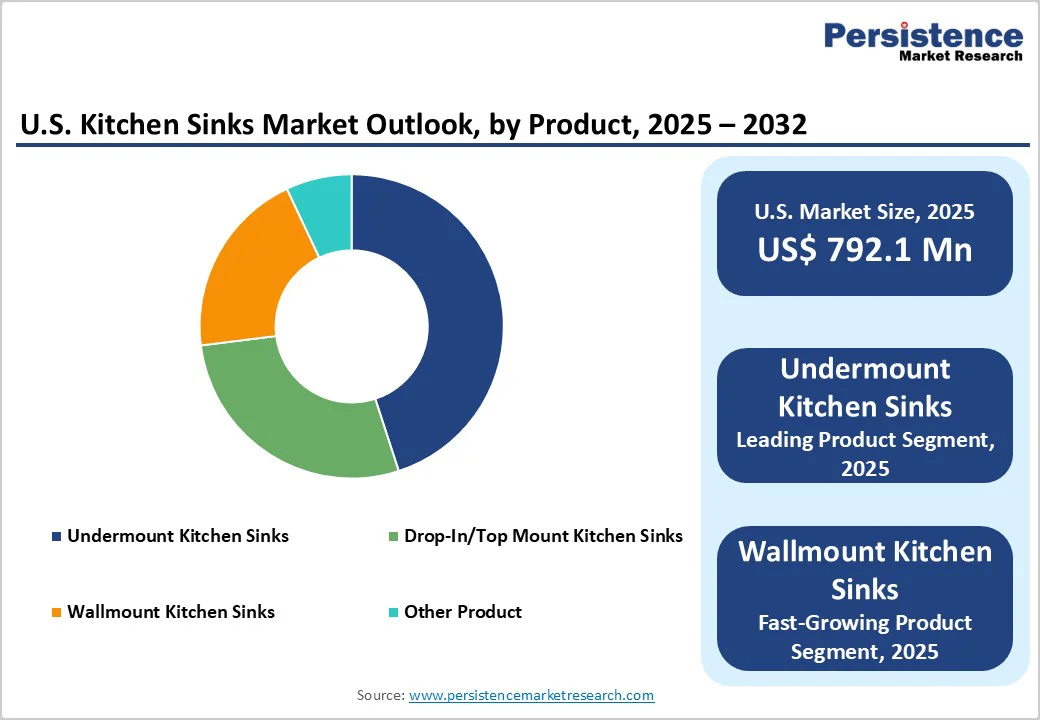
- Undermount sinks secure market dominance with a 47.7% share in 2025, driven by seamless countertop integration demand.
- Stainless steel maintains material leadership with a commanding 56.6% market share backed by durability and hygiene advantages.
- Residential end users lead the market with a 76.6% share supported by the large U.S. housing base and sustained renovation spending.
- Stone-based composite sinks register the fastest material growth as consumers shift toward premium aesthetic and performance-oriented designs.
- Topmount sinks show strong momentum as affordability and DIY-friendly installation attract cost-conscious households.
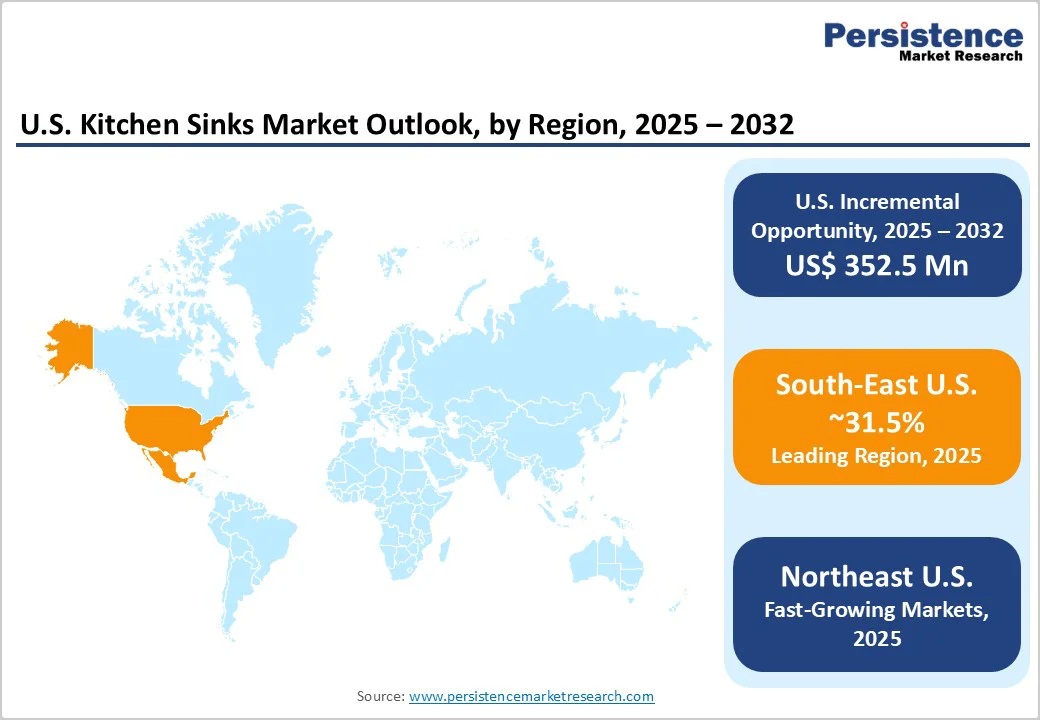
- The Southeast emerges as the leading region with a 27.5% share supported by high housing starts and strong population inflows.
| Key Insights | Details |
|---|---|
|
U.S. Kitchen Sinks Market Size (2025E) |
US$792.1 Mn |
|
Market Value Forecast (2032F) |
US$1,144.6 Mn |
|
Projected Growth CAGR (2025-2032) |
5.4% |
|
Historical Market Growth (2019-2024) |
4.8% |
Market Factors - Growth, Barriers, and Opportunity Analysis
Growth Analysis - Multifunctional Kitchen Design and Home Renovation Investment Activity
Multifunctional kitchen design is reshaping the kitchen sinks market, driven by homeowners’ demand for integrated appliances and efficient workspaces. According to the NKBA 2025 Kitchen Trends Report, 91% of professionals note the popularity of multifunctional appliances, with 83% highlighting sinks that combine food prep, serving, and washing functions.
Modern sinks feature cutting boards, drying racks, integrated faucets, and prep zones, addressing homeowners’ desires for both functionality and aesthetics. With 20 million U.S. homes in prime remodeling years and kitchen renovations averaging US$25,000–US$40,000, multifunctional sinks enhance workflow, property value, and style, making them essential investments in contemporary kitchens.
Wellness-Oriented Design and Sustainability Priorities in Residential Kitchens
Wellness and sustainability are increasingly shaping the kitchen sinks market, as homeowners design kitchens that support healthy living and environmental responsibility. The NKBA 2025 Kitchen Trends Report highlights that 74% of respondents note the popularity of steam and air-fry ovens for healthier cooking, while 53% anticipate kitchens becoming more connected to outdoor spaces over the next three years. Water and air quality are top priorities, with 72% and 62% of respondents emphasizing their importance.
Water-efficient sink fixtures, such as EPA WaterSense-certified faucets, reduce flow to 1.5 gallons per minute, cutting consumption by up to 50%, supporting both wellness and cost savings. Sustainability drives the adoption of eco-conscious materials such as fireclay, fully recyclable at end-of-life, and composite granite, made with recycled stone dust. Biophilic design is also gaining traction, with herb gardens and outdoor-integrated kitchens becoming popular. These innovations position multifunctional, sustainable sinks as essential for health-conscious, eco-friendly kitchens.
Barrier Analysis - Volatile Raw Material Costs and Supply Chain Disruptions
Raw material cost volatility poses a significant challenge to profitability in the kitchen sinks market. Stainless steel, the primary sink material, saw price increases in Q1 2025 as nickel and ferrochrome costs rose due to higher chrome ore prices. Quarterly stainless steel cost hikes of 2–8% directly elevate production expenses, forcing manufacturers to either absorb costs or raise prices, which can deter mid-range consumers. Homeowners with remodeling budgets of US$25,000-US$40,000 may delay or scale projects, while supply chain disruptions extending lead times to 6–8 weeks further squeeze margins. Smaller manufacturers, lacking economies of scale, face reduced competitiveness and slower market growth.
Opportunity Analysis - Manufacturers Benefit from Demand for Eco-Friendly Sinks Made from Recycled Composites and Fireclay
The market offers strong potential for eco-friendly designs using recycled composites, granite, and fireclay. According to the NKBA 2025 report, over 75% of design projects emphasize natural textures and sustainable materials, reflecting consumer demand for environmentally responsible yet aesthetically appealing sinks. These materials provide durability, heat resistance, and easy maintenance, ideal for modern kitchens.
Manufacturers can capitalize by aligning with green building initiatives and sustainability certifications, with green-certified fixture sales growing nearly 30%. Integrating recycled materials with water-saving technologies allows brands to deliver comprehensive sustainable solutions, command premium pricing, and strengthen their reputation as leaders in eco-conscious kitchen design.
Smart, Multifunctional Sinks with Touchless and Space-Saving Features Propel Market Innovation
Smart, multifunctional sink systems are emerging as a key innovation in the U.S. kitchen sinks market, driven by consumer demand for convenience, hygiene, and functionality in compact spaces. Touchless faucets, temperature control, and modular accessories reflect a shift toward connected kitchen ecosystems. KBIS 2025 highlights prototypes that reduce water waste by up to 40%, emphasizing efficiency and sustainability. Manufacturers can capitalize by integrating app-based monitoring, antimicrobial coatings, and water-efficiency sensors. With 91% of designers recommending multifunctional solutions, investing in R&D for space optimization and digital controls enables companies to deliver differentiated, tech-driven sinks that meet urban homeowners’ needs while enhancing competitive positioning.
Category-wise Analysis
Product Insights
Undermount sinks continue to dominate the market, commanding a 47.7% share in 2025, largely due to their sleek design and seamless integration with countertops. By installing beneath the countertop surface, these sinks create a flush transition that eliminates rim-mounted edges, allowing for easy sweeping of debris and improved sanitation. Their aesthetic appeal aligns closely with modern kitchen trends, particularly open-concept layouts, where uninterrupted surfaces enhance visual continuity and contribute to a sense of spaciousness and sophistication. This combination of functionality and style has solidified undermount sinks as the preferred choice for contemporary kitchen designs.
Despite the prominence of undermount sinks, topmount sinks are experiencing notable growth driven by practicality and cost-effectiveness. These sinks sit atop the countertop, simplifying installation and making them particularly attractive to DIY enthusiasts and budget-conscious homeowners. Their straightforward mounting process reduces labor costs and installation complexity, providing a viable alternative for renovations or quick kitchen upgrades. This accessibility, paired with competitive pricing, is enabling topmount sinks to gain traction even in markets where undermount models have traditionally dominated.
Material Insights
Stainless steel sinks continue to lead the market, capturing 56.6% share in 2025, driven by their longstanding reputation for durability, hygiene, corrosion resistance, and cost-effectiveness. The material’s inherent properties, including heat resistance, scratch resilience, and antimicrobial characteristics, align closely with functional kitchen requirements and food safety standards. Stainless steel sinks also offer flexibility in gauge specifications, such as 16-gauge and 18-gauge options, allowing manufacturers to differentiate products by price point without compromising performance. Modern soundproofing solutions, including undercoating treatments and vibration-dampening pads, have further enhanced the user experience by mitigating historical concerns over noise during use.
Stone-based composite sinks are experiencing the fastest growth in the market, fueled by their aesthetic versatility, durability, and color customization options. These sinks are typically made from 70–80% crushed granite or quartz combined with acrylic resins, providing exceptional scratch resistance, stain immunity, and heat tolerance exceeding 500°F. Beyond performance, composite materials allow for a wide range of color palettes, including black, grey, beige, and specialty finishes, enabling seamless integration with contemporary countertop designs and cabinetry. This combination of functional and aesthetic advantages positions composite sinks as a compelling alternative to traditional stainless-steel offerings, particularly for consumers seeking design-driven kitchen solutions.
End-user Insights
The residential segment dominates the U.S. kitchen sinks market, accounting for 76.6% of market share in 2025. This reflects the vast installed base of approximately 130 million housing units and ongoing renovation activity driven by ageing homes. Homeowner decisions emphasize aesthetics, budget, and DIY feasibility, generating demand across entry-level topmount sinks to premium integrated systems. Residential remodels accounted for US$603 Billion in expenditures in 2024, with sinks serving as essential infrastructure in both minor updates and full-scale renovations. Single-family housing starts maintained an annualized rate of 890,000 units in August 2025, sustaining new construction demand alongside replacement markets.
Commercial applications are growing at the fastest CAGR, driven by hospitality recovery, foodservice expansion, and institutional facility upgrades. This segment includes restaurants, hotels, catering operations, healthcare, educational institutions, and commercial offices requiring high-capacity, durable, NSF-certified sinks. Regulatory mandates on food safety, sanitation, and hygiene necessitate continuous equipment upgrades and facility expansions, further supporting demand for specialized commercial sink solutions.
Regional Insights
West U.S. Kitchen Sinks Market Trends
The West region captures 23.5% market share, demonstrating the fastest regional growth at 4.3% CAGR driven by the technology industry's prosperity, environmental consciousness, and progressive regulatory frameworks mandating water-efficient fixtures. California, Washington, Oregon, and Colorado demonstrate strength, with high disposable incomes enabling premium product adoption and tech-savvy consumers demanding smart-home integration capabilities.
The region pioneered water conservation standards, with California implementing Title 20 requirements limiting kitchen faucet flow rates to 1.8 GPM, creating regulatory compliance opportunities for innovative manufacturers.
Silicon Valley professionals and urban millennials favor Wi-Fi-enabled fixtures, smart kitchen systems, and sustainable materials, aligning with environmental values and technology adoption preferences. Manufacturers frequently pilot app-based firmware upgrades, smart functionality, and connected appliance features in Western markets before nationwide rollouts, utilizing data-rich feedback for product refinement.
Southeast U.S. Kitchen Sinks Market Trends
The Southeast region commands 27.5% market share, establishing leadership through robust demographic growth, favorable construction economics, and cultural preferences sustaining residential and commercial kitchen investment momentum.
The region's population migration inflows, lower land acquisition costs, and construction expense advantages 12-15% below national averages enable aggressive housing development supporting kitchen infrastructure demand. Housing starts in Southern states demonstrate particular strength, with the region accounting for 48% of multifamily completions, totaling 292,000 units in 2024, creating concentrated procurement opportunities for sink manufacturers.
Florida’s robust real estate and tourism sectors also boost the need for high-performance kitchen fixtures in homes and hospitality establishments. Georgia’s growing tech and logistics industries are spurring residential expansion. The Southeast’s combination of affordability, employment opportunities, and lifestyle appeal makes it a long-term growth hub for kitchen sink manufacturers serving both new builds and renovation markets.
Competitive Landscape
The U.S. kitchen sinks market exhibits a moderately fragmented structure, with competition shaped by both long-established brands and design-focused specialists. Leading companies such as Kohler Co., Elkay Manufacturing Company, Franke Kitchen Systems, Blanco America, and Moen Incorporated hold strong market positions through extensive product lines, multi-channel distribution, and consistent innovation across stainless steel, composite, and fireclay categories. These players leverage strong brand equity and nationwide retail partnerships to secure share in the residential remodeling segment, where design upgrades and premium finishes drive differentiation.
Competitive pressure remains high as mid-tier brands and e-commerce-driven entrants target value-oriented consumers with aggressive pricing and expanded style options. Overall, the landscape balances brand heritage, material innovation, and channel strength, creating a dynamic environment for both established leaders and emerging competitors.
Key Industry Developments
- In February 2025, BLANCO announced its KBIS 2025 showcase, celebrating 100 years, unveiling the next-generation INTEOS workstation sink series. Highlighting German-engineered innovation and advanced workflow design, the presentation reinforced BLANCO’s leadership in premium, holistic kitchen water solutions.
- In August 2023, BLANCO expanded its U.S. kitchen portfolio with the CATRIS Flexo Filter faucet, offering dual-function filtered and non-filtered water, seamless integration with filtration systems, multiple finishes, and enhanced convenience, reinforcing its premium, space-saving kitchen solutions.
Companies Covered in U.S. Kitchen Sinks Market
- Blanco America, Inc.
- Crown Products Limited
- Elkay Manufacturing Company
- Franke Kitchen Systems, LLC
- Huida Sanitary Ware Co., Ltd.
- JULIEN INC.
- Kohler Co.
- Kraus USA INC.
- LIXIL Corporation
- Moen Incorporated
- Mountain Plumbing Products
- Roca Sanitario, S.A.
- ROHL LLC.
- Schock GmbH
- Stern-Williams Co. Inc.
- Swan Corporation
- Vigo Industries
Frequently Asked Questions
The U.S. kitchen sinks market is expected to reach US$1,144.6 Million by 2032, growing from US$792.1 Million in 2025 at a 5.4% CAGR.
Multifunctional kitchen design aligned with home-renovation spending and wellness-plus-sustainability priorities collectively drives demand in the U.S. kitchen sinks market.
Undermount sinks lead the product category with a 47.7% share, driven by their seamless aesthetics and strong compatibility with modern stone and solid-surface countertops.
The Southeast dominates the U.S. kitchen sinks market, holding 27.5% share, driven by rapid population growth in states, fueling residential construction and renovation demand.
A key opportunity in the U.S. kitchen sinks market lies in expanding eco-friendly and smart multifunctional sink offerings that leverage recycled composite and fireclay materials alongside touchless, space-saving, and water-efficient technologies.
Major players include Blanco America, Inc., Kohler Co., and Elkay Manufacturing Company, focusing on innovation and sustainability.


